How to make most of the digital marketing and keep the client happy? That's the question marketing professionals were asking themselves for a long time. Luckily, digital marketing analytics are here to help.
How to make most of the digital marketing and keep the client happy? That's the question marketing professionals were asking themselves for a long time. Luckily, digital marketing analytics are here to help.

Aug 24 2021 ● 6 min read

Whether you’re a small agency with big ambitions or a long-running advertising giant, there are many things that you have in common. One of them is marketing analytics. Sure, experience in the marketing field and keeping up with the trends help make good decisions. But in reality, each decision you make has to be backed up by data. If not for yourself, then at least for your client.
While your clients can be fickle, they are not as unhappy with agency work as it can appear. In a study commission by Google and 4A's (i.e. American Association of Advertising Agencies), these are the top 4 things brands are happy about when working with their agencies:
In conclusion: the innovation you bring, together with strategy, partnerships and execution, play the leading role in making your client happy.
While we can’t speak for innovation and partnerships you offer - that’s down to your creative and charisma game - we can indeed provide some insights into the digital strategy and campaign execution.
Short answer: data-backed decisions. Long answer: not only do you have to make good decisions, but you also have to showcase them to your client and build trust. This is where your marketing analysis practices come into play.
To build that trust and to showcase how impeccable your analytics game is, we have compiled six best practices that you can implement to build client trust in your digital strategy. In turn, it should lead to campaign execution that exceeds your client’s expectations.
First and foremost, put down a basic structure of your analytics process. To do that, answer the following questions:
Write up your answers and see where it got you. It should give you an outline of what type of client you’re facing, what their problems and interests are, and how you will approach the next steps.
Whether your client is new, old or just a prospect, you must show what goals your campaigns will be achieving.
At the end of 2020, the leading KPI for evaluating marketing effectiveness was sales or revenues (36%). While as an agency, you can’t influence these directly (there are sales departments after all), you can control the next item on the list: leads (22% of respondents identified it as leading KPI).
Think about how your marketing strategy and campaign actions can generate more leads for your client. Sure, if you’re running campaigns for an e-commerce platform, your ultimate goal are sales. But for the rest of us - leads.
Third on the list of the most coveted goals: engagement (14%). Whether you reach that on social media or adverts, your client must know that the audience is interested in their offering.
Sales, leads and engagement are critical in building a healthy marketing channel. Each channel have their own specifics, but these six are THE GAME when it comes to reporting:
When you put these metric categories together in a single report, it might look something like this:
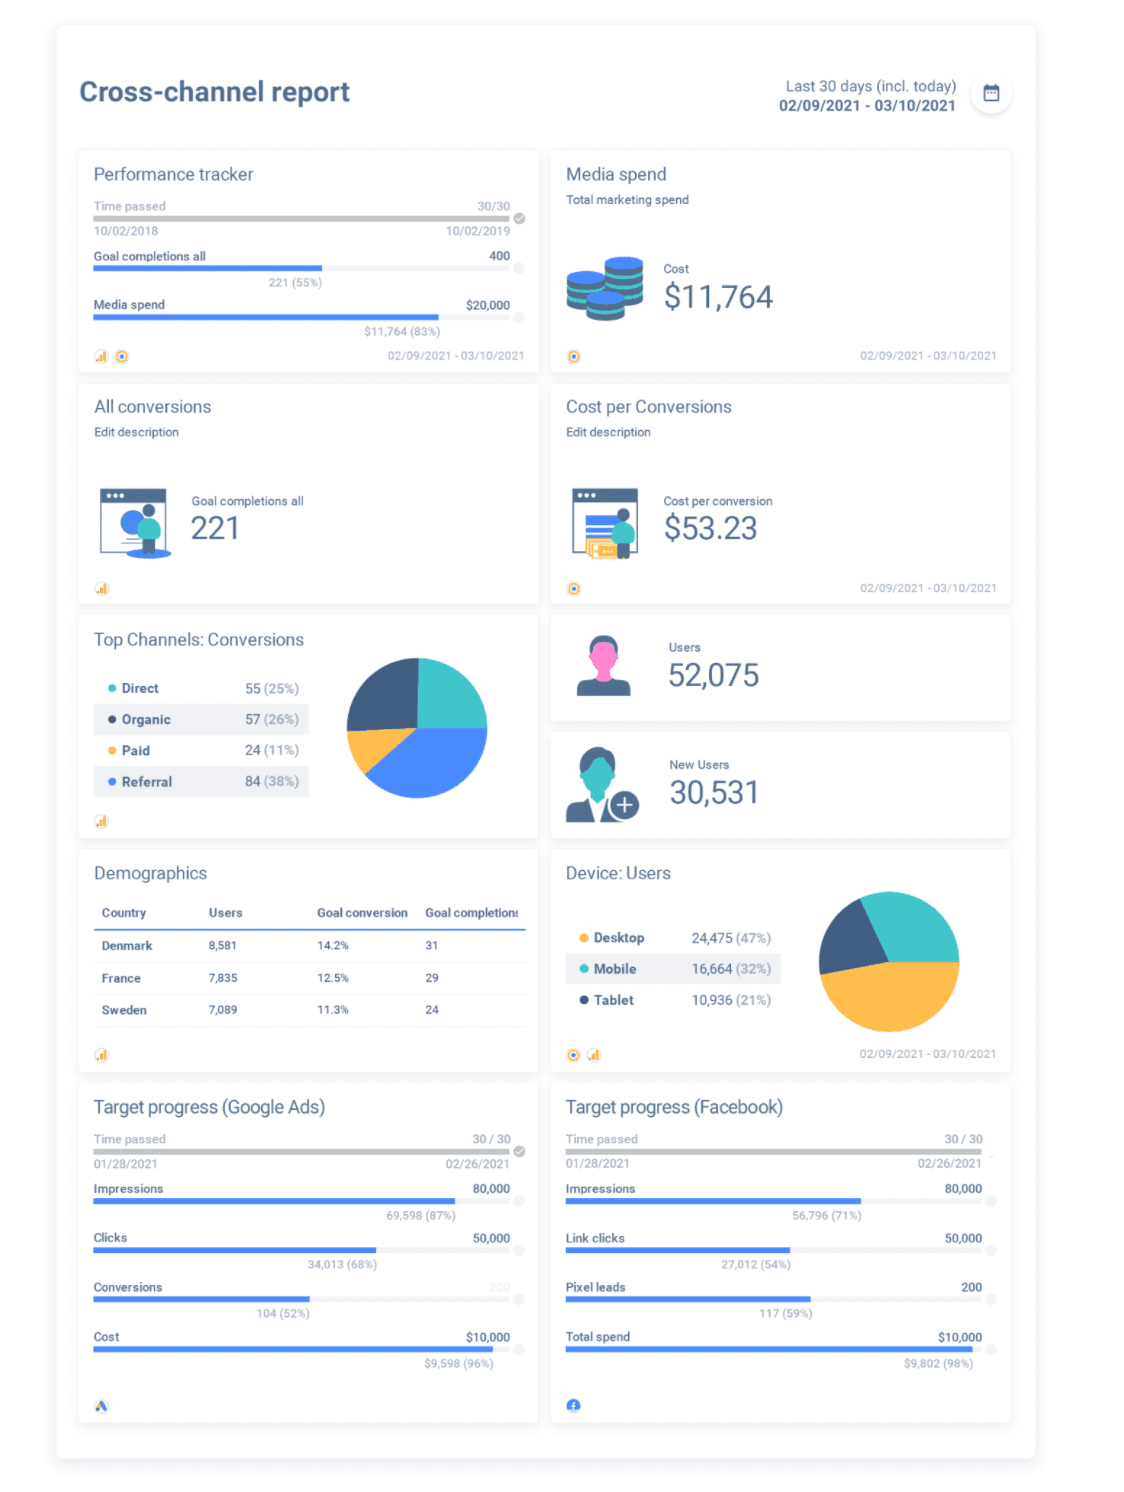
You can put together the best report on all goals listed above. But if no one reads it, will it make a difference? Probably not.
That’s why the visual representation of any findings is a crucial step in any marketing analysis. Visual information is processed a whopping 60k times faster than text. This gives clear advantages to a well-structured, visual report over complex Excel sheets and long Word documents.
Knowing this information about human learning gave us an idea of how to introduce complex numbers fast - and that’s what Whatagraph is for. Consider laying out all your goals and metrics into a single report and represent them visually only. How's that for a challenge?
Schedule your reporting, especially with older clients. Help them develop a habit of expecting you to check in with your campaign performance. Once you do, you’ll see an appreciation for quick insights and timely delivery. And most importantly - your client will feel safe with the knowledge of your success!
Choose a tool like Whatagraph to schedule and deliver those campaign reports automatically on a set timer. This will save you time and make you look more professional in front of your clients.
These six practices will help you set up a healthy analytics process. Sure, you will need to adjust it to fit your agency’s needs, but nothing is impossible with high-end automation and high-tech report-building techniques. Give Whatagraph a chance to help you become the best at marketing strategy based on real numbers!
Published on Aug 24 2021
WRITTEN BY
Indrė Jankutė-CarmaciuIndrė is a copywriter at Whatagraph with extensive experience in search engine optimization and public relations. She holds a degree in International Relations, while her professional background includes different marketing and advertising niches. She manages to merge marketing strategy and public speaking while educating readers on how to automate their businesses.

By submitting this form, you agree to our privacy policy