7 Key Content Marketing Metrics to Report on in 2024
It’s all well and good being in the content marketing game but it’s essential for you to be tracking the impact of your efforts. By tracking certain content marketing efforts you’ll be able to optimize your content marketing strategy, predict trends that you should be aiming for in the coming months and, most importantly, understand how to sell to your target demographic better.
Content Marketing Metrics You Need to Track in 2024
Track Lead Acquisition
Organic Search Traffic
What Is a Branded Search?
What Is a Non-Branded Search?
Third-Party Website Referrals (Backlinks)
Non-Paid Social Media Efforts
Track Email Opens & Unsubscribe Rate
Why Should You Track Open Rate?
Why Should You Track Unsubscribe Rate?
Track Social Engagements
What Is Social Media Reach?
What Are Social Media Impressions?
Track On-site Actions
Heat Mapping
Navigation
CTA’s
Conversational Marketing Tools
Track Site Visitors’ Location
Track Exit & Bounce Rate
What’s a Bounce Rate?
Why Should You Track Bounce Rate? Why Should You Track an Exit Rate?
What’s an Exit Rate?
Why Should You Track an Exit Rate?
What Should You Do with These Content Marketing Metrics?
How Should You Present These Content Marketing Metrics?
We’re not talking about your churn rate or customer lifetime value here, these metrics are strictly for your content marketing efforts. In tracking your content marketing metrics you’ll be able to deliver some valuable insights to your sales, PPC, and business development teams so they can amend their strategies for the better.
What are Content Marketing Metrics?
Content Marketing Metrics are essentially data points from your content marketing efforts. We’ll get into specific examples within this blog but the metrics you’ll be able to report on will largely be determined by the tools that you have at hand. Make sure you’ve got platform ready reporting tools set up so you’re able to report on the metrics we suggest throughout this article.
Content Marketing Metrics You Need to Track in 2024
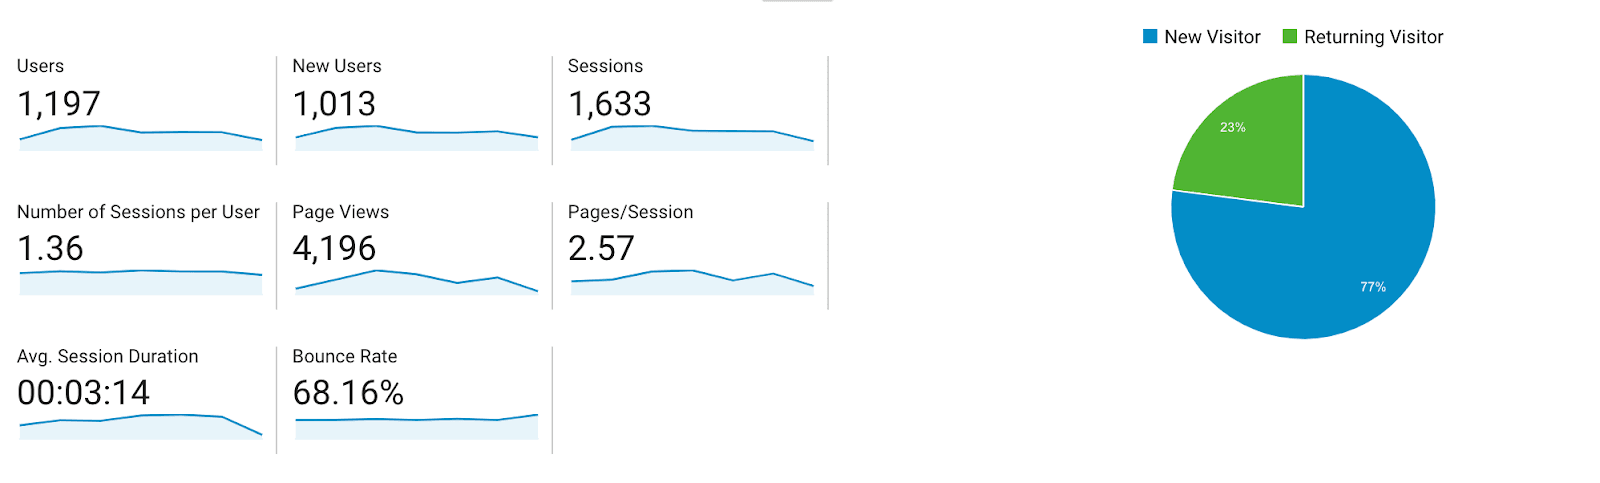
Google Analytics is a great tool for this. It can be all too easy to focus on acquiring new visitors, sure, this is an important metric too, but how can you tell if your content is valued? Returning visitors. If someone is returning it can mean one of two things, largely depending on the page they are visiting.
They are doing their research to potentially buy your product.
They value your content.
If you have returning visitors to site, especially to your blog, then you’re doing something right with the content you’re producing. Make sure you place a focus on new visitors certainly, but within the content marketing field put a focus on returning visitors to get an understanding on if your content is valued or not.
Track Lead Acquisition
Your content will be supporting the lead acquisition funnel, it’s important to know that it’s near impossible for you to truly get a total overview of the impact your content has on a lead journey. But, you can certainly get great insight. In lead acquisition you can focus and lay attribution to your content marketing strategies with:
Organic Search Traffic
Organic search traffic can work in one of two ways. It can be a branded or non-branded search. A branded search is when someone has typed your brand name into a search engine like Google or Bing. This search often comes from seeing some of your other content efforts, be it social media or offline efforts.
What Is a Branded Search?
A branded search often has a high click-through rate and a low bounce rate (more of that later). It means that the searcher knew about your brand beforehand and has taken the initiative to find out more. These branded organic searches often lead to a higher conversion rate.
What Is a Non-Branded Search?
A non-branded search is a chance for your brand to hit a larger amount of impressions (more of that later, too) and really push your brand name to new markets. A non-branded search means someone is searching for a piece of content and the search engine has valued your content as what they are looking for.
It’s an interesting way of getting your brand in front of new eyes and if you’re writing something that your target demographic is likely to be searching for then there’s more chance you have found a new customer in your reader. NB: These types of searches often have a much higher bounce rate.
Third-Party Website Referrals (Backlinks)
Referrals are among the highest converting leads for any brand. Identify sites that you can get referrals from and make sure you have an outreach process in place to get those precious backlinks to your site.
Backlinks not only help with your domain authority but they also send you potential customers that are that much more likely to convert than finding someone through a non-branded search.
Non-Paid Social Media Efforts
Social Media is often not the highest converting platform but for brand awareness it’s fantastic. People are idle when they’re on social media. Use this as an opportunity. You have the potential to interrupt and navigate their day, but know that getting them to make a large purchasing decision can often be tricky.
However, just because you’re not converting directly from your social media channels, doesn’t mean those channels aren’t aiding your conversion elsewhere or upping your branded searches.
All of your content marketing efforts will most likely affect the buyer’s decision at some point in the funnel. However, by focusing on these specific lead acquisition metrics you’ll be able to lay claim that it is most likely thanks to your content marketing strategy that these particular leads converted. Content marketing strategy improvements should be done based on data analysis.
Track Email Opens & Unsubscribe Rate
Why Should You Track Open Rate?
Email open rate gives a fantastic insight into how your content is perceived from your mailing list, as well as how enticing your “subject line” and “preview text” writing skills are. The important thing to remember is that you can play around with subject lines and preview text week in, week out on your mailing efforts. Try testing using first names, sender names and a little tip for you: negative subject lines get a much higher open rate!
The second insight you’ll get by tracking your email open rate is your content and brand perception. If someone is a fan of your brand or values your content they’ll be on autopilot in opening your email just by seeing your brand name as the sender.
If your newsletter maintains a strategy of minimal changes to subject lines and the preview text yet your open rate remains consistent or even grows, then you can rest assured that your content marketing efforts are well received.
Why Should You Track Unsubscribe Rate?
Unsubscribe rate may seem like a slightly negative metric to focus on in 2024 but the positive that can come out of it will ring true. If you’re ever trying something new with your email marketing strategy then this is always something you’ll need to look at.
Your unsubscribe number always, ideally, wants to be zero. For someone to make the effort of unsubscribing then you have really annoyed them. Make sure you pay close attention to this number. Even if it’s “only” a couple of people with a new email standout, think very carefully before you repeat that sort of content.
We discussed having a positive brand affinity with your open rate metrics, above. Your unsubscribe rate metric gives you an insight into your negative brand affinity and this is something you never want to be touching in your content marketing efforts in 2024 and beyond.
Track Social Engagements
Social engagements are key marketing metrics for you to track the success of your content marketing efforts. However, times are changing for 2023 and this is something you need to be aware of when deciding which social media metrics you’ll be tracking for the year.
Some of the social media giants, like Instagram and Twitter are eradicating likes and therefore eradicating vanity metrics that so many businesses and people alike have been pursuing. So many have always been chasing approval and validation through a “like”, but that’s all about to change...
With the eradication of likes on these social channels, will come the emphasis on genuine engagements such as: shares, comments, saves and direct messages. These are some of the statistics you’ll need to be tracking in 2024.
Make sure your content marketing efforts are focused on building communities rather than seeking validation. This will eventually lead to a successful brand presence within the social media realm and will ensure your content gains priority over other pieces of content that are still focussing on winning a double-tap.
Two more metrics you should be looking at for 2024 are Reach and Impressions, depending on your campaign goal. These are two metrics that people often get mixed up so let’s make define them.
What Is Social Media Reach?
Social media reach is the number of individuals that have seen your content. If your Instagram post scrolls across the screen often people then your reach for that post will be ten.
What Are Social Media Impressions?
Impressions are the number of times your piece of content has been seen, not necessarily by different people. For example, if your social media post reaches ten different people and each person scrolls past that social media post twice then your impressions will be 20.
Both of these metrics are so important for you to judge your brand awareness and the success of a particular piece of content. If you’re looking to reach as many eyes as possible and let your brand name and logo ring true with a campaign, then reach and impressions are metrics you need to be tracking.
The last metric that you can look towards is your follower growth. With genuine engagement comes shares, account tags and because of this, a growth in your digital community. Make sure you keep follower growth as a content marketing KPI and set yourself monthly goals to improve it.
Track On-site Actions
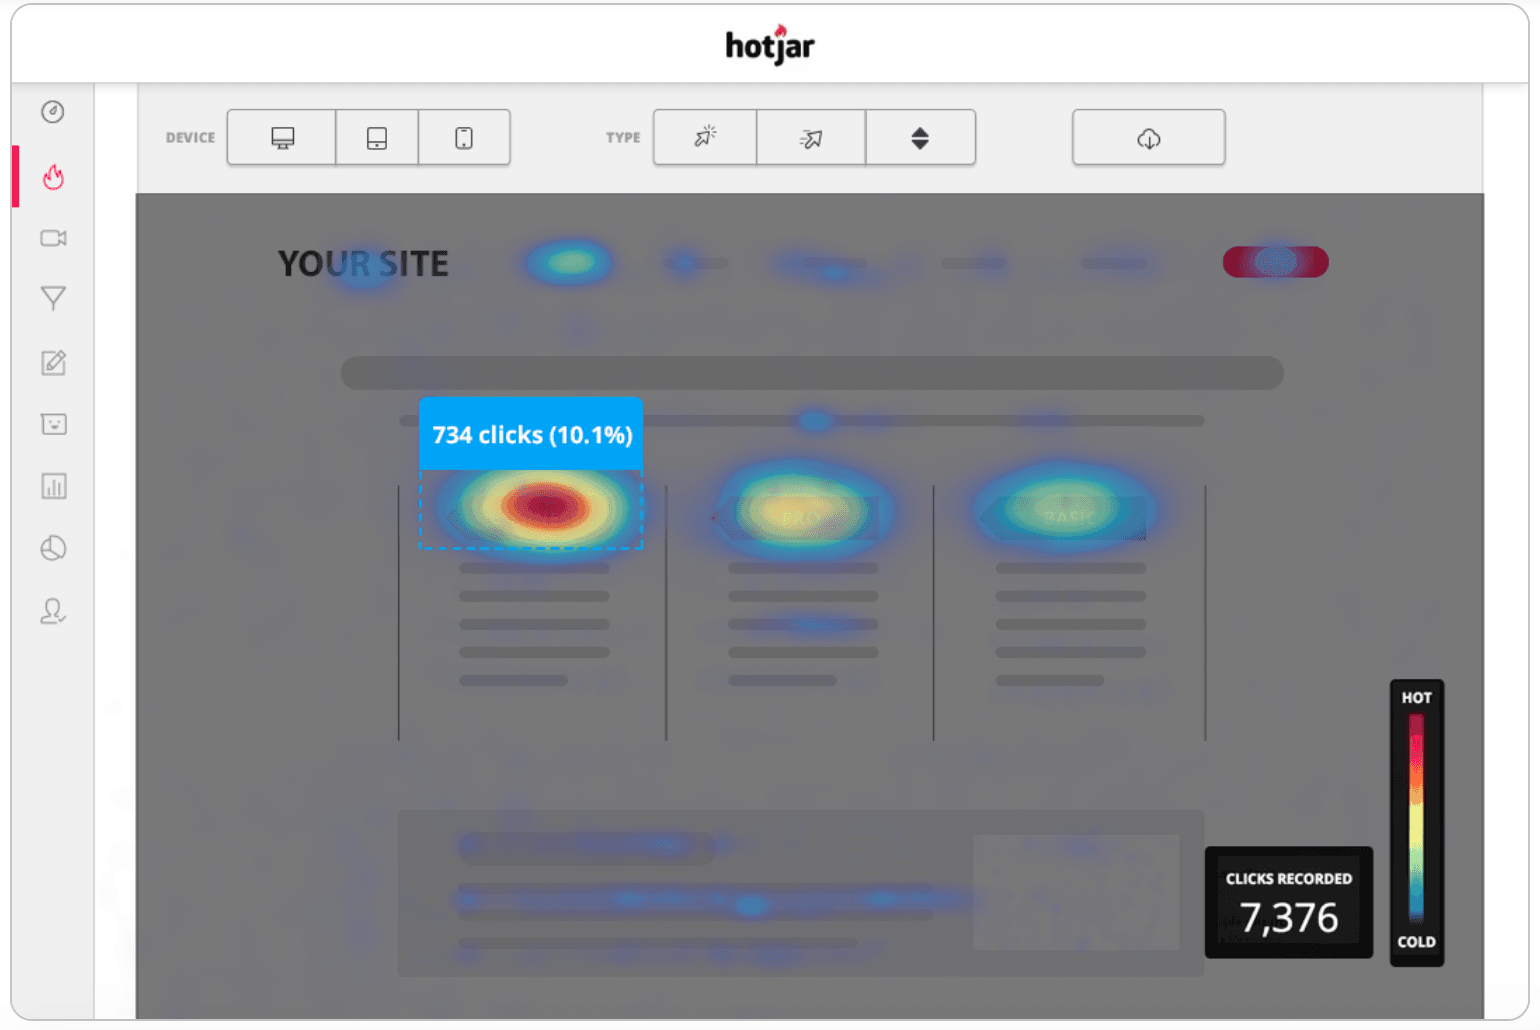
Heat Mapping
On-site actions can reveal a lot when it comes to your content, what’s displayed and what your customer feels like they need more of on a certain page. By using a heat mapping tool you’ll be able to see where your customers are clicking and get a gage on the content that they deem as most valuable.
Navigation
You’ll also be able to see where they are navigating to, from a particular page. This can help inform your on-site content strategy as you can either bring that information forward and present it on the page they navigated away from, or treat that click-through as a micro journey and adjust the content that follows so they don’t receive any repeated content.
CTA’s
Split test your CTA’s that you have on your pages as well. Perhaps certain wording will work better than others and you’ll often be surprised when your opinion goes up against data. In tracking the popularity of CTAs you’ll be able to better identify what your readers respond to and implement these CTAs into other areas of the sales journey.
Conversational Marketing Tools
Lastly, you’ll have the opportunity to track conversational marketing efforts. This can be in the form of a live chat or even a chatbot. Track the engagement you have with your conversational support marketing tools and see how you can optimize them. Perhaps you’ll need to change the wording you’re using within the conversation, perhaps you’ll need to change that initial “hello.”
Whatever it is, track when and where a person exits the chat and change that copy to keep them there.
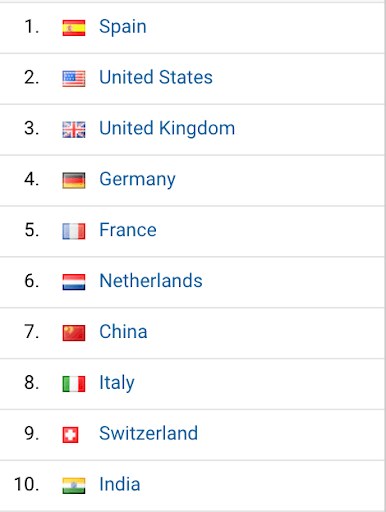
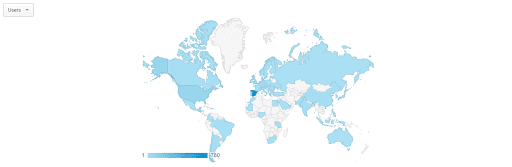
Track Site Visitors’ Location
Whereas some of the other metrics we’ve discussed will help you to deem if your content marketing is successful, tracking visitors’ locations as a metric will help dictate your content and perhaps even business growth strategy.
Make sure that location tracking for your website visitors is a metric you’re following for 2024. In tracking this metric you’ll be able to:
Create content that’s better targeted at your most popular markets.
Consider optimizing old content or creating new content into new languages.
Perhaps you’ll even be enlightened by your popularity in a certain part of the world and consider pushing your business reach efforts to an entirely new market.
Whatever action you take from this content marketing metric it will surely be one that benefits your go-to-market strategy for the future.
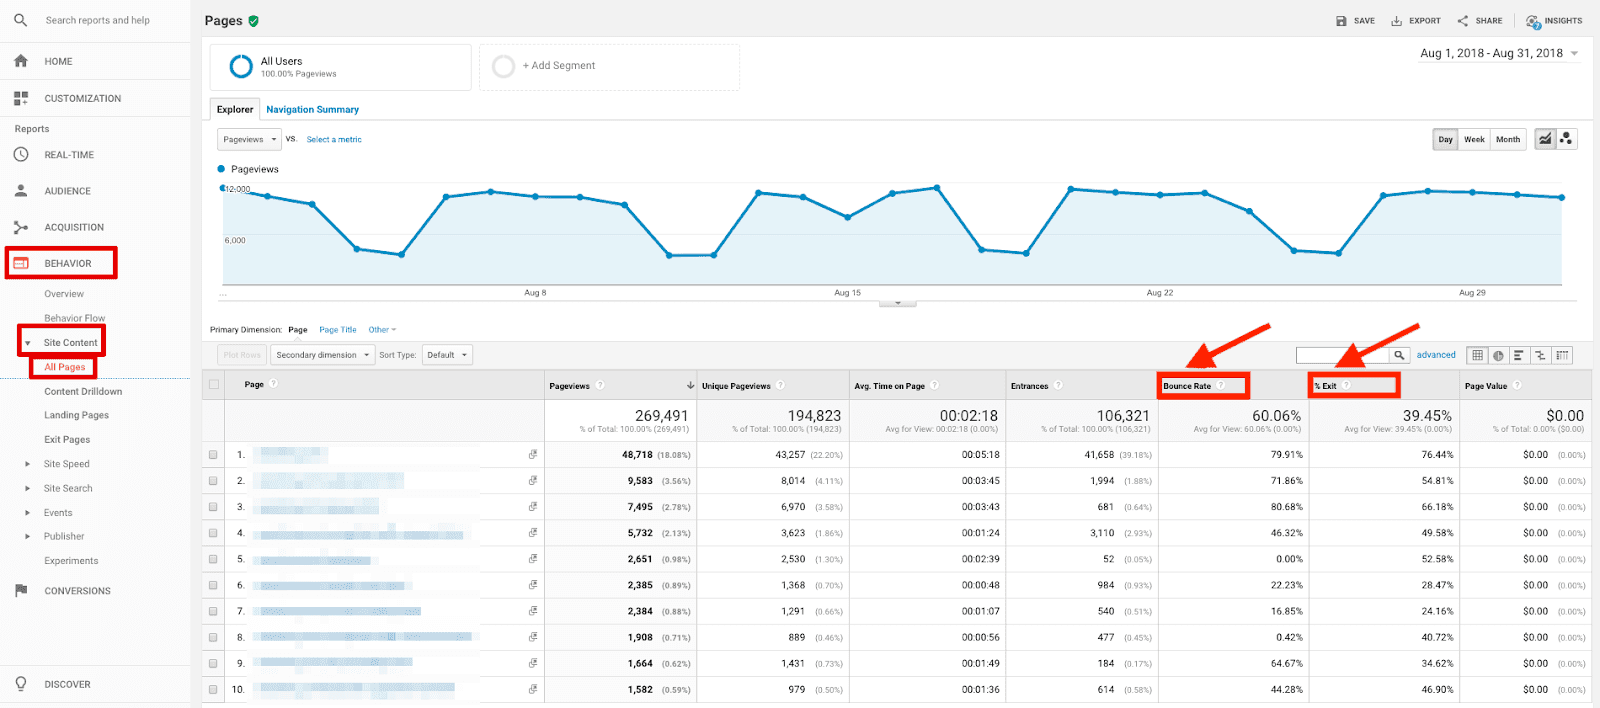
Track Exit & Bounce Rate
Two very similar features, so similar that they sit right next to each other in Google Analytics. Yet these two metrics can tell you very different things. What’s the difference?
What’s a Bounce Rate?
A Bounce Rate is someone who came to your website and left almost immediately. This is someone that did not navigate to any other pages within your website.
Why Should You Track Bounce Rate? Why Should You Track an Exit Rate?
Bounce Rate can inform your team on the step the user took before they came to your site. They could have clicked through from a social media post or even an invite to read a blog from an email send out. What’s important is that they bounced and you need to identify why. You can assume it’s largely down to one of these three things:
The title or copy that brought them to the page in the first place was misleading.
The page has such a poor UX design that the user didn’t want to be there a second longer.
The load speed of the page took too long and the visitor didn’t want to hang around.
Keep in mind it can be all of the above as well! The good thing to know is that normally it’s option one and normally that’s an easy fix. If it’s option two or three then you may have quite a bit of work on your hands.
What’s an Exit Rate?
An Exit Rate is someone that has entered your site, navigated to other pages of your site and decided to leave.
Why Should You Track an Exit Rate?
An exit rate can give you a great insight into your pages that may need a little more work. More often than not you’ll be able to identify the exact page that a user chose to leave your page. If you see a trending page with a high exit rate then take a look at that page and use other heat mapping tools to try and identify why users are leaving.
What Should You Do with These Content Marketing Metrics?
These Content Marketing Metrics are here to be learned from. There’s no point in reporting on data and not acting from it. Make sure you distribute the data to key stakeholders and suggest actionable items from the lessons you have learned.
Furthermore, this data should affect future areas of content marketing that you decide to invest in. Perhaps you’ll want to expand on a particular content subject that your customers showed a greater amount of interest in.
Perhaps some of these metrics end up tweaking your writing style or even your brand tone of voice guidelines. Whatever it is that you identify, the most important part is that you act on it. Content marketing is not something that anyone pins down and sticks with. It’s a constantly evolving game and these metrics will help you to stay at the forefront of your industry.
How Should You Present These Content Marketing Metrics?
Whether you’re reporting for a client, internal or external stakeholders, presentation is vital with your reporting structure. Steer clear of spreadsheets and create reports that are people-friendly. More so, use data blending so that those that are reading your reports have a better overview of your efforts across multiple channels.
Tools like Whatagraph do this perfectly. Whatagraph has the capacity to combine content marketing data from channels such as Social platforms, Google Analytics, Mailchimp, Hubspot, Excel, Google Sheets, CSV and so much more so that all of your data is in one place. Whatagraph allows you to brand your own reports, filter campaigns, include offline information, the list goes on. It gives your key stakeholders a much better overview of content marketing metrics and makes your job that much easier.
Published on Jan 27 2020
WRITTEN BY
Krystyna Krajevskaja
Krystyna believes optimizing the way you report data is the key to a good marketing strategy. A seasoned social media manager with experience in B2B companies, she loves to identify and share new business opportunities.


 Google Analytics is a great tool for this. It can be all too easy to focus on acquiring new visitors, sure, this is an important metric too, but how can you tell if your content is valued? Returning visitors. If someone is returning it can mean one of two things, largely depending on the page they are visiting.
 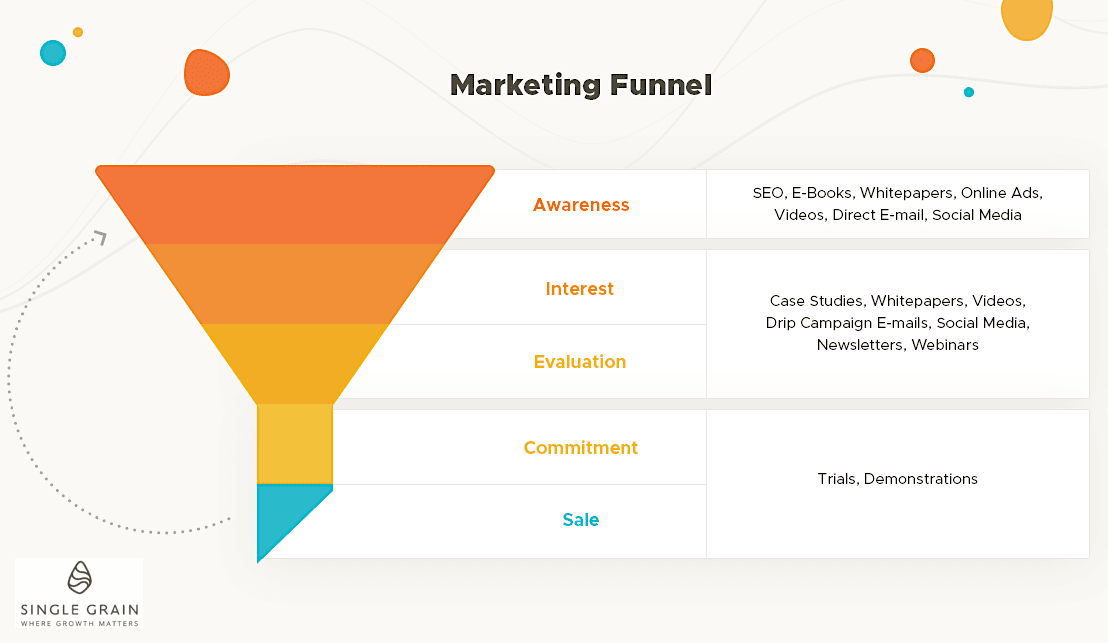 Your content will be supporting the
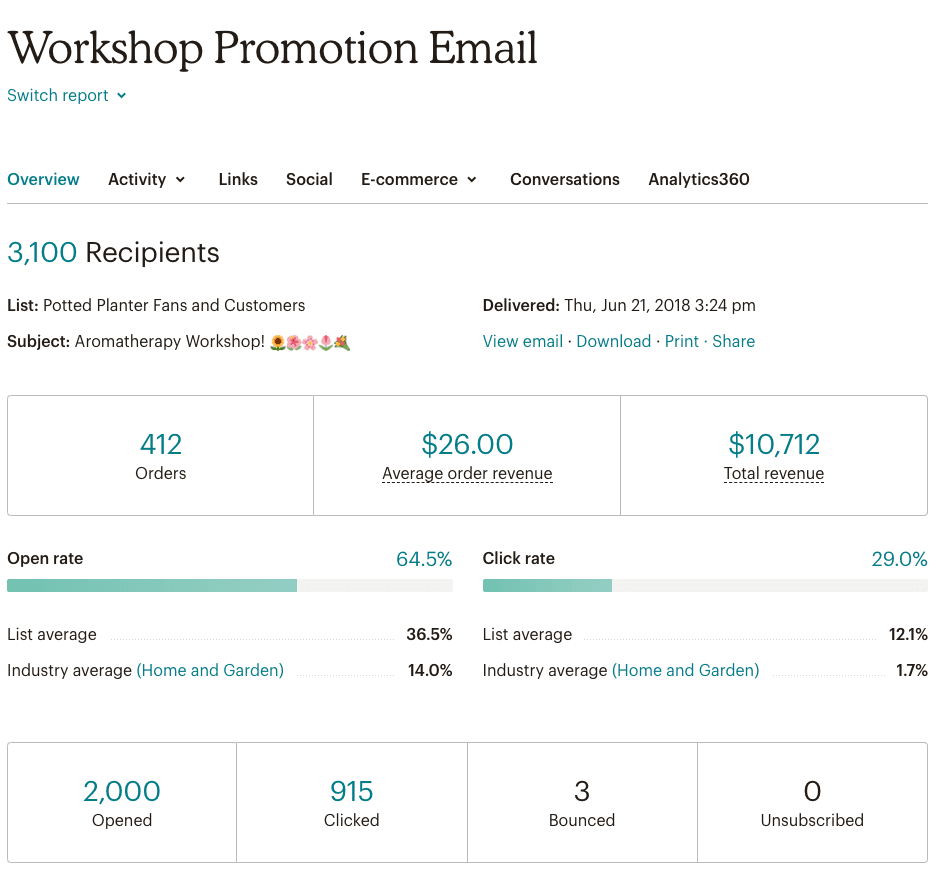
 Two very similar features, so similar that they sit right next to each other in Google Analytics. Yet these two metrics can tell you very different things. What’s the difference?