ETL Data Transformation Process: The Step-By-Step Guide
In today’s fast-paced information age, businesses can’t afford to make poor decisions based on unreliable data. Aggregating and structuring data coming from different sources has become a much less laborious job thanks to the ETL data transformation process.
Today, we’ll tell you all you need to know about ETL — what it contains, what types of data transformation exist, and how to choose the right data transformation tool.
Choose the right data transformation type in 3 steps
Let’s get that data prepared
What is the ETL data transformation process?
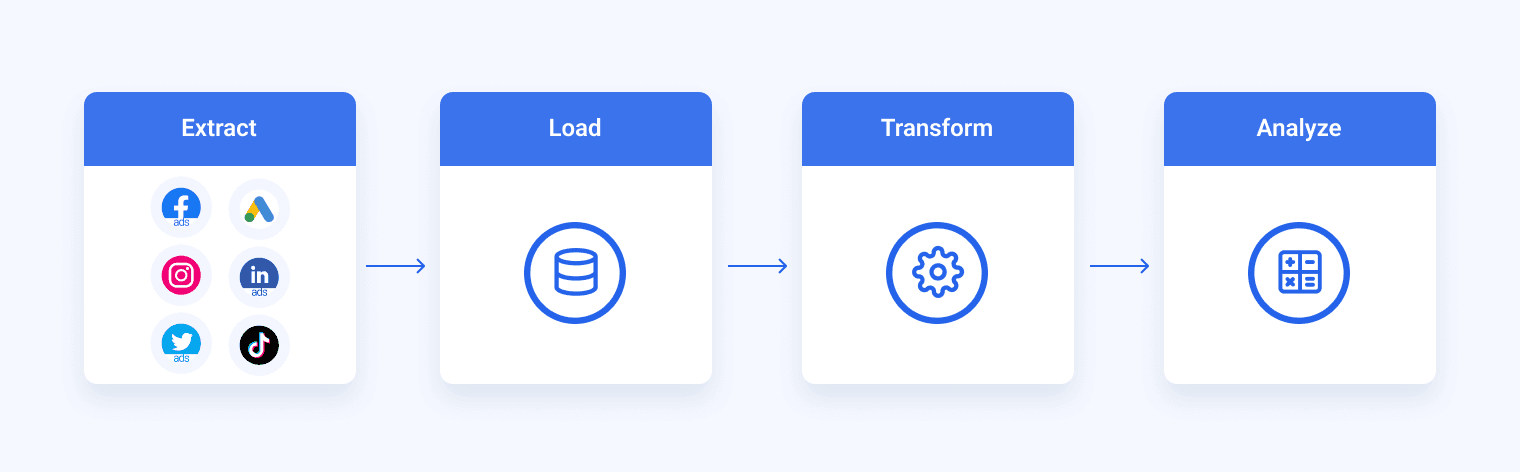
The data transformation process is part of an ETL process (extract, transform, load) that prepares data for analysis. This includes cleaning the data, such as removing duplicates, filling in NULL values, and reshaping and computing new dimensions and metrics.
In a typical ETL workflow, data transformation is the stage that follows data extraction — a process where raw data is extracted from various data sources to the staging area.
After data is transformed, it is loaded into its data store. This can be a target database, data warehouse, data lake, or even multiple destinations.
Cleaned data is often loaded into business intelligence (BI) tools for visualization and analysis by users who don’t need any tech skills.
The transformed data can also be used as a source for machine learning workflows or other data analytics uses.
When designing Whatagraph, we wanted to achieve two things:
Offer a hassle data transfer service
Provide effortless reporting on stored data
We simplified both processes to the point-and-click level so anyone can complete them.
If you’re looking for an easy-to-use solution to connect data from various marketing sources, keep your marketing data safe, or want to visualize your BigQuery data, book a demo call and find out how Whatagraph can help.
But first, let’s explain how the ETL process works.
Extraction
Before data can be moved to a new destination, it must be extracted from various sources and data analysis tools. In the first step of the ETL process, structured and unstructured data is consolidated into a single data repository. Data sets can be extracted from a range of sources, including the following:
Existing databases and legacy systems
Cloud, on-premises, and hybrid environments
Sales and marketing apps
Mobile apps
CRM systems
Relational databases
This stage was traditionally performed manually by data engineers and was time-intensive and prone to errors. ETL tools now automate the entire process, giving way to more reliable data management.
Transformation
In this stage of the ETL process, data is subjected to a matrix of rules and regulations that ensure data quality and accessibility. The data transformation process consists of several sub-processes like cleansing and deduplication, which we’ll cover in more detail below.
Transformation is probably the most important part of the ETL process. It improves data integrity, removes duplicates, and standardizes the data so it arrives at its new destination fully compatible and ready to use.
Loading
The final step in the ETL process is to load the newly transformed data into a new destination, for example, a cloud-based data warehouse like Google BigQuery, Snowflake, or Amazon Redshift.
Data can be loaded to a data warehouse at once — full load or at scheduled intervals incremental load.
You can make the load process smoother and more efficient by using a data pipeline. In these systems, different datasets can be extracted, transformed, and loaded at the same time.
For example, an incoming data set is transformed, and during that time, new data is extracted. As the transformed data is loaded into the data warehouse, the extracted data is transformed in real-time.
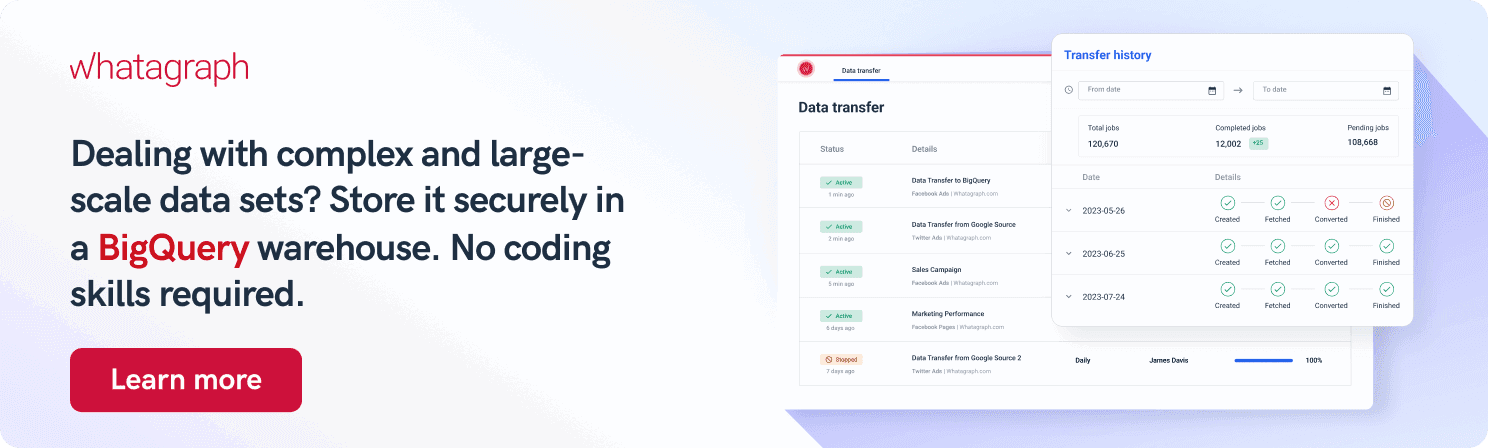
Whatagraph is an automated data pipeline that helps business users load data from multiple marketing data sources to BigQuery.
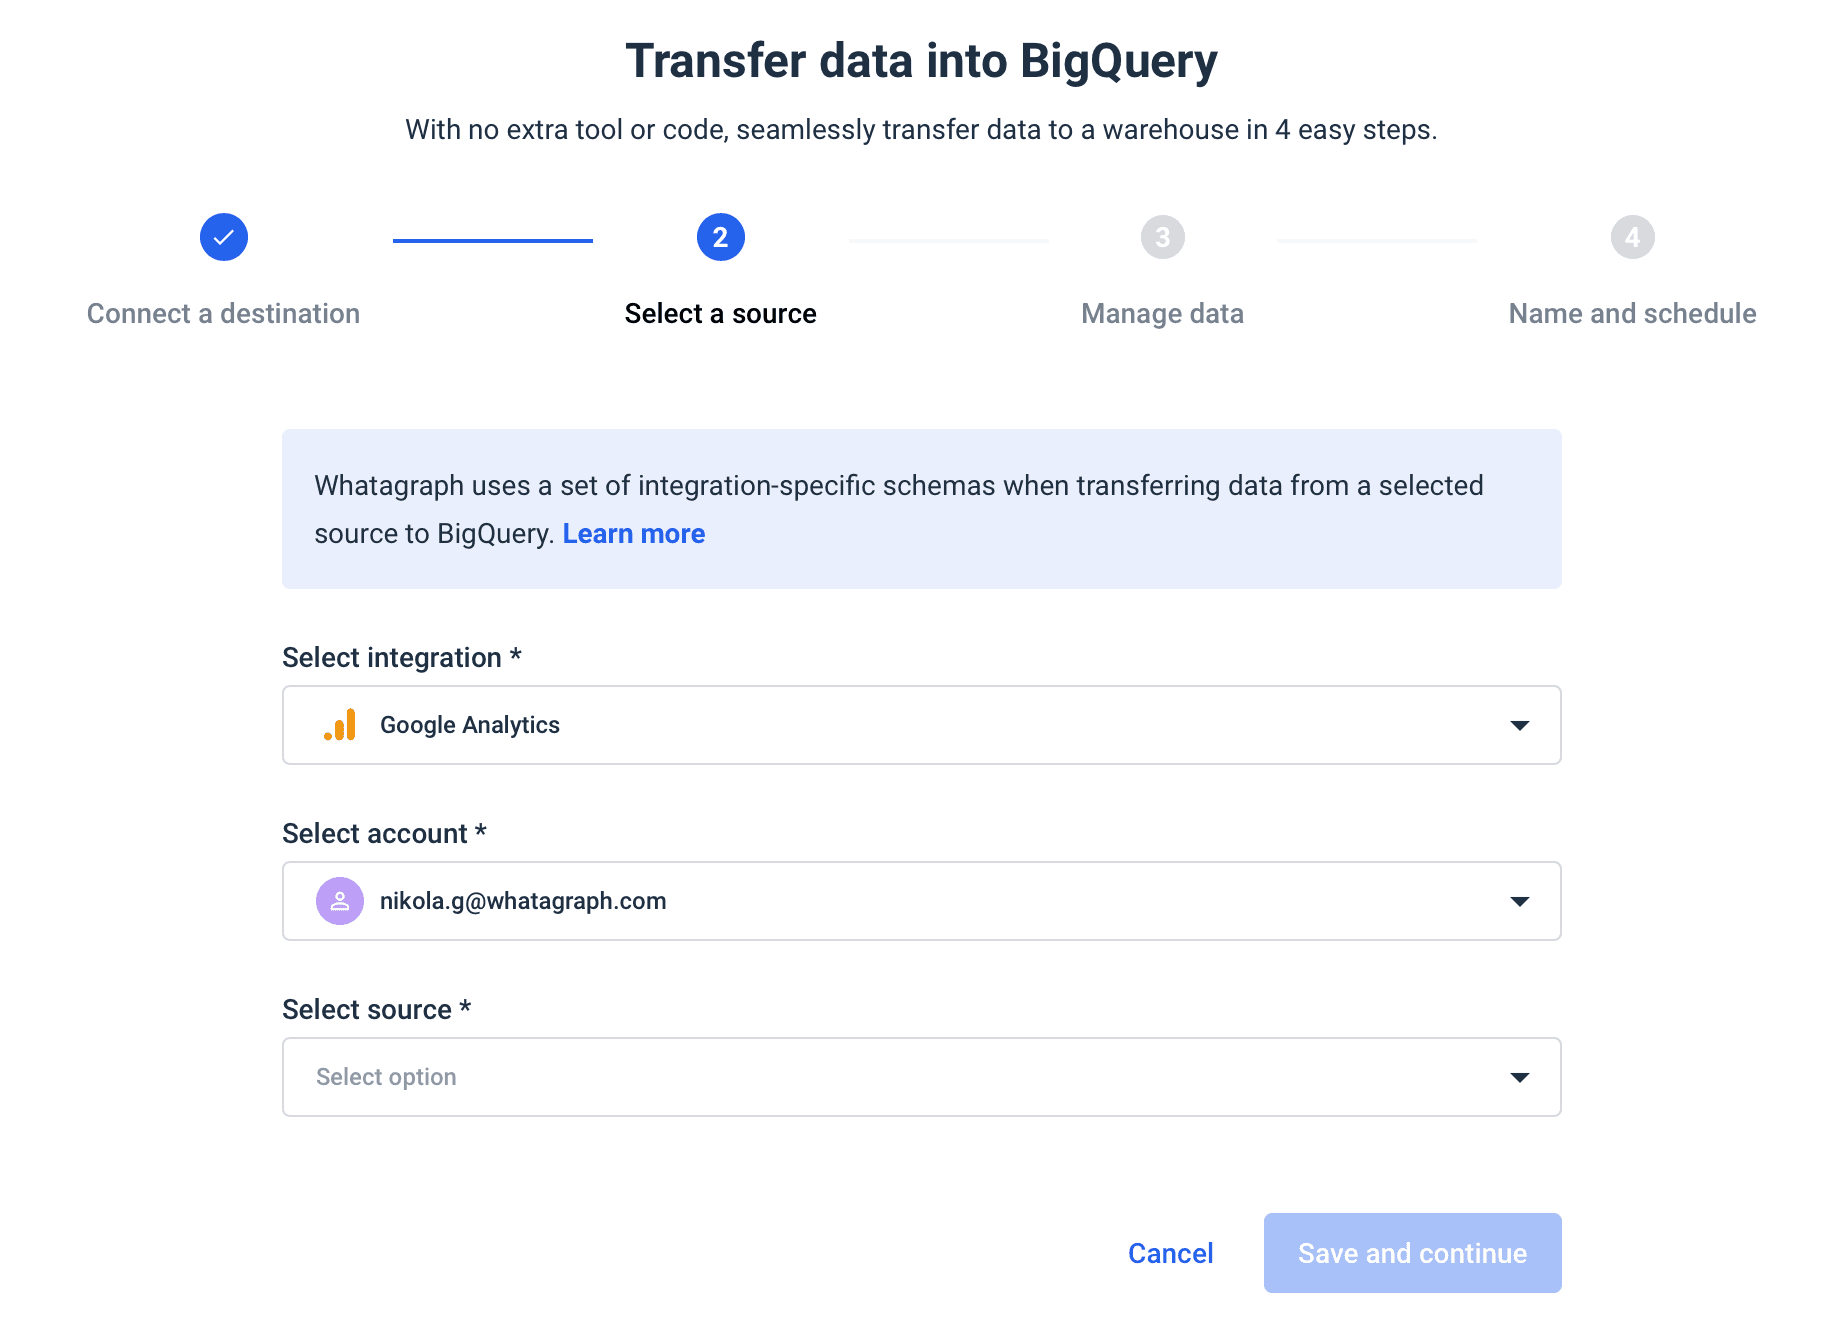
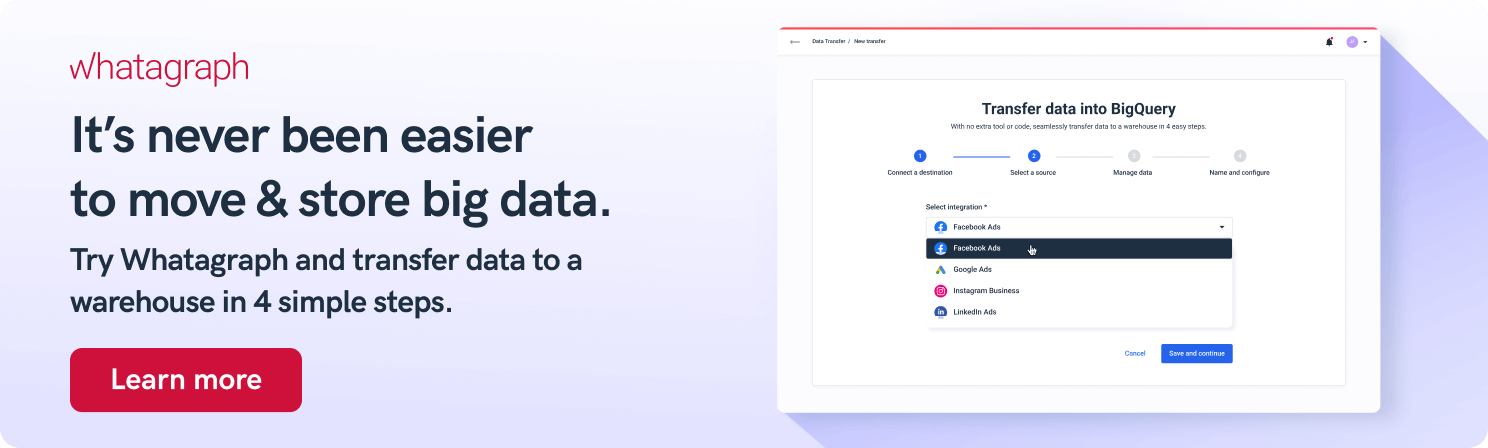
Our data transfer service eliminates much of the manual work, allowing you to complete the data transfer in just four steps:
Connect the destination
Choose the integration
Set the schema
Schedule the transfer
In the last stage, you can also set the schedule — when and how often you want your data to move to BigQuery.
Whatagraph is a tool that grows with your business needs.
For the moment, you might be content with insights you draw from your Instagram business account or Twitter Ads, but when you need more connectors, Whatagraph scales up to deliver.
When you need a report on your BigQuery data, Whatagraph helps you create drag-and-drop dashboards that you can fully customize with different graphs, tables, and color schemes.
ETL vs. ELT
As we’ve just seen ETL tools extract and transform large volumes of data from different sources before loading it into a data warehouse.
However, with the advent of powerful cloud data warehouses, there’s less need for data cleanup before loading it.
The cloud has enabled an ETL architecture that has two steps different from the ETL pipeline.
Extract: Extract data from multiple sources and connectors.
Load: Load data into the data warehouse.
Transform: Transform it using the power and scalability of the target cloud platform as needed.
In ELT pipelines, raw data is extracted from the source system and loaded into the warehouse. Data loading takes place before transformation, which speeds up the process.
However, both architectures have their advantages and disadvantages, but generally:
ETL is better suited for smaller data pipelines when you need structured data that is suitable for analysis and visualization.
ELT is better suited for big data operations where data scientists need to access raw data and prepare it for further assessment.
10 common types of data transformation
There are many ways to cleanse source data before you can load it into a data warehouse. These are the ones most commonly used.
1. Data filtering: The simplest of all transformations. This process filters rows and columns before saving or inserting data into the data storage.
2. Data mapping: Another common type of data transformation that takes one data input and changes it to its equivalent in a unified format. It can unify capitalizations, convert strings to the same encoding standards, sync date, and time values, etc.
3. Data deduplication: Deduplication is a data processing step that removes duplicate data before inserting it into the data warehouse.
4. Derived variables: Derived variables compute attributes from other data points and variables. For example, a column may compute entries from other rows and columns.
5. Data sorting: Before loading data, you can sort it by date or other criteria, so it’s easier to find via search.
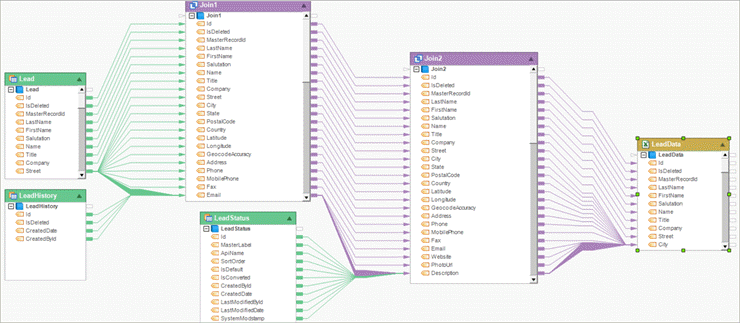
6. Data joining: This step merges related data elements that are collected from multiple data sources. For example, you can join spend data from Facebook Ads, Google Ads, and LinkedIn Ads into a single table. Whatagraph allows you to instantly pull data from most popular marketing data sources using pre-built connectors.
7. Data aggregating: Aggregation picks a relevant dimension and groups metrics across that dimension. For example, it can compute the total number of new customers (group metrics) on each date (dimension).
8. Data splitting: When working with unstructured and semi-structured target data like strings, JSON, XML, or flat files, you need to split the data before saving it into a table. For example, when you get a customer address in the form of a string, before you save it into the customer table, you split it into columns for the street, city, zip code, etc.
9. Data validation: They can be either simple or complex. For example, if the first three columns in a row are empty, you can reject the row from processing.
10. Data integration: This step gives each unique data element one standard name with a standard definition. Integrating data from different systems allow teams to access and use it.
Choose the right data transformation type in 3 steps
The choice of transformation type depends on your business rules and needs.
Here are three steps to get you on the right track:
1. Identify the target tables schema
Get a list of tables and their schemas (columns, possible values, etc) of how the data would ideally look once it’s cleaned and loaded into the data warehouse.
2. Record the gap between target and incoming data
Compare and contrast the ideal target state with the raw data you collected in the extraction step. Try to spot out what transformation types you’d need to convert the raw data into the structured data.
3. Implement the changes
Validate the transformations before putting them on autopilot with your ETL tool of choice.
Let’s get that data prepared
The ETL process is an essential part of data warehousing, and the “T” for “transformation” in its name is by all means the most important step.
But with huge amounts of data pouring in from all sides, you need a tool that will load this data to a data warehouse quickly and effortlessly.
But why stop there? Why not automate the whole process?
Whatagraph allows you to set up data transfers to BigQuery in just three steps and then schedule the task so you can write it off your list.
Published on Feb 14 2023
WRITTEN BY
Nikola Gemes
Nikola is a content marketer at Whatagraph with extensive writing experience in SaaS and tech niches. With a background in content management apps and composable architectures, it's his job to educate readers about the latest developments in the world of marketing data, data warehousing, headless architectures, and federated content platforms.