But first, let's go over some GDS basics.
What is Looker Studio?
In a nutshell, Looker Studio is a free tool that assists marketing agencies by transforming data into simple, informative, and customizable reports they can send to clients.
Looker Studio is a cloud platform offered by Google, along with Google Analytics, Google ads, Excel, Google Sheets and BigQuery. It is a cloud-based data reporting BI tool that enables marketers to convert massive amounts of complex data from needed data sources and apps into visually customized reports and dashboards.
Source.
The Looker Studio business intelligence tool provides real-time dashboards with automated data updates and support for data blending.
Note: In October 2022, Google rebranded this product and it is now called Looker Studio. Everything remains the same, for now. In the upcoming months, they plan to release Looker Studio Pro, a paid version of the app for enterprise customers.
The Looker Studio Connectors - The Good and Bad
Do you know the main reason why marketing agencies use Looker Studio? Their official website states that they provide access to clients' data from 800+ data sets from more than 620 connectors. Keep in mind that around 600 of them are paid, and what's left - is free.
Looker Studio Connectors - The Good
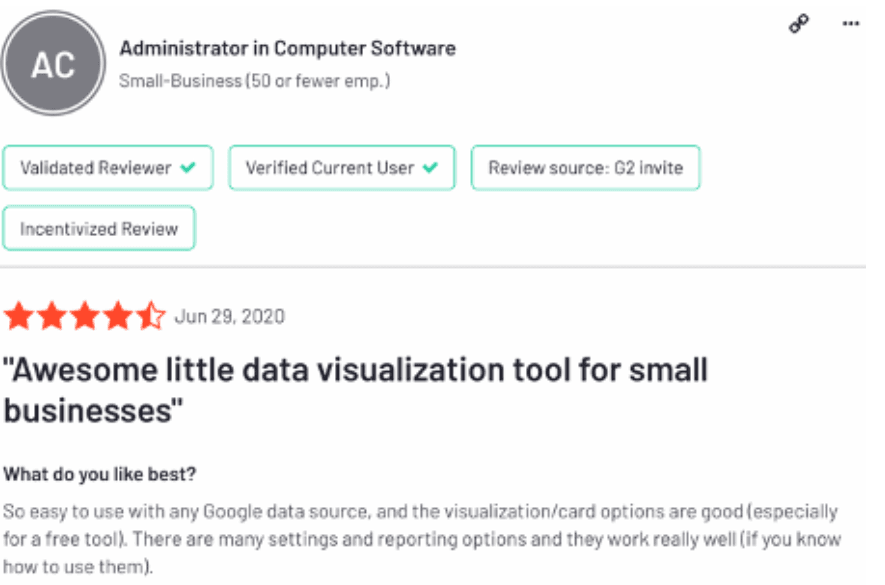
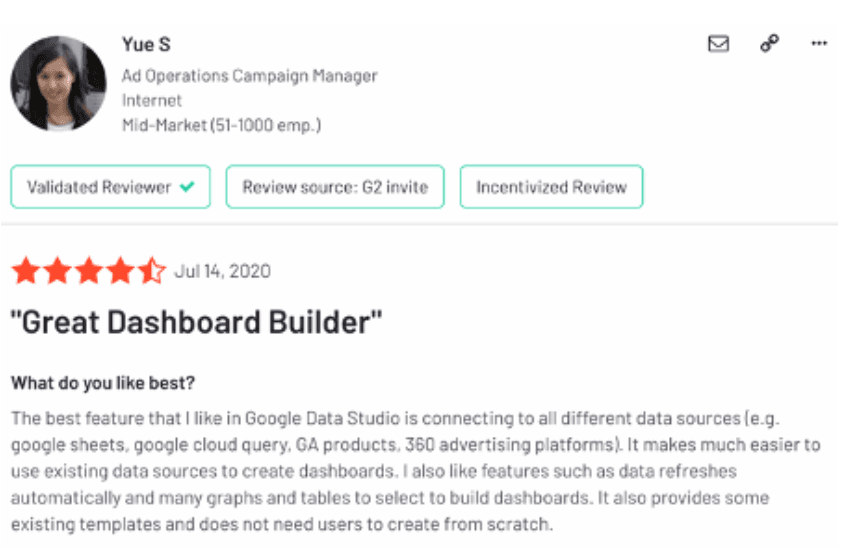
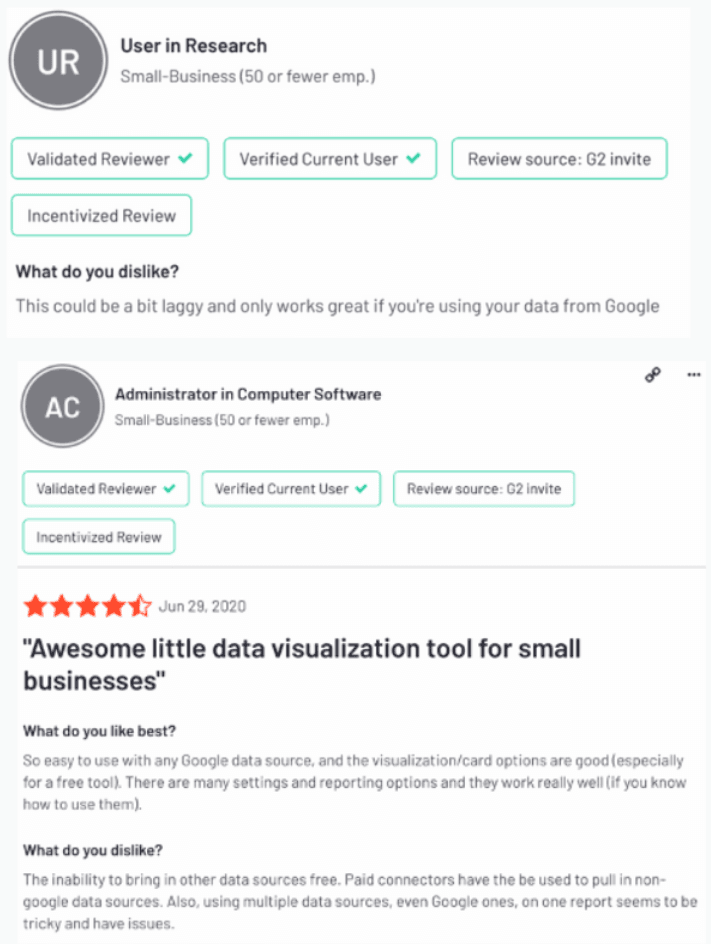
One of the most significant advantages of Looker Studio connectors is that they integrate seamlessly with other Google products. We read Looker Studio reviews on G2 and discovered that marketers who use this tool appreciate how fast, accurate, and simple reporting is with any Google data sources.
Second, because it runs off the cloud, it needs no maintenance hassles.
Lastly, as of 2022, it has more than 630 connectors built by Data Studio Partners. The majority of those connections are content, marketing, and media related. Some of those many data sources are SEMRush, Supermetrics, Shopify, Facebook ads, etc. This feature helps digital marketing agencies easily leverage and oversee multiple platforms' performance and ad campaigns.
Looker Studio Connector - The Bad
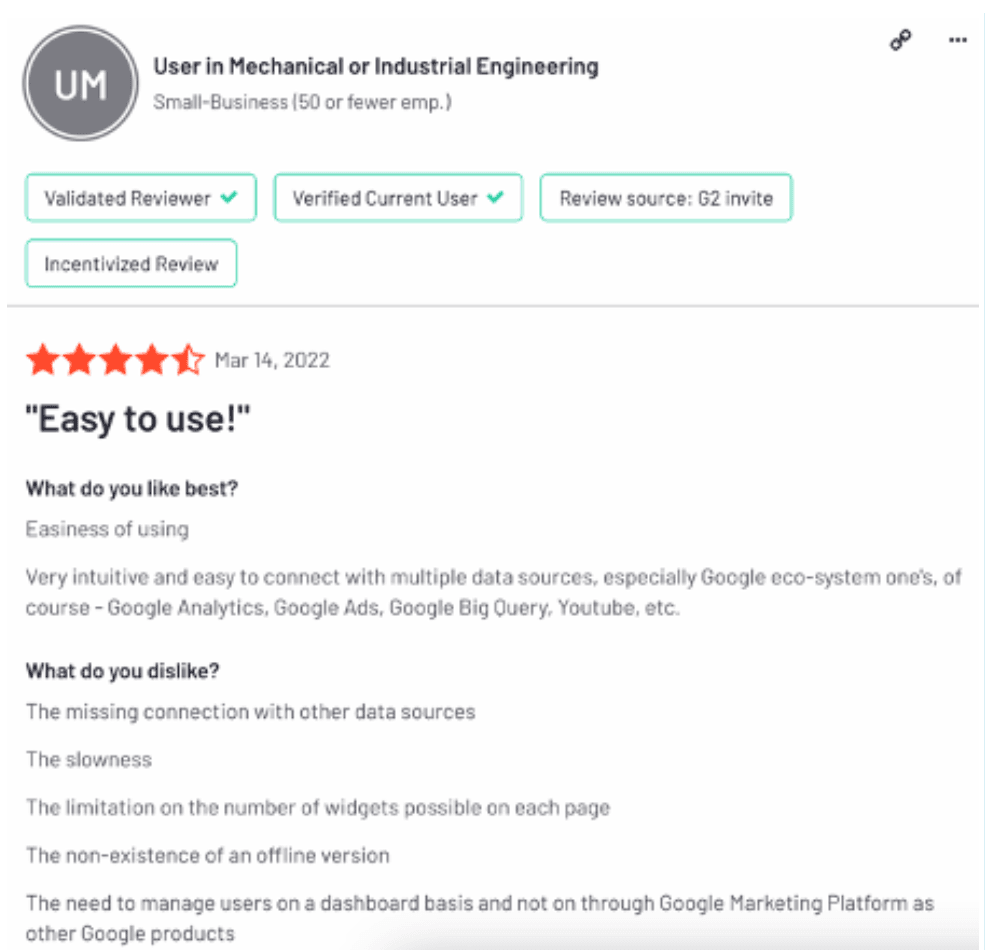
First, you need to be connected to the internet just to work in Looker Studio. You must be online to create a report, and there is no option to work offline.
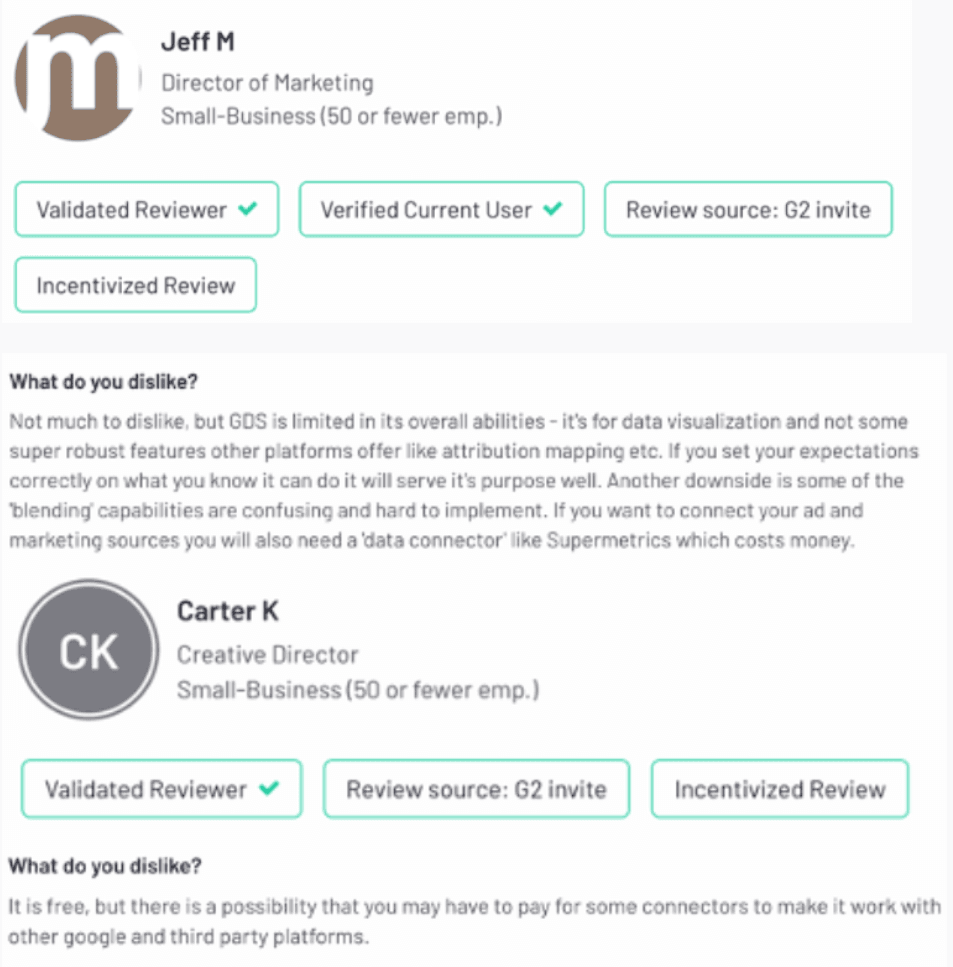
Furthermore, you must pay for most connectors, which can be expensive. For example, although Google My Business is a Google product, it is not natively available to Looker Studio. You'd have to pay for a connector to get data from GMB or other cloud-based data sources like HubSpot. This feature may not be an option for a busy marketing agency because it would necessitate additional resources - money and time.
Some examples of the paid connectors pricing:
- Supermetrics for Data Studio start at $39 per month;
- Porter would charge you $15 per month;
- Reporting Ninja would cost you $20 per month.
 Finally, Looker Studio does not integrate well with third-party platforms. We found numerous complaints about loading issues when pulling data from multiple platforms or from non-Google tools. Some Looker Studio users experience significant lag, errors, and bugs.
This may not be ideal when creating a report quickly, nor would it be preferable when creating a cross-channel report.
While Looker Studio has a lot of connectors, the quality isn't great and can be expensive if many paid connectors are used (for example, AgencyaAnalytics costs $15 per month; Zapier costs around $20 per month and HubSpot $41 per month).
These extra investments should be considered if a client-agency relationship is one of the priorities. Client reporting may require different connectors depending on their specific requirements. If you don't want to pay for certain connectors, or if it takes ages to pull data from them, you might lose credibility with your clients.
While Data Studio is undeniably powerful regarding the Google Suite, it falls behind with third-party tools. And let's face it, your agency probably uses more than Google Analytics and Google Search Console for your client work.
On the other hand, Whatagraph supports 40+ marketing integrations and data sources. There are no lagging issues, and all 40+ integrations are included in all plans. Sure, Whatagraph is a paid tool, but you know that you get 40+ sources with one subscription, which is effectively cheaper than Looker Studio, which claims to be free.
Looker Studio Visualization
Now let's talk about one of the main reasons why marketing agencies use reporting tools - data visualization.
When it comes to Looker Studio's visualization, there are a few things to know:
1. You can only add 20 conditional formatting rules to a chart. 'This may sound like a lot, but considering that you can only apply your conditional formatting to one metric at a time, I have hit the limit several times and had to rework my original vision for a chart design'.
2. You can only have 50 charts or boxes on a single page. This means you can't use more widgets if you have already applied too many elements to a report.
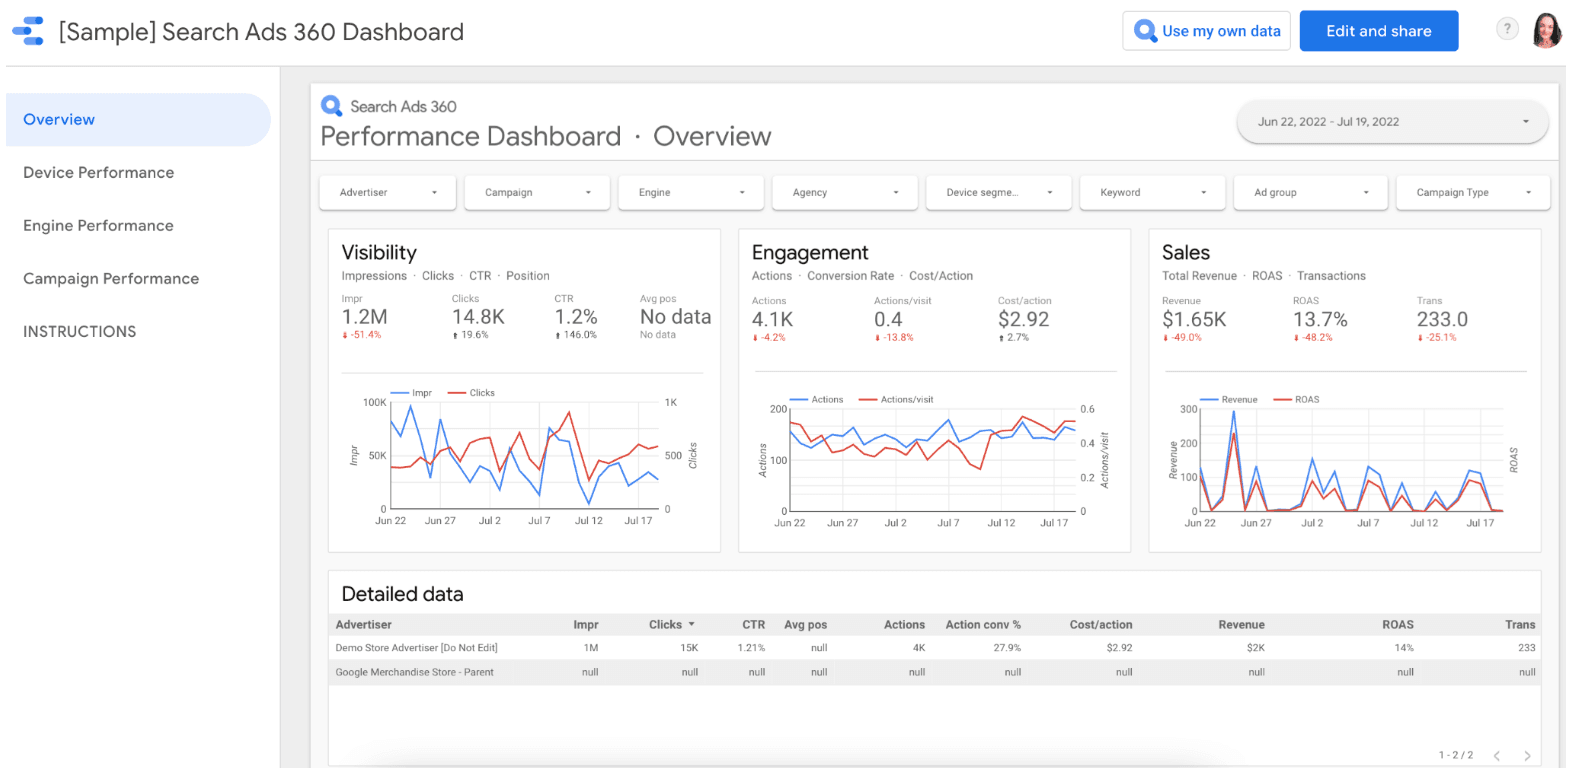
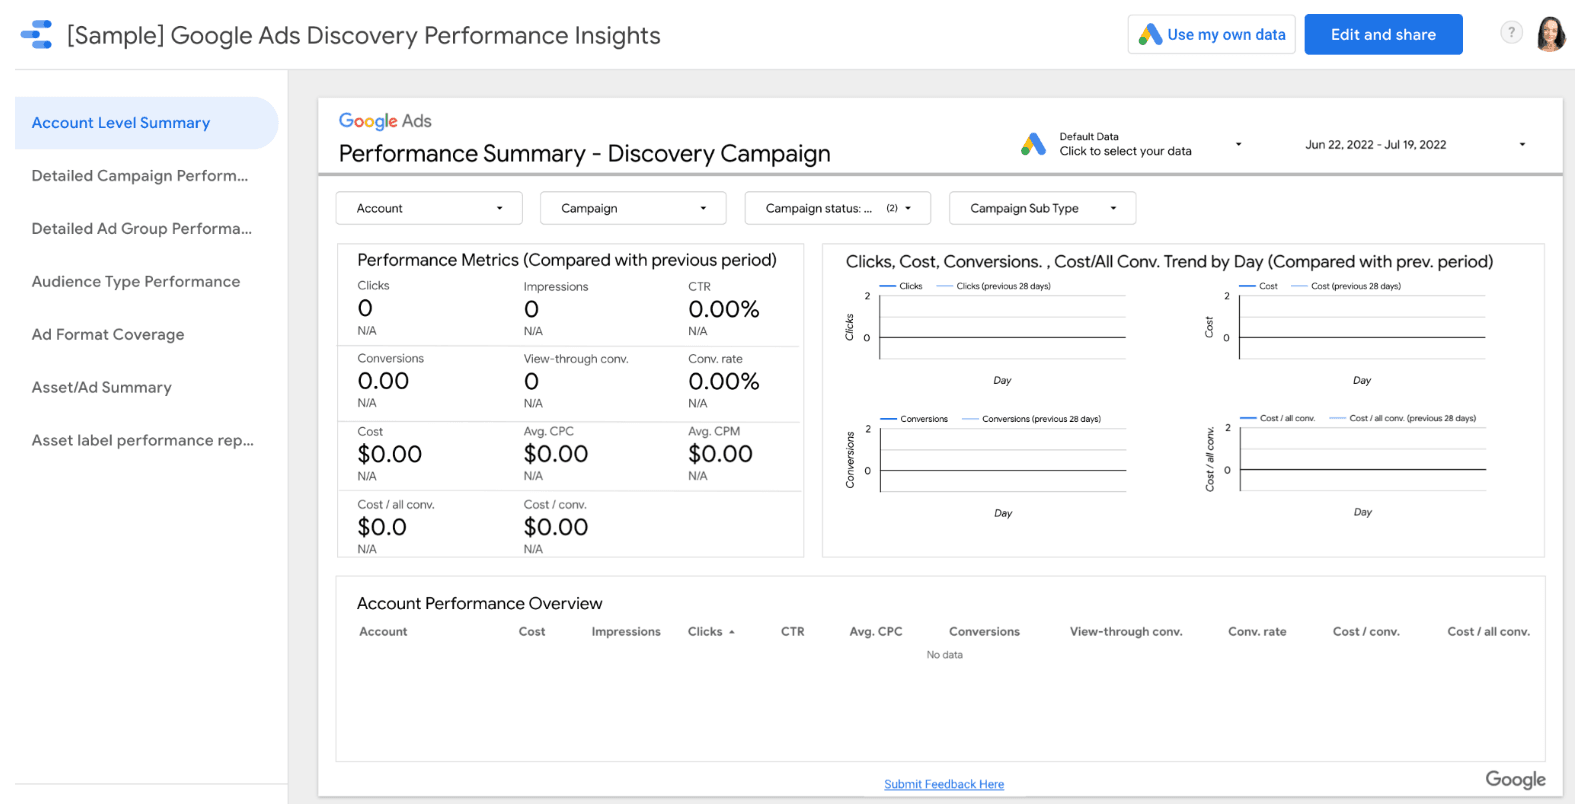
3. It is easy to create a report but tricky to understand. Sometimes it takes time for a customer to understand what the report is telling and your progress.
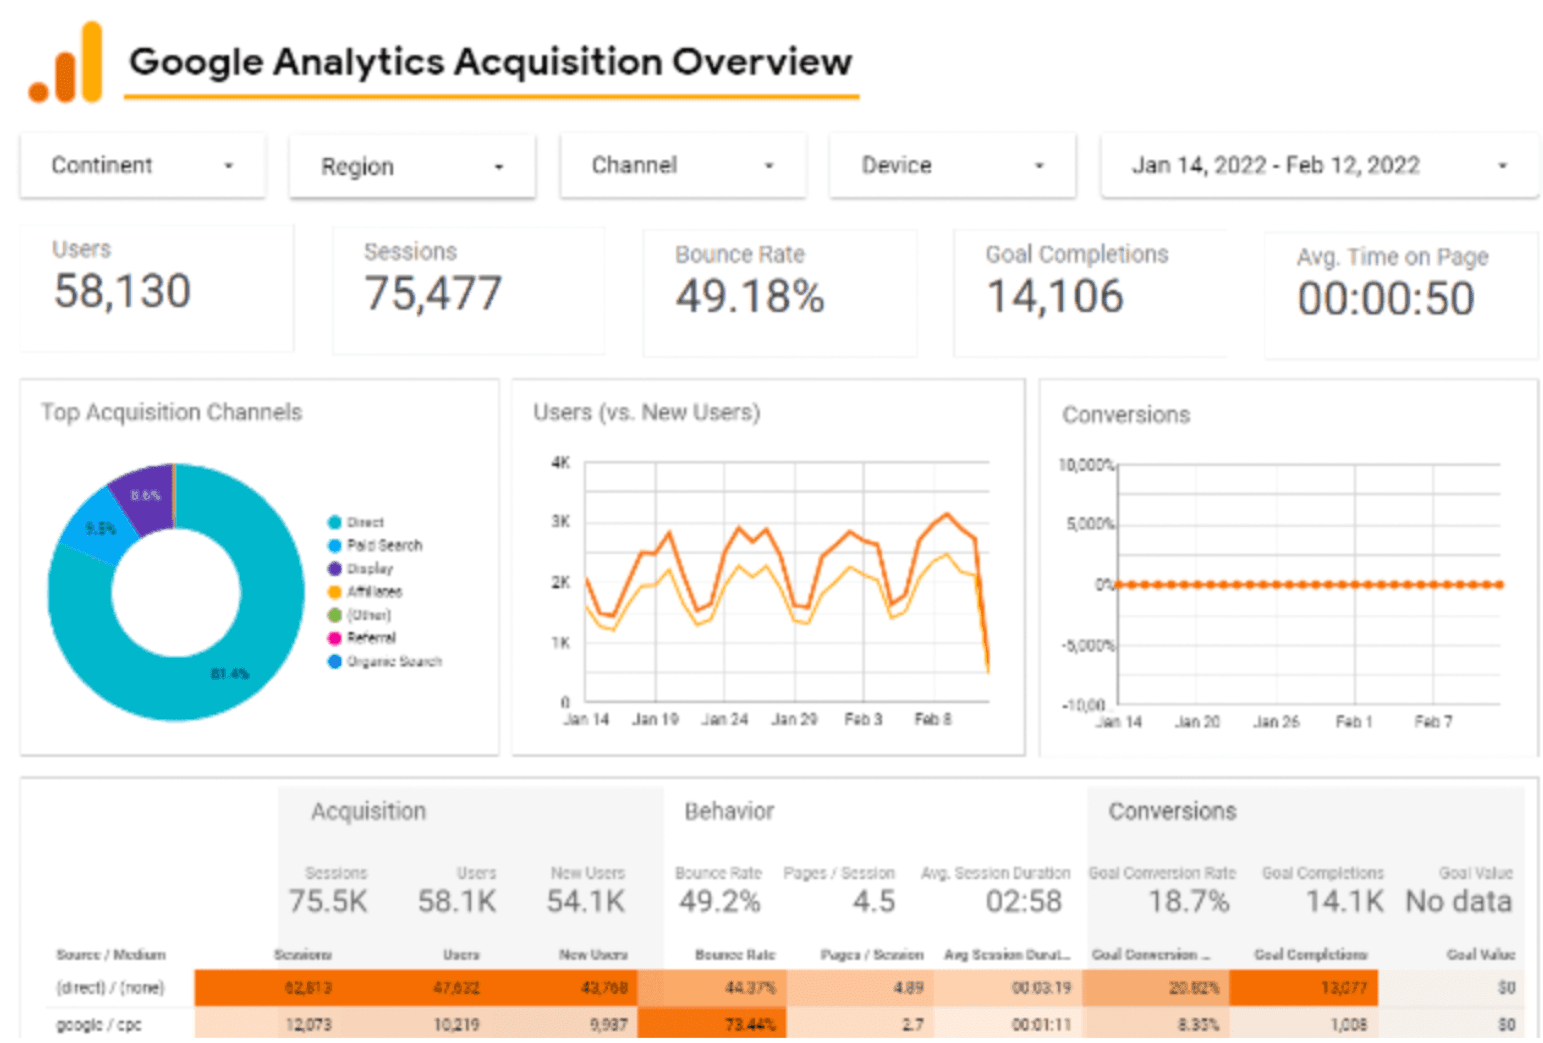
The screenshot was taken from here.
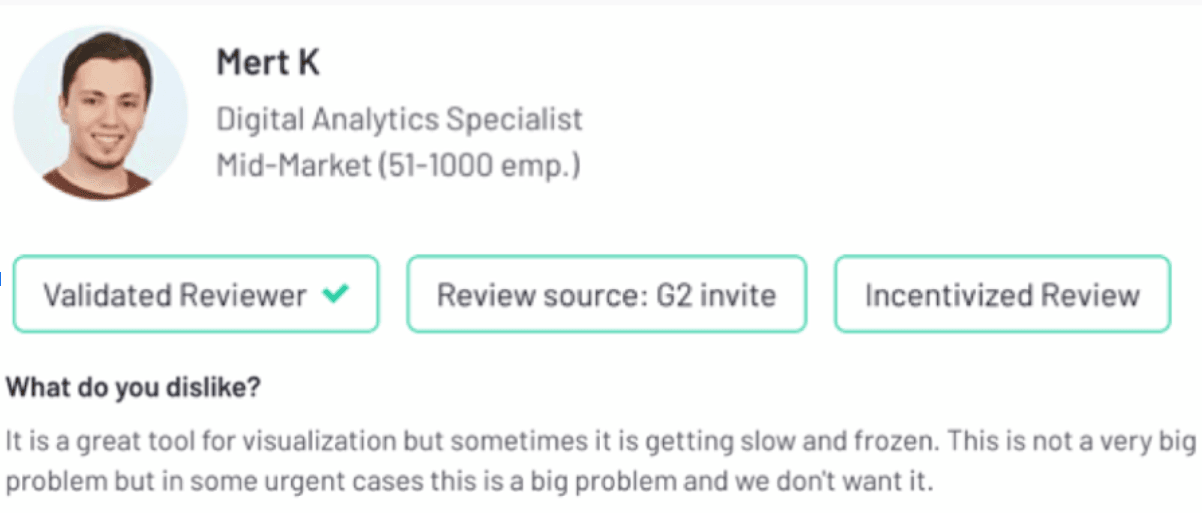
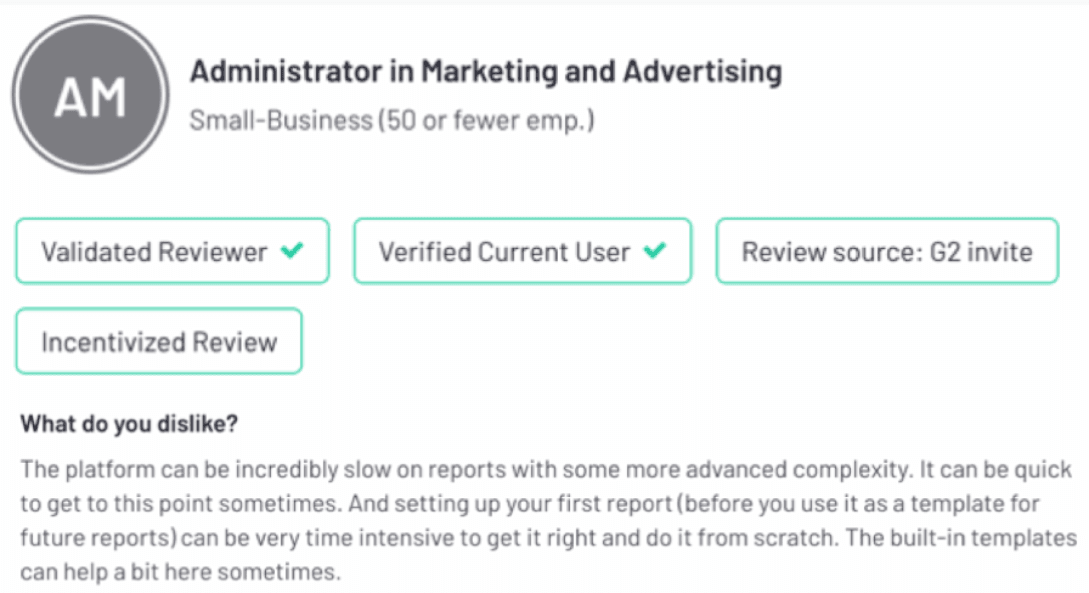
4. Depending on the visualization you need, you may find creating a report easy or challenging. It all comes down to one thing - whether you need an advanced or a simple report. According to the reviews, developing a report with simple graphics is pretty easy. However, when it comes to advanced visualizations - it gets tricky. Moreover, when using those advanced visualizations, reports seem to have loading speed issues.
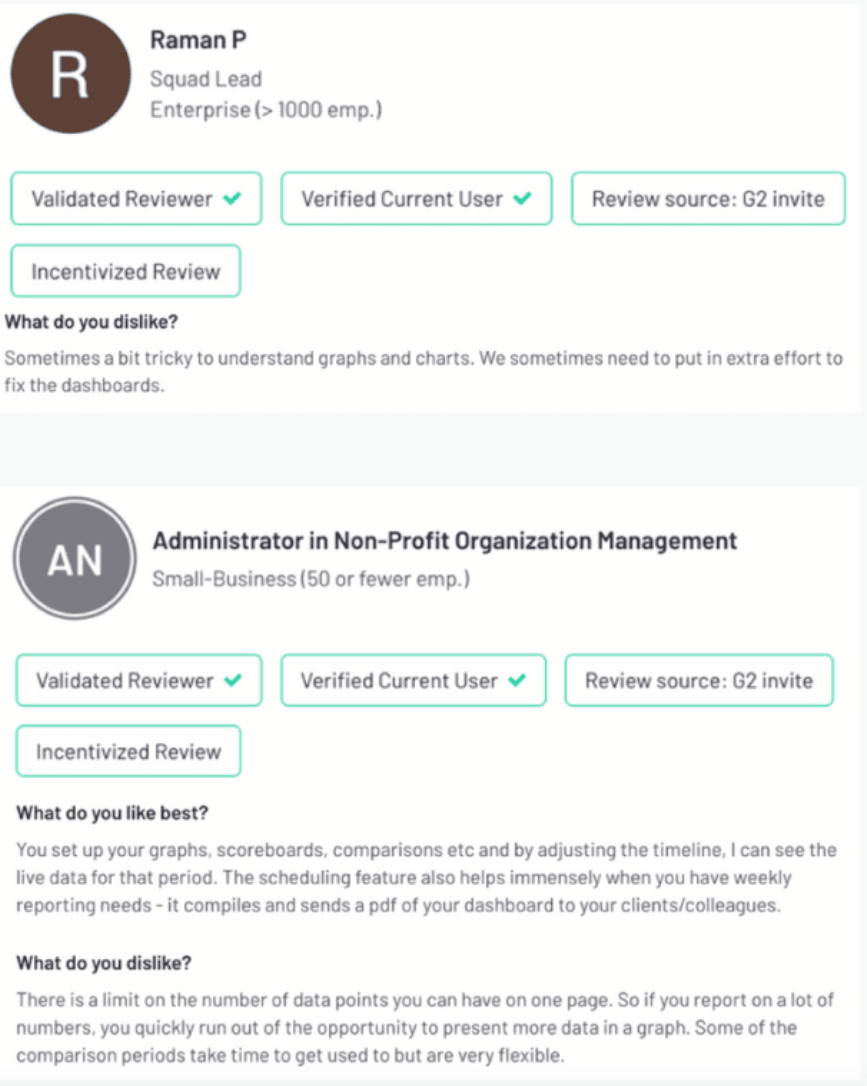
See the review below:
5. 'There is a limit on the number of data points you can have on one Looker Studio dashboard or report. So if you report on many numbers, you quickly run out of the opportunity to present more data in a graph. Some comparison periods take time to get used to but are very flexible'.
This means that an agency would have difficulty properly and efficiently monitoring, tracking and measuring their performance. More importantly, because the number of data points is limited, client reporting can become even more challenging.
6. Lastly, you can use 12 widgets per dashboard in a report. This can be too little if you want to create a cross-channel report for your clients.
On the positive side, Looker Studio allows you to customize things like logos, icons and notes. The notes widget on GDS is especially useful when explaining graphs and numbers to a client. They also have a few fonts available, but that's about it.
 Source.
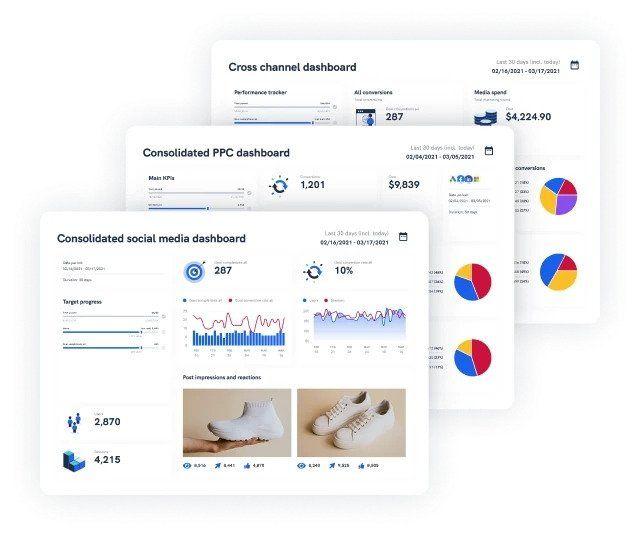
But what if you want fully customizable data visualizations?
Whatagraph is a popular Looker Studio alternative that provides automated, visually-engaging KPI reports for all your digital marketing channels. Unlike Data Studio, Whatagraph pushes the limits of report customization.
We give you full control of how your reports should look, from branded colours to custom report domains, individual templates, custom date ranges, comment boxes, widgets, and more. Connect all your social media, PPC, and email marketing channels and easily build dedicated or cross-channel reports your clients will actually read.
We almost forgot to mention! Not only can you customize everything, but you can also create new report elements within Whatagraph. Need new widgets and templates? No problem. In a couple of steps, create custom elements and use them in the future for other reports or dashboards.
Looker Studio Reports & Dashboards
Looker Studio is a powerful reporting solution. No one can deny that. However, there are a couple of things to consider (that other GDS users complain about) when creating reports with GDS.
We've noticed a trend in G2 reviews: people experience long rendering and pulling data times. This especially can happen if 2-3 people are working on the same report.
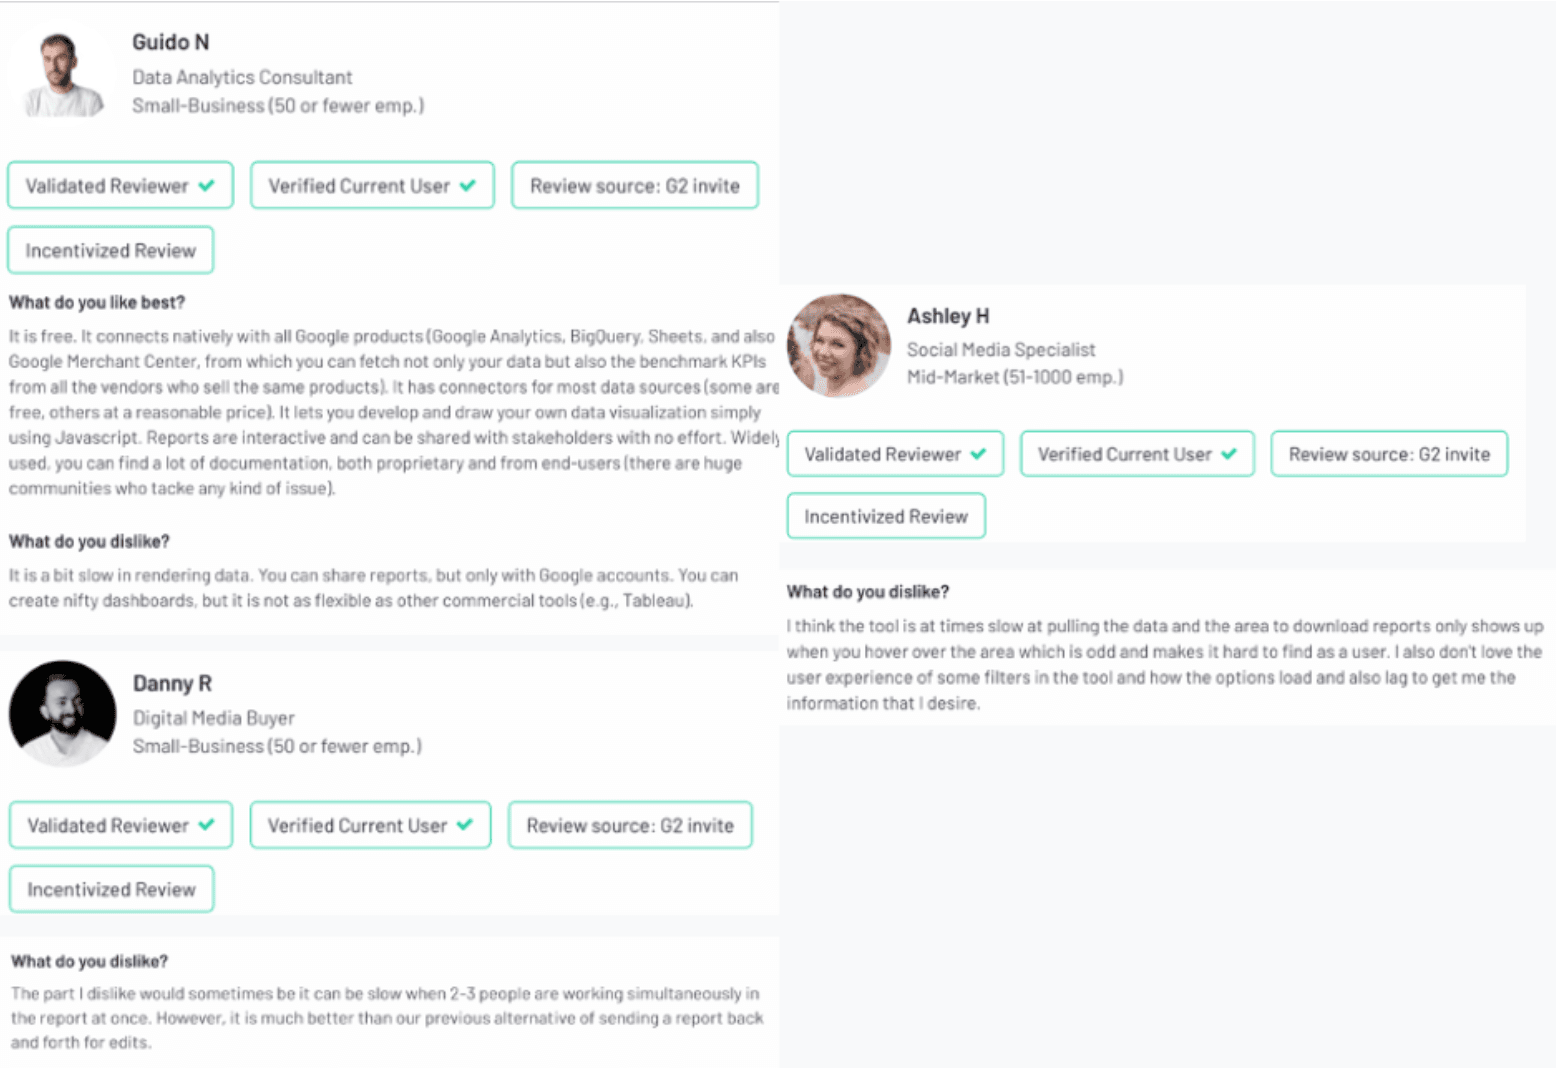 Second, when starting to create Looker Studio reports, first-time users find it overwhelming and complex to use. It takes a long time to understand how Looker Studio works, some people need to watch multiple tutorial videos and some feel like they are 'scratching the surface of everything this tool can do'.
This powerful tool requires a bit of data analytics knowledge, without a doubt. However, it is doable and spending weeks learning how to 'properly' use the tool is worth it for some.
On the other hand, if one person in the marketing team wants to get comfortable and familiar with Looker Studio, it can get difficult to train them. And unfortunately, there is no beginner's guide available for these cases. 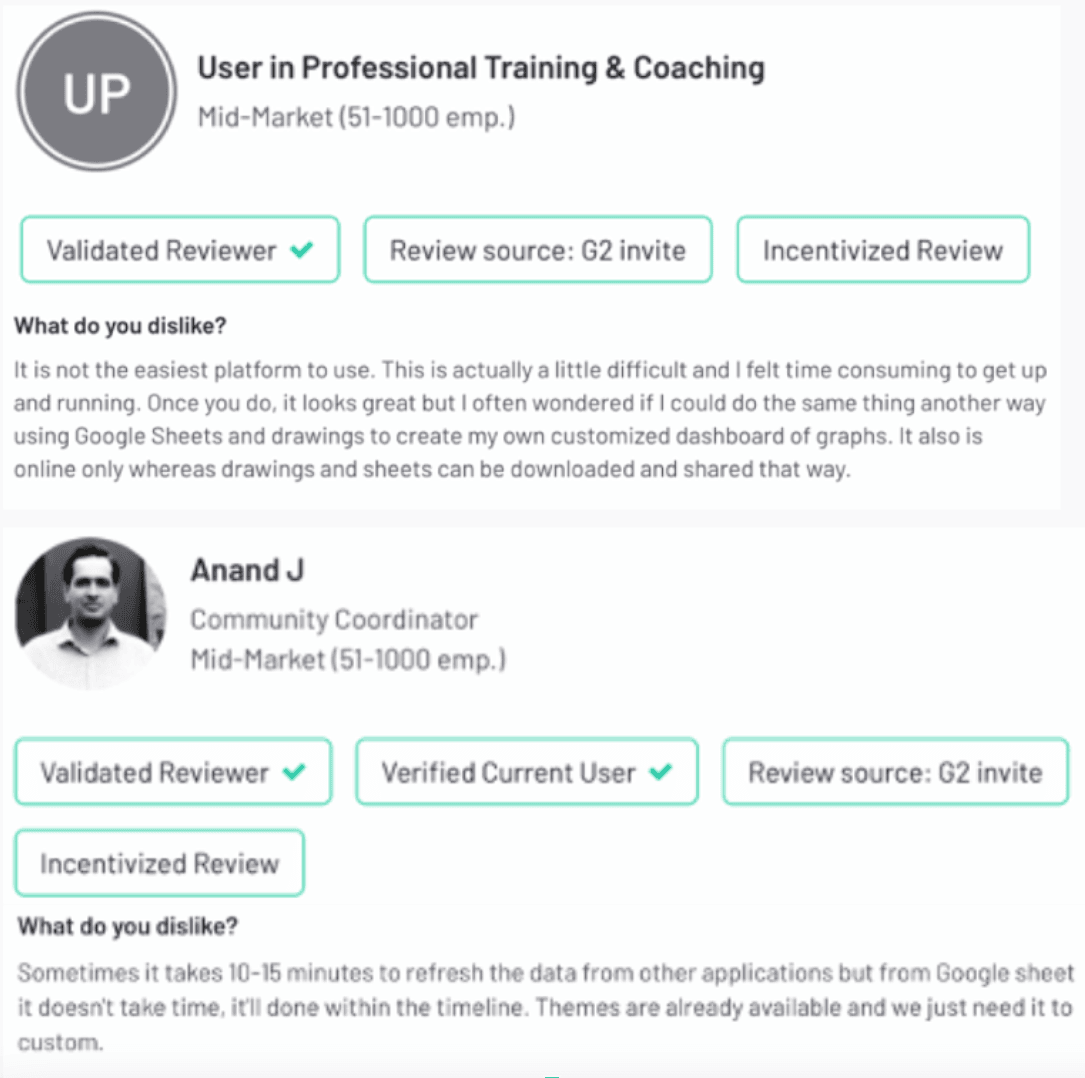
How Whatagraph is different
For beginners, we provide customer onboarding and support for at least half an hour. We walk you through the whole process of creating a report and adding accounts and platforms. AND we give you the best practices of how you should approach reporting in general!
Whatagraph also provides another solution - a help centre. It has walkthroughs, use cases, tips & tricks, and everything you may need to start reporting. BUT, we notice that people aren't usually using them because of how easy and simple it is to create a dashboard or a report with us.
We've got a huge pre-made templates gallery to help you start and give you inspiration on how your report could look like.
The user-friendly interface directly pulls data from the most popular and commonly used data sources without errors. We've even got a 1-minute Smart Builder feature - a 2-step process where we've taken the most popular marketing channels and the most sought-after metrics. All you have to do is pick and choose which ones you need, and you'll get your report generated FOR YOU. 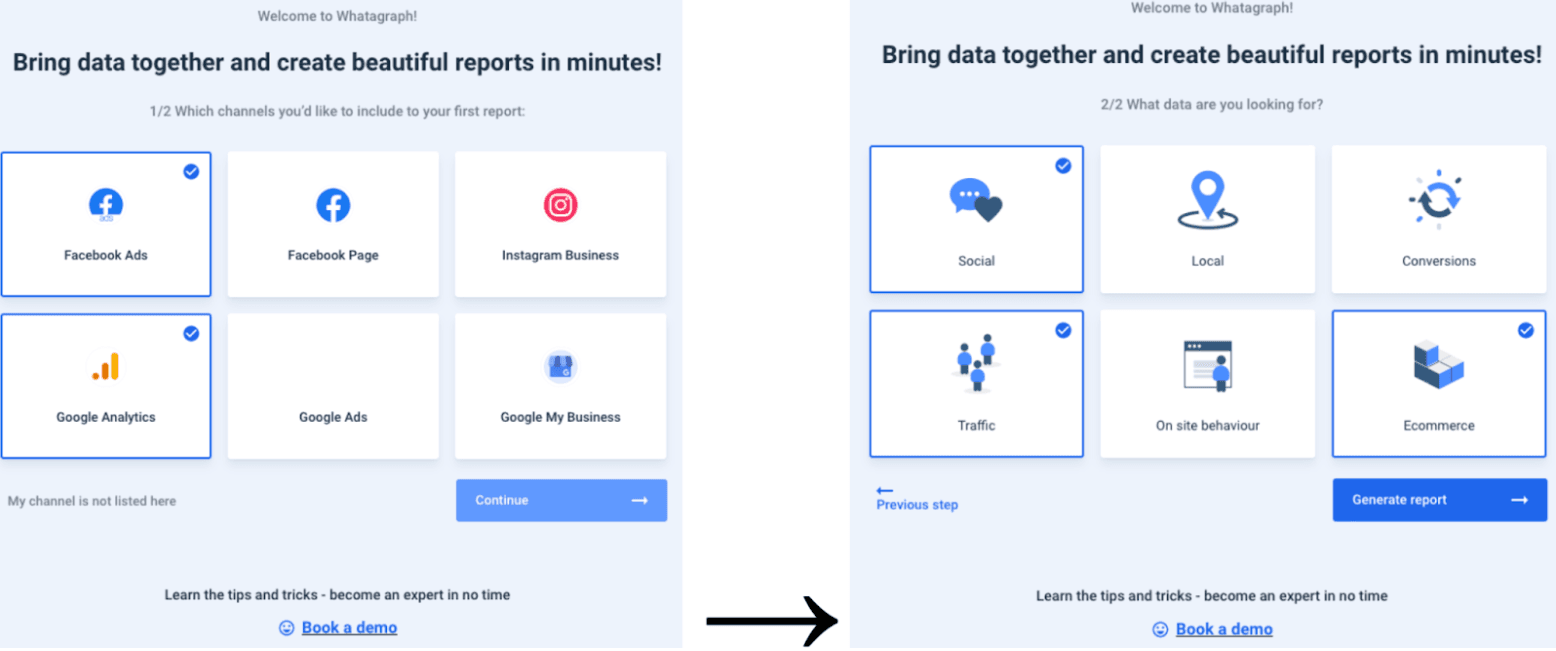
One of the weakest aspects of Looker Studio is the fact that they do not provide its users with an efficient way to share reports and dashboards.
Looker Studio users can't:
- Export reports to PDFs to email their clients;
- Generate a report URL;
- Send frequent automated report emails;
On the other hand, Looker Studio users can:
- View reports online;
- Share a report with only other Looker Studio users (you can only set permissions in the same way you would with a Google Doc, so it's far from ideal);
- Get a paid enterprise subscription to share reports in the cloud.
Agency reporting is a multifaceted task. You need client reports to keep them informed and in-house reports to track your performance. Whatagraph offers flexible report automation with downloadable PDFs, live and embeddable links, report scheduling, and more.
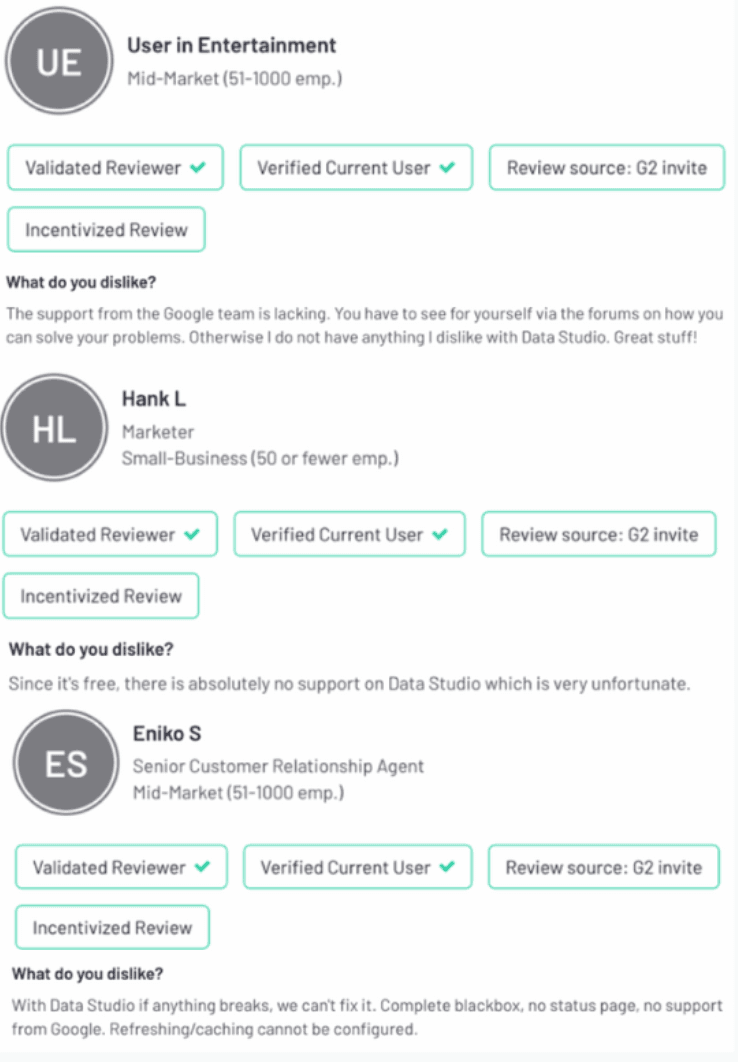
Looker Studio Support and Onboarding
Because Looker Studio is free, you literally cannot expect any customer support or onboarding. If you have an issue, an error, or want to ask questions, you'd first be guided to FAQs, then various guides and videos, and, lastly, to a Help Community. They do provide a support email. However, it's been noticed in the G2 and Capterra reviews that they take ages to reply.
 Whatagraph, on the other hand, provides 24/5 customer support. Whenever you create a report, you'll get a live Chat support pop-up on the right-hand side where you can report an issue or contact one of our team members. To make solving bugs and answering questions even more efficient, we dedicate account managers to each customer to troubleshoot and advise on demand.
Looker Studio Pricing
Usually, data reporting tools are expensive. However, Looker Studio is completely free. Of course, the only thing marketing agencies need to purchase is data storage, paid connectors, and data processing.
Another thing to mention is that the above-mentioned connector prices add up. And because marketing agencies usually use a couple of them to develop a proper comprehensive report, using GDS to create a report ends up being - not at all free. So, add up the costs of data storage, paid connectors, and data processing, and you get a pretty expensive reporting tool.
Alternatively, you'd want a reporting tool that easily pulls, gathers and aggregates data.
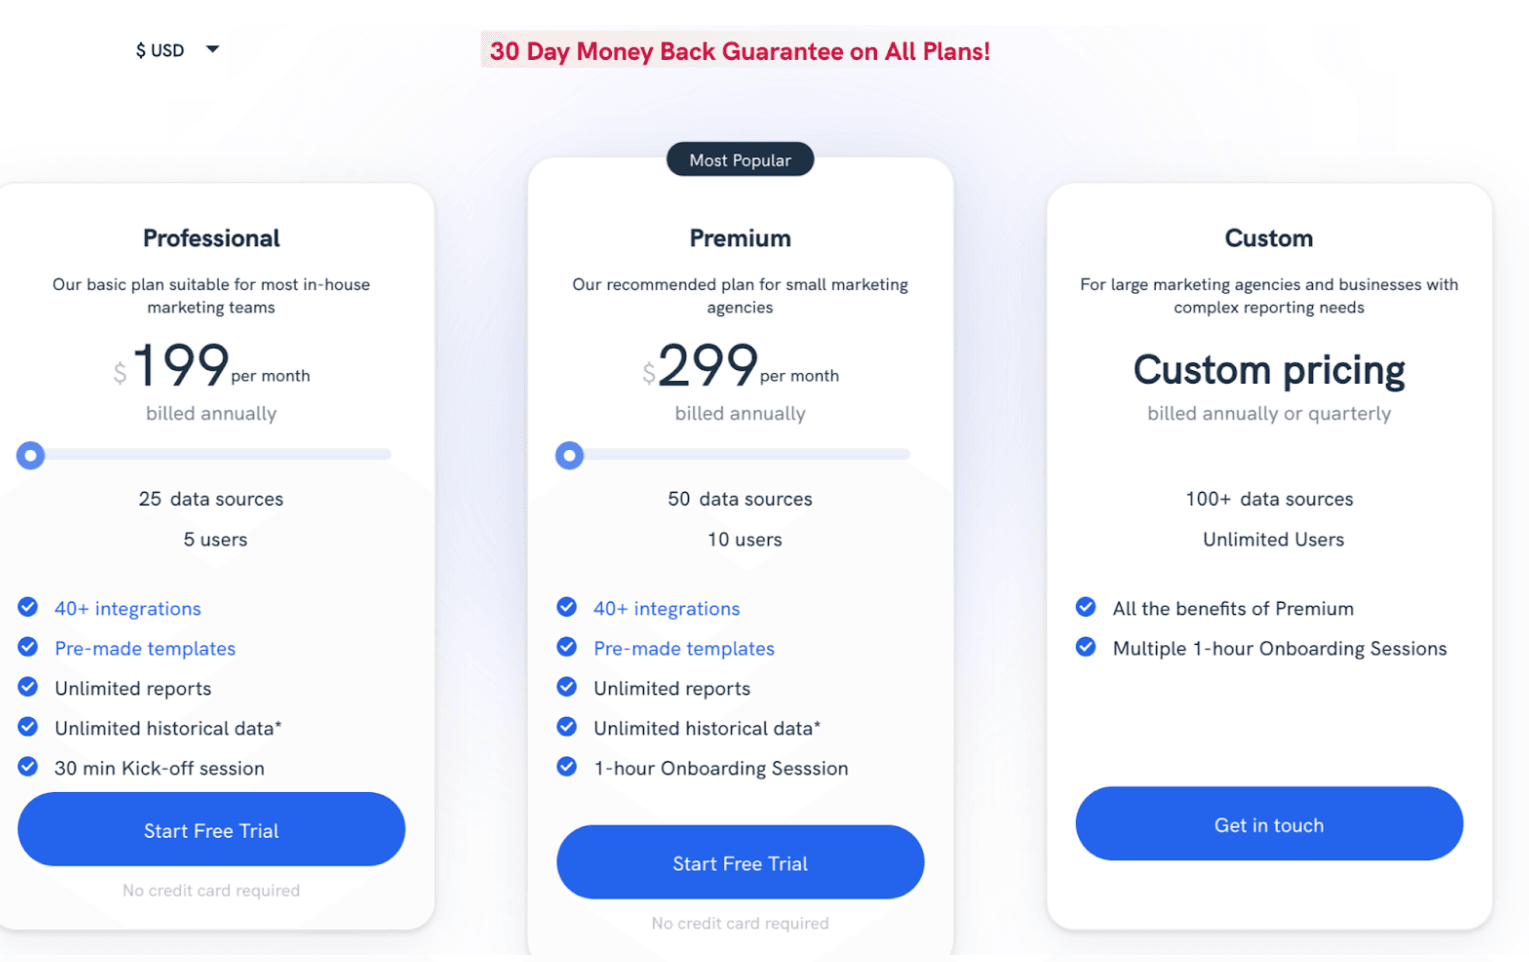
For example, Whatagraph does exactly that. All packages allow you to connect to any 40+ platforms Whatagraph integrates with and create an unlimited number of reports. All pricing options are customizable and flexible to accommodate marketing agencies of different sizes and needs. Current tiers consist of a Professional, Premium, and Custom plan. Whatagraph can be purchased annually with a -30-day money-back guarantee.
If you need more information about pricing, we have an entire article dedicated to Looker Studio pricing.
Looker Studio Limitations
Long story short, these are the limitations of the Looker Studio:
- No API for automation;
- Lack of real-time updates;
- Limits to the number of charts ;
- Lack of white-label options;
- No support;
- Slow speed when using live connection.
If you want to learn more about these, we have an entire article on GDS limitations.
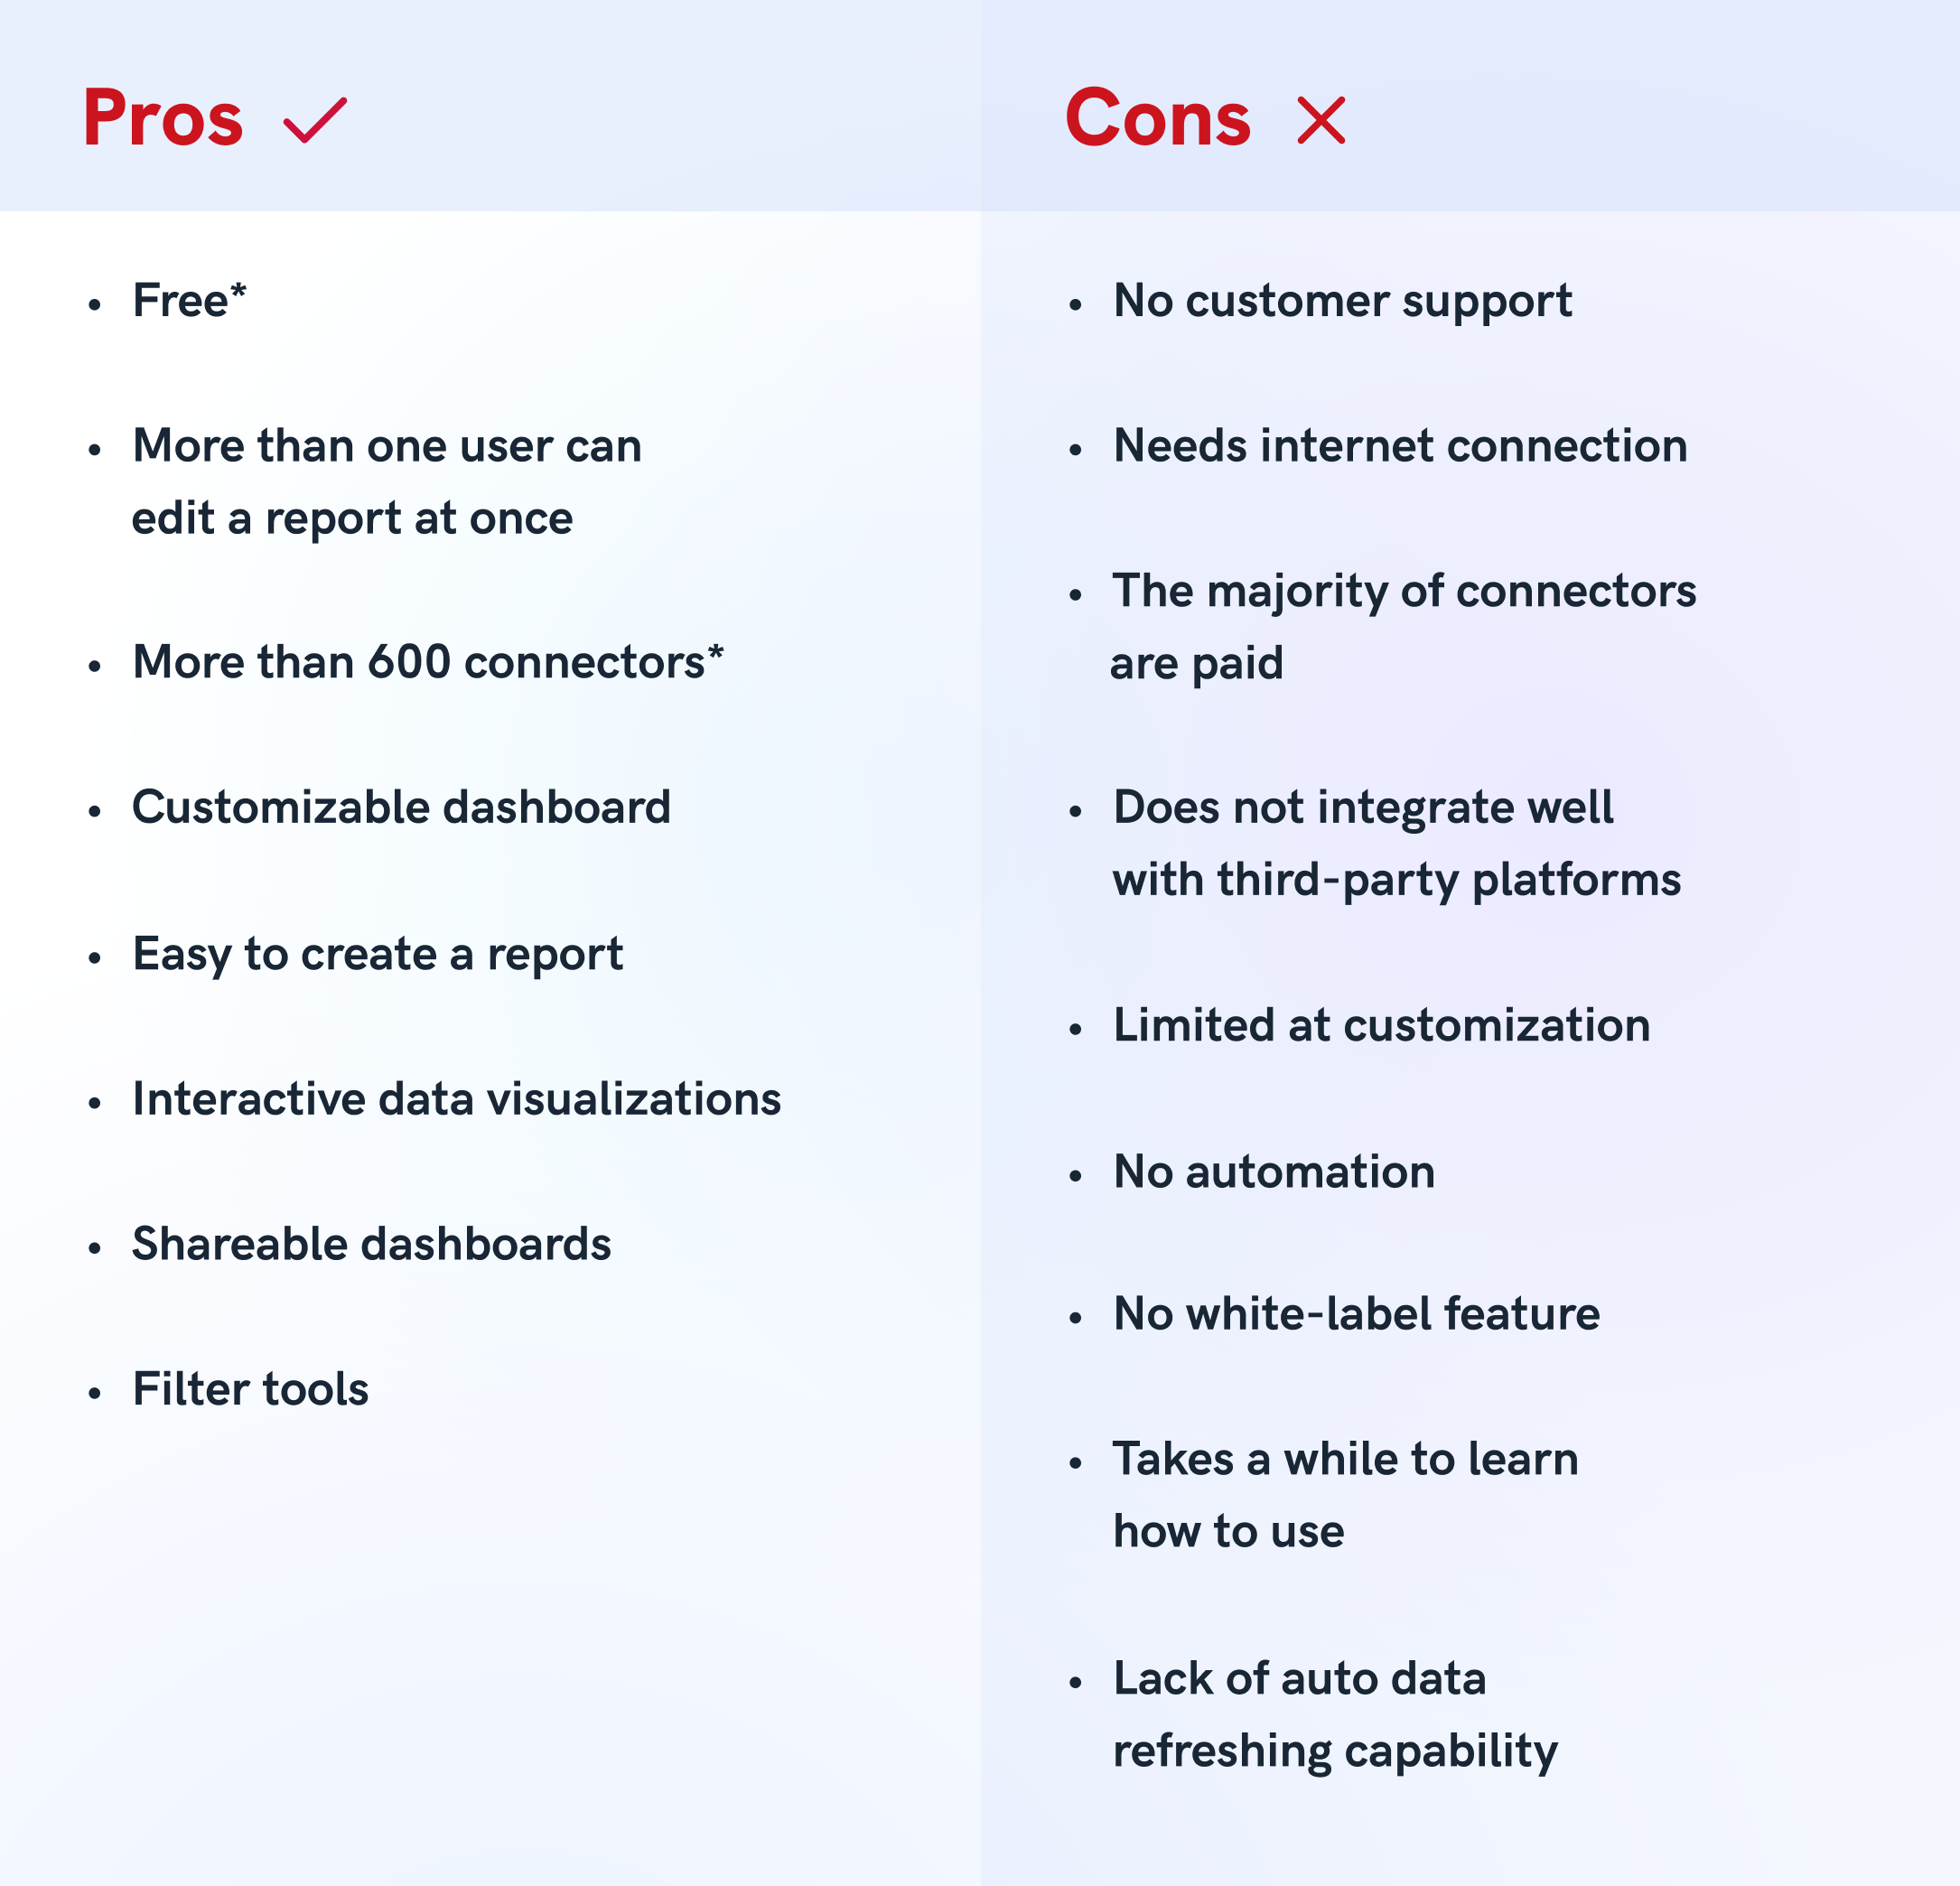
Looker Studio Pros and Cons
A More Powerful Looker Studio Alternative - Whatagraph
So much more than Looker Studio - Whatagraph.
If you want to save time, scale reporting for your clients and clearly set, easily trackable KPIs without grey areas, then we might be your solution.
If you constantly want to have a right hand, assisting you at any time of the day; If you want to create a report in less than 5 minutes; If you want to automate your reports - then we are definitely a solution for you.
We are proudly a cross-channel marketing reporting, monitoring and data visualization tool. Or in other words, a tool that connects different data sources and marketing tools into one place and makes a good-looking report.
Yes, you'd need to do a little investment and get a plan, but what you'll get is invaluable:
- Time gains: dedicate less time to data analysis and more time to revenue-generating activities;
- Allows you to quickly create a report because of a fast learning curve (for example, to prepare for a meeting with a client) = saves time, and reduces stress;
- Customers can sell "their" branded reports and look professional. Customers are pleased because they receive well-readable reports in their mailbox;
- Customers can view what is happening across all of their channels in one place;
- Excellent ROI - Saves time and money on labour. - Automation - ease of use - more visualization than theory, bespoke tool - excellent customer and personalized service.
Bottom Line
While Looker Studio is popular too, it has many drawbacks, one of the major ones - it claims to be free while, as proven above, it isn't. We want to offer you a monthly subscription plan to meet all your marketing agency's needs. From highly rated 24/5 support to a user-friendly interface, and from report delivery automation to customer-based platform updates.
Sign up and start reporting for free for 7 days! It's time to devote your time to the tasks that truly matter, and let us handle your marketing analytics.