
Not sure how to get better results from your video marketing? The answers are in your video analytics reports. See how to get the insights you need.
Not sure how to get better results from your video marketing? The answers are in your video analytics reports. See how to get the insights you need.

Jan 22 2019 ● 11 min read
So you made a commitment to do more video marketing in 2019. (Good for you!)
Because you are a data-driven driven marketer, and you’ve probably already dabbled in video marketing a bit, you decide to go look at your YouTube video analytics reports before you just dive in and hit “record” for your next video.
You want to know what’s been working – or not been working – in your account.
But then… you stop. Because there doesn’t seem to be any really actionable information in those reports. It’s just a lot of charts and graphs, some with good news, some with bad news. But you don’t see any immediate clues for what to do next.
This post is to help you see the opportunities in your YouTube analytics reports – the actionable insights “hidden” in the charts and stats and data. By the end of reading this, you’ll:
Sound good? Let’s get started.
Let’s talk about goals first. It’s not enough to be doing video marketing just because it’s “a thing”. You should have a strategic business reason for why you want to do it, with a specific, measurable goal.
Video marketing goals tend to break out into the following three categories:
Maybe you want to do all three of those things. That’s OK, but we recommend picking one as the primary priority. If everything becomes a priority, then nothing is really a priority.
Now let’s talk about how to measure these goals. You may already be familiar with most of these metrics, but we won’t spend long here, and the refresher will be helpful in a moment.
Shares: How many times a video has been shared.
Impressions: The number of times a video’s thumbnail has been shown to users on YouTube. Thumbnails can appear on the YouTube homepage, subscription feed, search, and “up next” section. This is just how often they’ve been shown – not whether they were clicked or not.
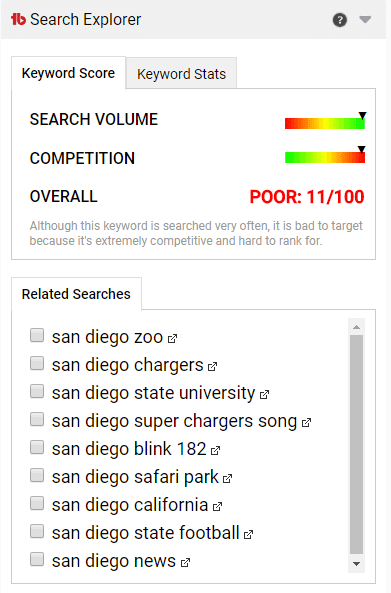
If you have lots of impressions, but not many views, your video may be in front of the wrong audience/s – or your cover image may not be working well. Or your video may need better search optimization. Use tools like YTCockpit and Keyword Tool to get your videos’ keywords dialed in, and try to do keyword research before you make videos going forward.
Backlinks: Yes, you should measure how many backlinks your videos generate, just like you would with any other type of content. Because backlinks deliver traffic and help with SEO, you might want to consider the number of backlinks a video generates when you assess how much of a return on investment it’s generated for you.
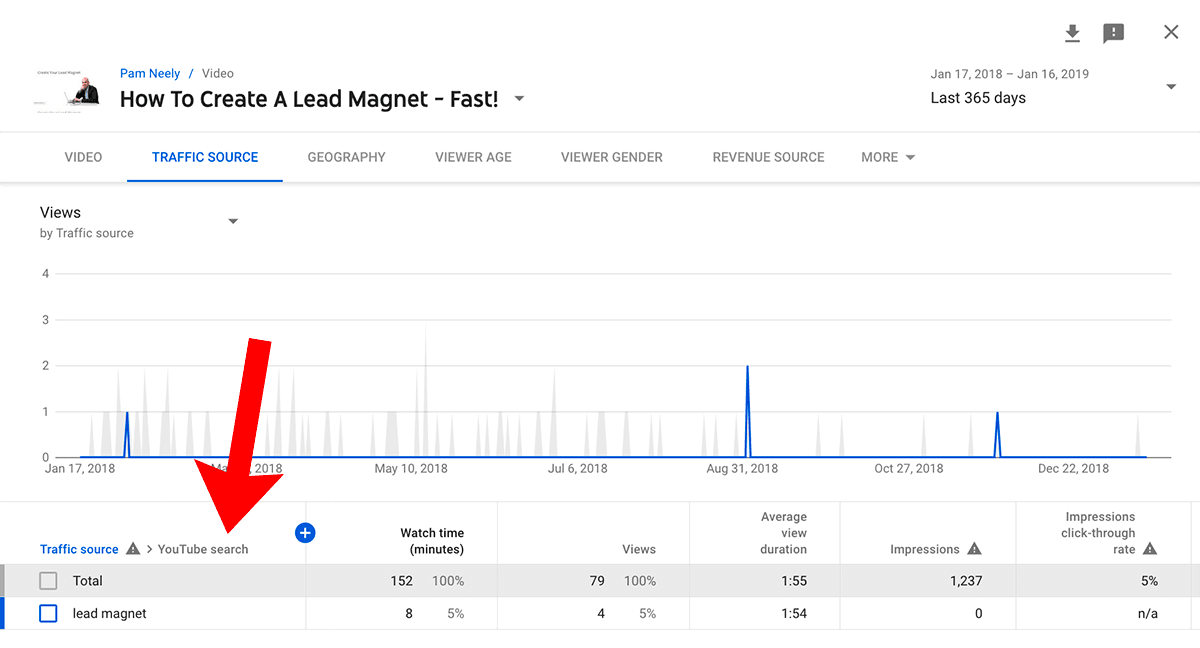
Keywords: Want to see which keywords your videos are appearing for? You got it: It’s in the “Traffic source > YouTube search” view. You can also see the percent of views, average view duration and impressions click-through rate for each video.
Watch time: The total amount of minutes viewers have spent watching your videos. This is the most important metric according to YouTube and many video marketing experts. You should be optimizing your videos for watch time. Note that you can also break out watch time for subscribers versus non-subscribers in the “Build An Audience” tab.
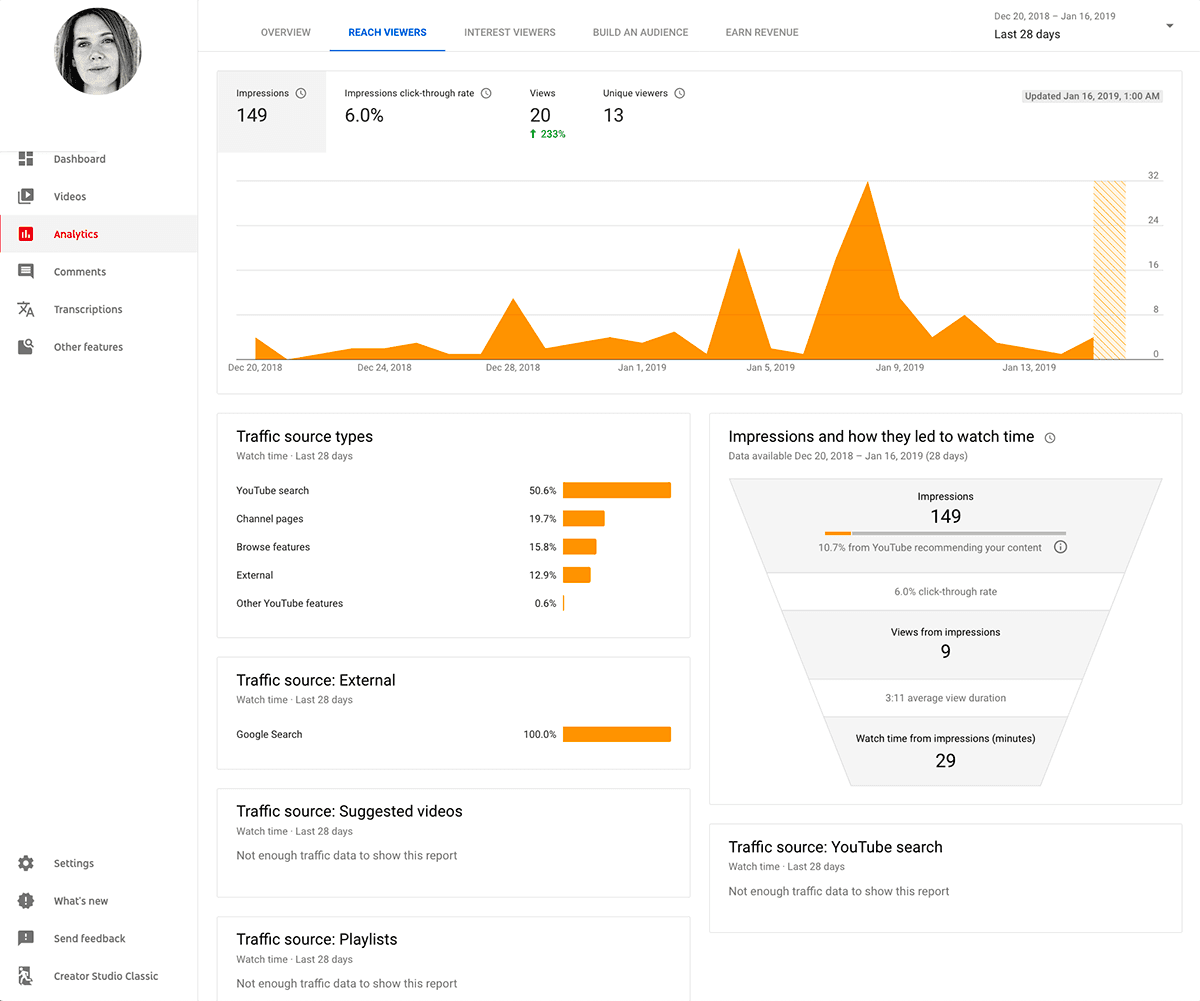
Impressions click-through rate: A percentage of how often people clicked on a video’s thumbnail. You can see the impressions click-through rate in the “Reach viewers” main page (see below), or broken out by traffic source.
Traffic sources: Where on YouTube (or Google or elsewhere) your video is being viewed from. This can reveal very interesting information about how to optimize your videos.
Comments: How many people have left a comment about your video. Comments are a rich source of insight about what your audience thinks of your content. Some videos get lots of comments; some get none. Ideally, we’d be able to measure sentiment for comments, but that might require more sophisticated software than what YouTube offers.
To get more comments, just ask for them, or try asking a specific, compelling question near the end of your video. The right question can make people much more likely to leave a comment. Having more comments will help your videos get more impressions.
Average View Duration/Audience Retention: This is how much of your video the average viewer watches before they leave. While this is only anecdotal, many video marketing experts say that a 30% average view duration is, well, average. Anything below that, and your videos need work.
To improve this metric, try to do an extra good job on the first few seconds of your video. Skip the long intros, the big flashy graphics promos. Tell people what the immediate benefits of watching your video will be (in the biz, this is called your videos’ “value proposition”). Make your videos actionable and all about the viewers.
Likes/dislikes: How many people like or dislike your videos. This metric affects how high your videos will appear in YouTube search results. You can often nudge this metric just by asking for likes.
Subscribers: How many people have subscribed to your YouTube channel. Actually ask people to subscribe in your videos – it really does make a difference.
Views: YouTube counts a view as 30 seconds. On Facebook and Instagram a view is counted as 3 seconds. This is probably the most-mentioned video metric, but it’s not the most useful one. Focus on watch time instead.
Unique Viewers: This is how many individuals saw your videos. One viewer can create multiple “views”, so many marketers place more weight on the unique viewers metric. If you’re used to website analytics reports, this is the equivalent of “unique visitors”.
Play rate: (or “Clicked-to-Play” on Facebook) How many times a user clicks the play button on these videos. Some platforms divide views by unique and returning webpage visitors.
Top end screen element types: This refers to the different call to actions you can add to the end screen of the video (like cards, for example). Because these are basically conversions, this is an important metric. Test which end screen elements work best.
Geography / Viewer Gender / Viewer Age: These are all just what they sound like. But definitely pay attention to them. Knowing who your audience is allows you to create videos more customized to them. This will increase engagement for your existing viewers, and is likely to attract more viewers like them, too.
Referral traffic: How much traffic your website is getting from YouTube.
To link your YouTube channel to your Google Analytics account, follow the instructions here. To link your YouTube channel and Google ads, follow the instructions here.
Sales/Conversions: Our favorite metrics. These could also be demo requests or inbound calls depending on how your business is set up. But definitely do try to tie your videos directly to meaningful business metrics – all the way from leads or calls or demos right through to cold hard cash. Even if the measurements aren’t perfect, remember: “That which is measured, improves”.
You may need to set up a few “goals” in Google Analytics in order to track which concrete conversion actions your YouTube traffic has driven (or that any other traffic has driven).
Let’s walk through the analytics for a real video and see what we can reveal.
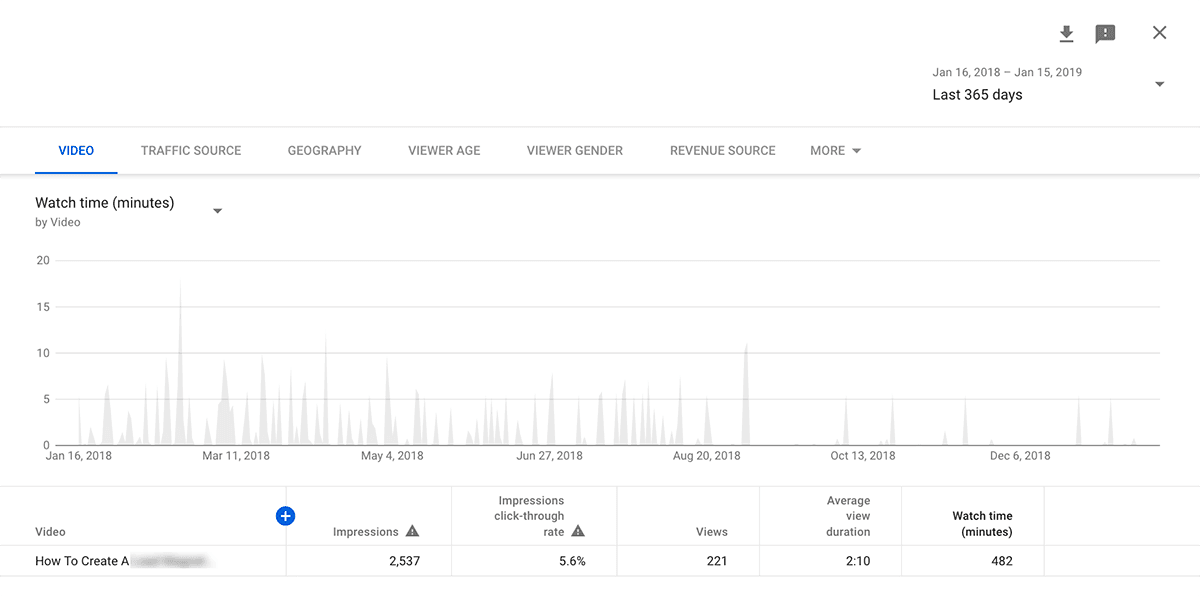
This video’s watch time has been falling off in the last few months - right after late August. And when I toggle over to look at impressions, views, and average view duration, all those metrics decline after late August, too.
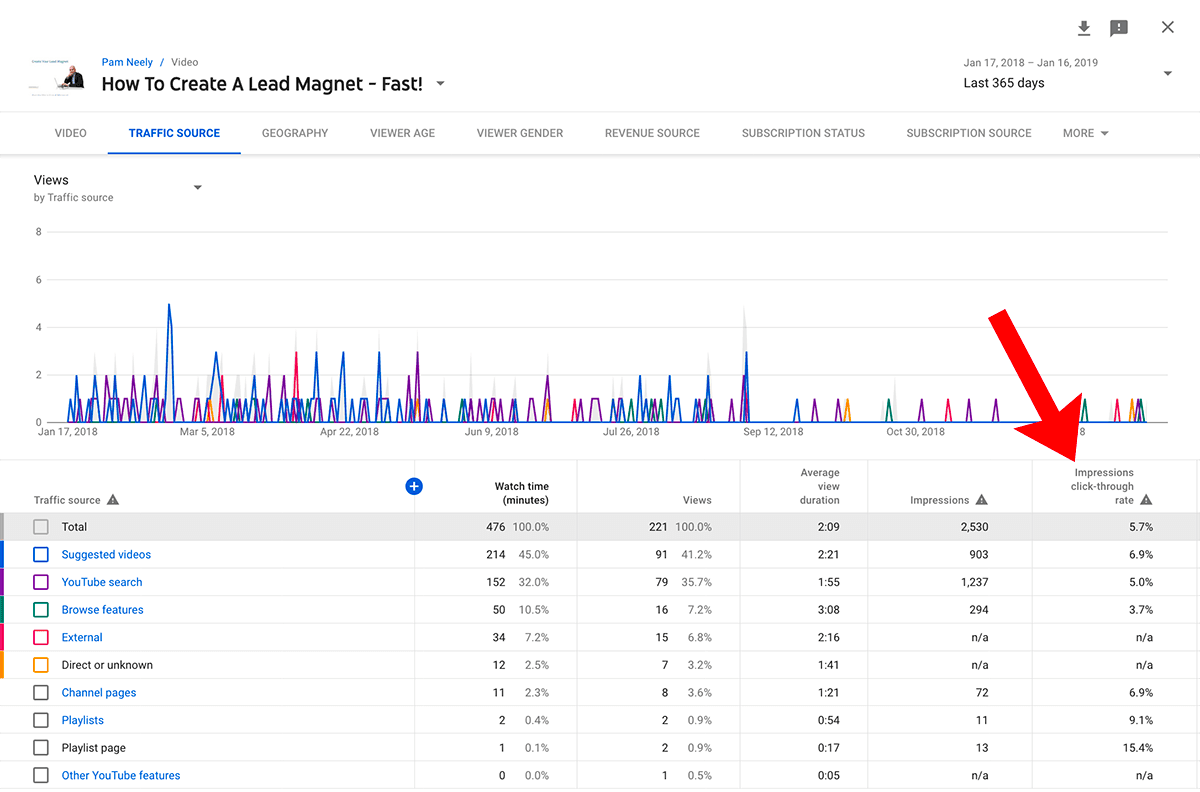
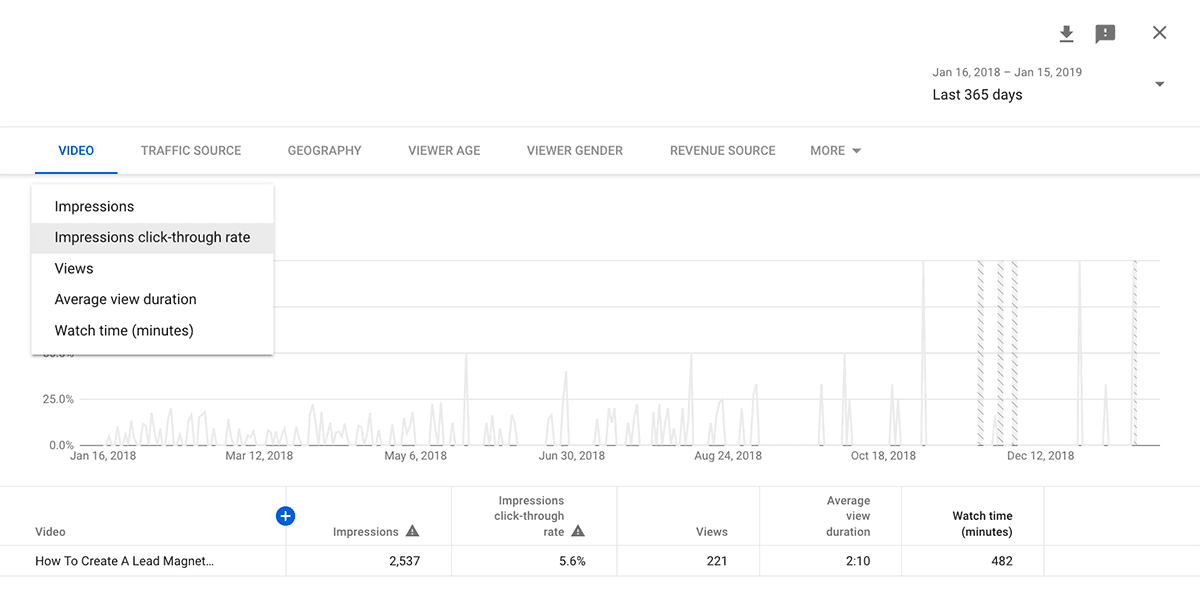
Except for one metric: Impressions to click-through rate. That actually goes up after late August (note that the striped areas are where data is not available):
Just for context, the overall Impressions to click-through rate is decent for this video – it’s 5.6%. According to Google, “Half of all channels and videos on YouTube have an impressions CTR that can range between 2% and 10%.” So if you’ve got videos with higher than 10%, give yourself some applause.
Let’s look at the traffic sources to see if we get any clues.
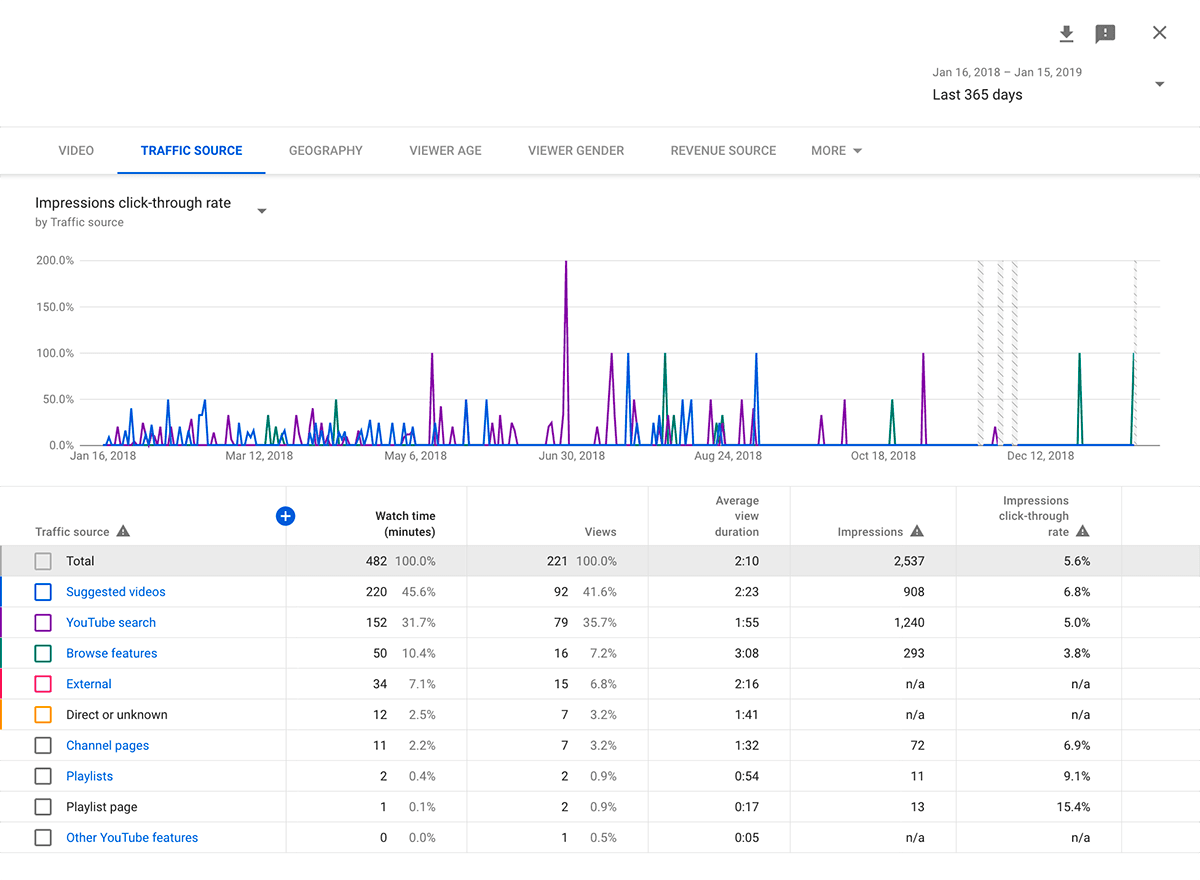
There’s our clue: A much higher proportion of the traffic is coming from the “Browse features” traffic source.
Based on that traffic source information, and how all the other metrics except impression click-through rate are declining, this appears to be a video that needs help with being found via YouTube search.
So how might I fix a search issue? Well, just looking at the video’s page gives some clues.
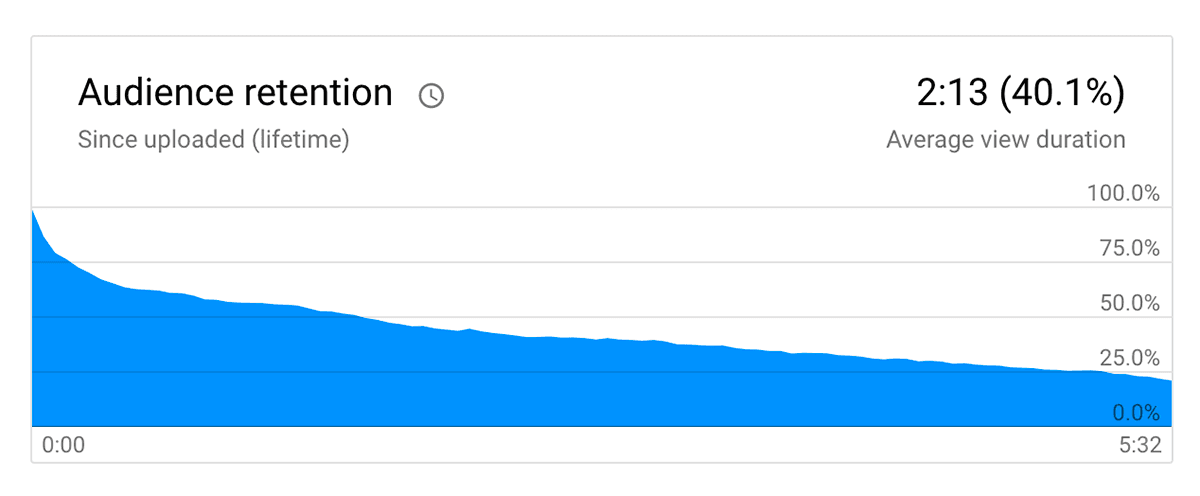
This video is nine minutes long, but most people are dropping off at about the 3-minute mark.
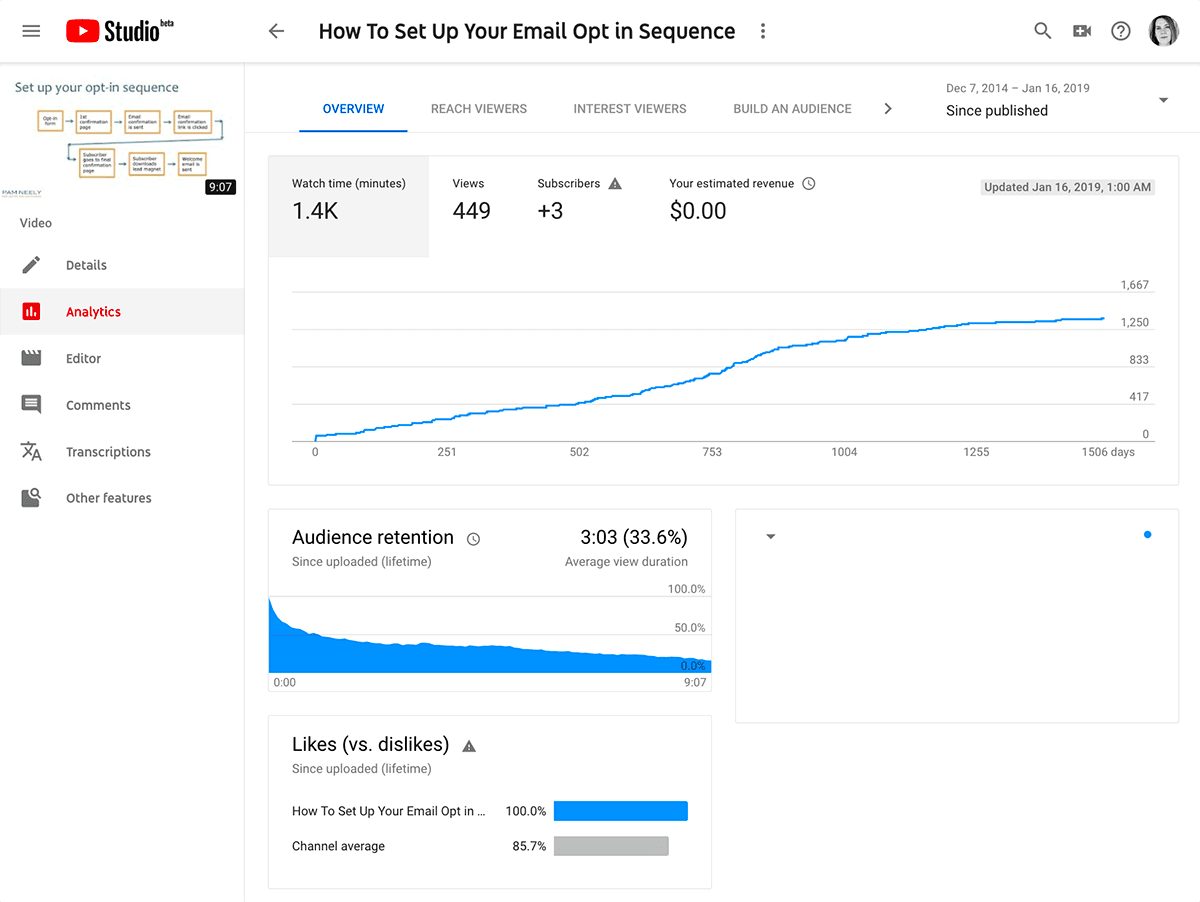
Just out of curiosity, I played the video, watching just before the three-minute mark until a few minutes after it.
The problem jumped out immediately. There’s a clear topic shift in the video right at that three-minute mark. I shift from discussing the flowchart in the thumbnail to talking about opt-in forms. A lot of people drop off as soon as the flow chart discussion ends.
The solution? Cut this video at the close of the flow chart discussion and add a separate video about how to optimize opt-in forms as a sequel.
Or I could insert a “pattern interrupt”. This is an abrupt change in the video that creates surprise and re-engages viewers. It could be something like an overlay of me stepping in front of the two-dimensional presentation slide, or a poll like this:

Pattern interrupts can be done in all sorts of ways. They’re a true trick of the trade amongst video producers and public speakers as a way to shake up an audience that’s starting to disengage.
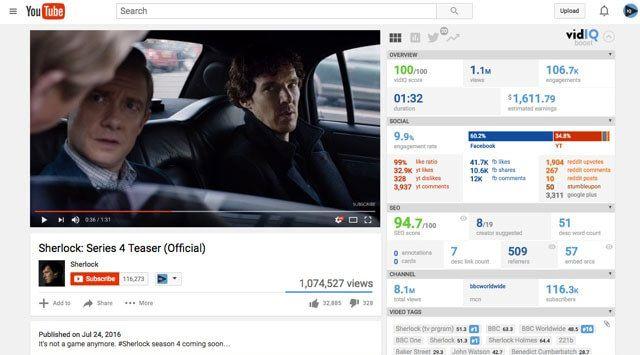
Don’t just look at your own videos’ analytics. There are some excellent competitive analysis tools like vidIQ Vision that can show you all sorts of interesting information about other people’s videos.
Once you know how to read the reports and what to look for, YouTube video analytics reports can become downright fascinating. Who wouldn’t want a data-backed, customized punch list of ways to improve their YouTube marketing?
Published on Jan 22 2019
WRITTEN BY
Pam NeelyPam is an award-winning freelance content writer with expertise in SaaS, MarTech, and small business marketing companies. A business book ghostwriter in her free time, Pam always writes from a B2B owner perspective.


By submitting this form, you agree to our privacy policy