
You can't improve what you don't measure. KPIs or Key Performance Indicators are a superb way to stay on top of your work and its progress. Here is what KPIs are and how to track them effectively.
You can't improve what you don't measure. KPIs or Key Performance Indicators are a superb way to stay on top of your work and its progress. Here is what KPIs are and how to track them effectively.

Dec 30 2019 ● 9 min read

Following the correct Key Performance Indicators for your business, agency, or clients with clear KPI dashboards and KPI reports will answer how to make your strategies increasingly successful.
Making sure your business thrives can account for a lot of sleepless nights, especially if you’re not too confident in the growth plan and performance indicators and benchmarks you’ve set up.
Agencies use Key Performance Indicators (KPIs) to measure and analyze the progress and growth of their marketing and sales team efforts, as well as identify the areas that can be improved.
This makes it crucial to follow the correct data and constantly improve your KPI process.
Clear KPIs and KPI reports have the power of delivering important insights into how your business (or your client’s company) can thrive, as well as be used as progress goals for your entire team (from financial departments to marketing and sales).
In fact, individuals are 42% more likely to achieve goals when they are physically recorded, according to Inc. So let’s start recording those KPIs!
A Key Performance Indicator is a value (measurable through different metrics) that offers information on how effective is a business at reaching its targets and objectives, as well as which areas need improvement.
KPI analytics such as revenue growth leads by sales platform, net sales, customer retention, turnover, etc., hold a lot of information about your business’ strengths and weaknesses.
They also show how you sell, where you sell, how much you sell, and why you sell.
While high-level indicators reveal the overall performance of a company, lower-lever KPIs analyze processes across all departments: financial, sales, marketing, support, etc. In short, there are different types of KPIs and choosing the right ones makes all the difference.
A KPI report is a system, tool, or file that helps you keep track of and analyze the evolution of your key performance indicators on a monthly, quarterly, or yearly basis. Reporting offers insights into a business’ trajectory in a simple and concise manner.
A report should be easy to follow, but still include all the KPI metrics that help identify strengths, weaknesses, and trends in your business model across all departments, as well as one-on-one comparisons with data points from previous marketing reports.
Use interactive metrics dashboards, charts, and graphs to complement the information and make it easier to understand.
There’s a common misconception that metrics and KPIs are the same things. In reality, metrics are tools that help measure KPI. In other words, current values, target values, and different metrics are used to create key performance indicators.
To set your KPI, find the key areas of interest for your business, then measure important metrics that will indicate the performance in those key areas.
Here are some questions to help you create effective KPIs, and examples of metrics that will offer answers:
If your KPI is revenue growth, you can follow net or gross sales, and also look at data such as call center KPIs, website sales, mobile app KPIs, sales by country, return on equity, etc.
In other words, how do your customers prefer to buy from you? The metrics you need to look for have to do with customer care, call center leads to sales ratio, website leads to sales ratio, social media leads, ad leads, etc.
To better understand the core audience that is truly interested in your product or service and is more likely to buy, you need to follow audience stats like country, age range, sex, purchase method (website vs. call center), etc.
SLA, short for Service Level Agreement, is a progress measurement system and is often confused with KPIs. Here’s how they are different:
SLAs are expectations established between a service provider and the customers.
KPIs are generally used to measure how well a company, business metrics, or team is doing against its strategic goals.
Sometimes, a KPI is a part of the service level agreement. You set requirements from Service Level Agreements to create the metrics and define the key performance indicators. Therefore, the KPI measurement will show how well you are achieving your goals.
KRA stands for Key Result Area and highlights the areas of business processes that require a high-level performance to achieve the desired results.
Key Performance Indicator is used to measure the achievement of an objective – these objectives are defined using KRAs. KRAs identify the areas that need top-notch performance, while KPI gauges how well these business objects are getting achieved.
As the main solution to measuring a business’ evolution towards its goals, key performance reports also come with a series of extra benefits for your business at both a macro and micro level.
Here’s what you can do through KPI tracking:
The obvious first benefit is that this is the best method to measure through clear values how different aspects of a company’s efforts are evolving.
The best part is that the insights you obtain through KPI reports are actionable, enabling you to make better decisions going forward.
While every business sets off with a few general goals in mind, the data you obtain through reports gives you the option to elaborate on those goals and make informed decisions for improvement.
Clear KPIs can also break down complex situations and help uncover alternative goals you might have neglected initially.
This amount of data explicitly showcases which parts of your strategy are working seamlessly and which parts need to be re-evaluated. You’ll be able to find all of the strategic issues, start fixing them and improve business performance.
It will challenge your strategic thinking but improve your decision-making skills, and you’ll only have to gain from it.
Sometimes the main concern within a certain department may not be in line with the efforts of their colleagues from different departments.
While the sales department is preoccupied with…well, sales, marketing may tend to focus on their campaigns. So how do you bring everyone on the same page?
It may not be as easy as it sounds, since 40% of managers cite failure to align as the single greatest challenge to executing company strategy, shows Harvard Business Review.
Setting clear goals that absolutely everyone within the company works to achieve will surely focus the energy on the most important tasks and drive better results.
Everybody likes to know they’re good at their jobs, right? Measurable positive results are the best way to show employees that they’re doing a great job, which will further incentivize them to perform even better. One of the ways to find those results is to use a 90 day review and keep the pattern.
In fact, you can also use KPIs to send out bonuses to the top-performing employees, just as an extra ‘thank you’.
The key to creating a relevant indicator is finding out what are the main objectives of your data-driven company. You should also figure out how these indicators are going to help achieve business goals, and offer confidence to any stakeholders that might get to read the report.
The conventional metrics used in KPI reporting may include informative and actionable parts such as Charts, Graphs, and Tables.
However, following industry-recognized KPIs without understanding your own business and objectives will not get you far. To see actual results, you need to set simple, easy-to-understand keys that are adjusted to your business exclusively.
Here are 4 steps that will help your process:
Measuring is an important part of KPI reporting: it’s the primary key that informs you about the success or failure of your work.
You need to measure the progress made towards the achievement of your target. That could be increasing the number of sales or the number of new customers.
Pick a target audience you aim to reach during a set timeframe. Think of your ideal customer.
You can set more than one target group, or even secondary audiences, and create different KPIs for each one.
This way, you’ll be measuring your progress step-by-step and you’ll have more detailed information about your ideal customers and their expectations.
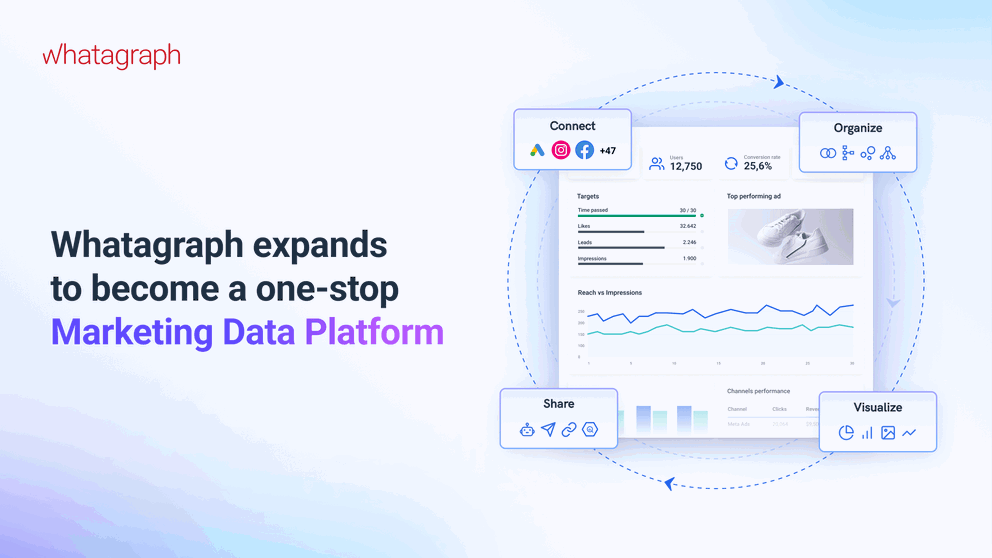
Your KPI data source is just as important as any of the above steps. Good reporting tools like Whatagraph have a large number of integrations with platforms such as AdWords, ecommerce platforms, social media networks and more.
There is no shortage of software that offers data analysis. Moreover, finding the right tool for your needs may prove difficult. Make sure to find out what functionality you can benefit from the most and use that as your starting point.
Choosing a few well-trusted sources that offer features and data that are relevant to your objectives will make work easier.
Once you’ve found your ideal software for KPI reports, you can start evaluating whether you’re achieving your goals by seeing what methods are working or what needs to be changed.
Another important step is deciding on how often you want to review your plans and report your progress.
For this purpose, there are two categories of KPIs you need to know:
Leading KPIs
A leading key performance indicator measures the change and predicts the immediate progress of a company's performance in advance.
Leading KPIs are easier to improve but not as easy to measure.
Lagging KPIs
A lagging KPI defines the performance of an organization. In other words, it shows the achieved results.
Lagging KPIs are easier to measure but harder to improve.
Therefore, a lagging indicator shows the outcome, and a leading indicator is set in advance to improve the outcome. Monitoring the leading KPIs can improve the lagging KPI. Hence, both are essential parts of KPI reporting.
Organizations choose different types of indicators depending on their needs. A good report includes quite a number of KPIs, without going overboard. Bernie Smith, Founder of Made to Measure KPIs, recommends adding between 2 and 4 KPIs per goal.
Now that you have an idea of how to create the KPI report, it's time to select the indicators you want to include in your report.
KPI examples include customer satisfaction, employee retention, revenue growth, and cost reduction. Key performance indicators should always be measurable, attainable, and relevant to the company’s objectives. The best way to measure KPIs is through dashboards or monthly, quarterly, or annual reports.
Below you’ll find some examples of KPIs for various organizations. You can use them as a guide, but you should still set your own objectives keeping the specific needs of your organization in mind.
Per period:
Per period:
Per period:
Per period:
KPI dashboards are marketing tools that offer a glance into how your KPIs are performing, as a means to getting some situational awareness without creating an entire report.
They’re graphical snapshots of your stats, goals, and the progress you’ve made. It also shows what else you need to do to make progress towards reaching your high-level goals.
In short, KPI dashboards make it easier to visualize, compare the data and see trends.
One of the easiest ways to create a visual representation of your performance is to use Whatagraph. It’s a reporting tool designed for marketing agencies to collect data from multiple channels and build reports in just a few minutes.
To create the perfect KPI reporting dashboard for your agency or your clients, you’ll first need to zoom in to some of your top goals and metrics you need to follow on a regular basis.
Here are a few KPI examples:
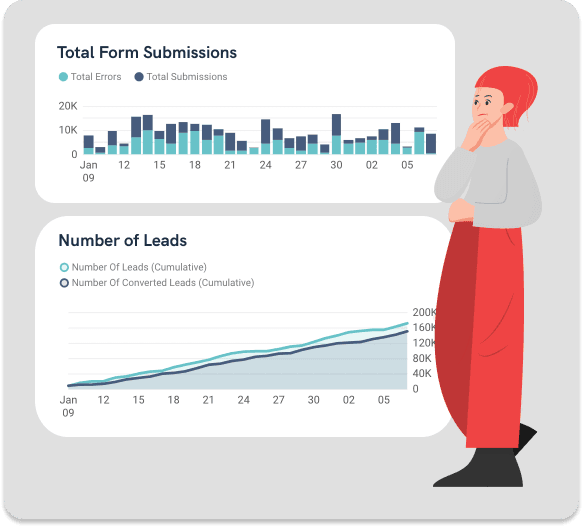
Leads (number of leads, the evolution of the number of leads, etc.)
Website traffic and sessions
Top-performing post (engagement, clicks, cost per click)
Cost per click or cost per acquisitions
Conversions (percentage of conversions, cost per conversion, etc.)
Goal completions
Of course, there are many other metrics and KPIs you might want to add to your dashboard and reports. In addition to KPI Dashboards, admin templates can also be helpful. Using admin templates will save you a lot of time as they offer ready-to-use, pre-built components. Continue reading to find out some of our choices and examples↓
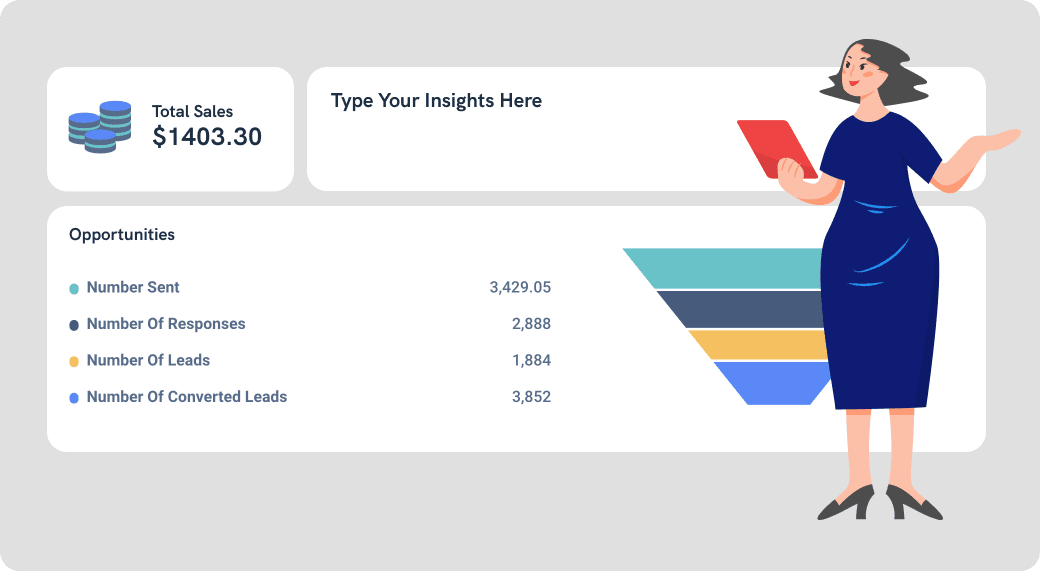
To better understand all of the above information, here is an example of a report created using Whatagraph for an ad campaign.
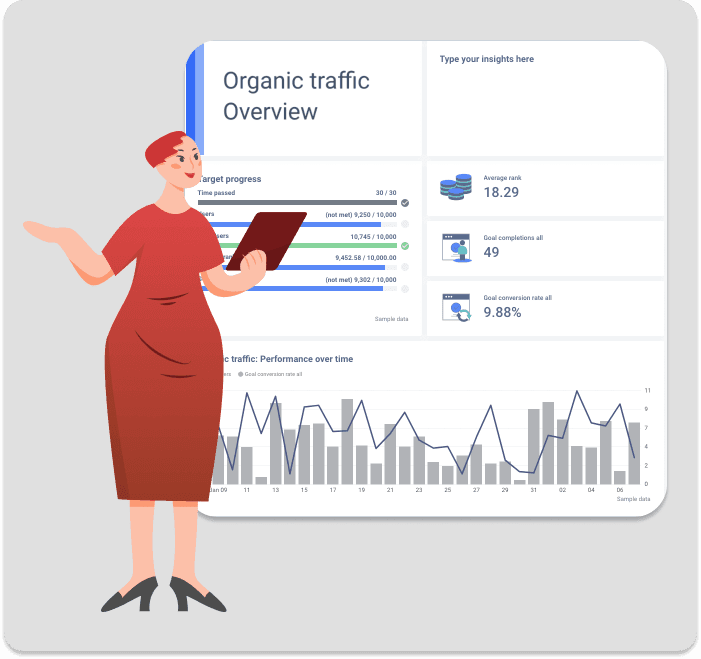
At the top, you’ll see a day-by-day breakdown of the top-performing devices, followed by a funnel of clicks, users, and leads and some of the main KPIs: total spend, cost per link click, and cost per lead.
Below, you’ll find info on the best performing post and its stats, as well as a breakdown of your audience by age and location
Get our KPI report template for PPC campaigns.
Additionally, dashboard software of your metrics shows you how your KPIs are performing, while KPI reports are excellent for more in-depth knowledge.
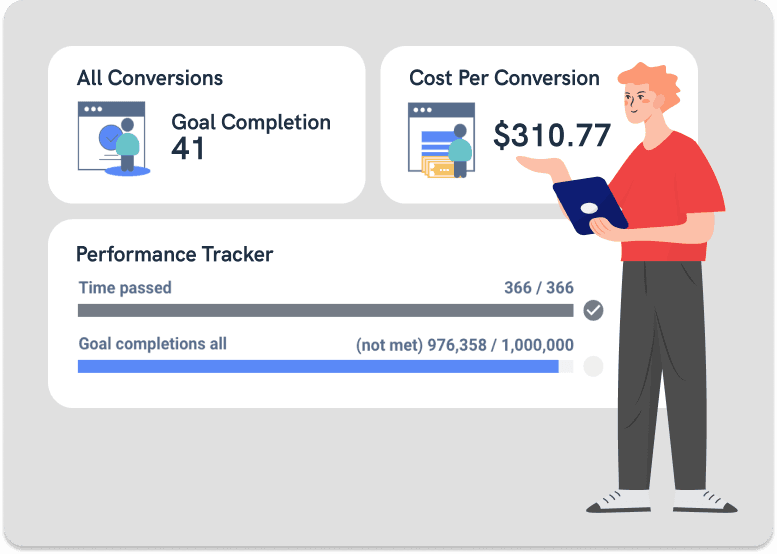
As mentioned, the dashboard’s role is to show a quick glimpse of your stats in real-time. Below is an example of a KPI dashboard for Google ads.
On the left, you can see the time range for the analysis and the goals: time passed, conversions, clicks, speed.
On the right, you have a more detailed account of the primary KPIs: conversions, clicks, CPC (cost per click), CTR (click-through rate), as well as a correlation between conversions and cost per conversion.
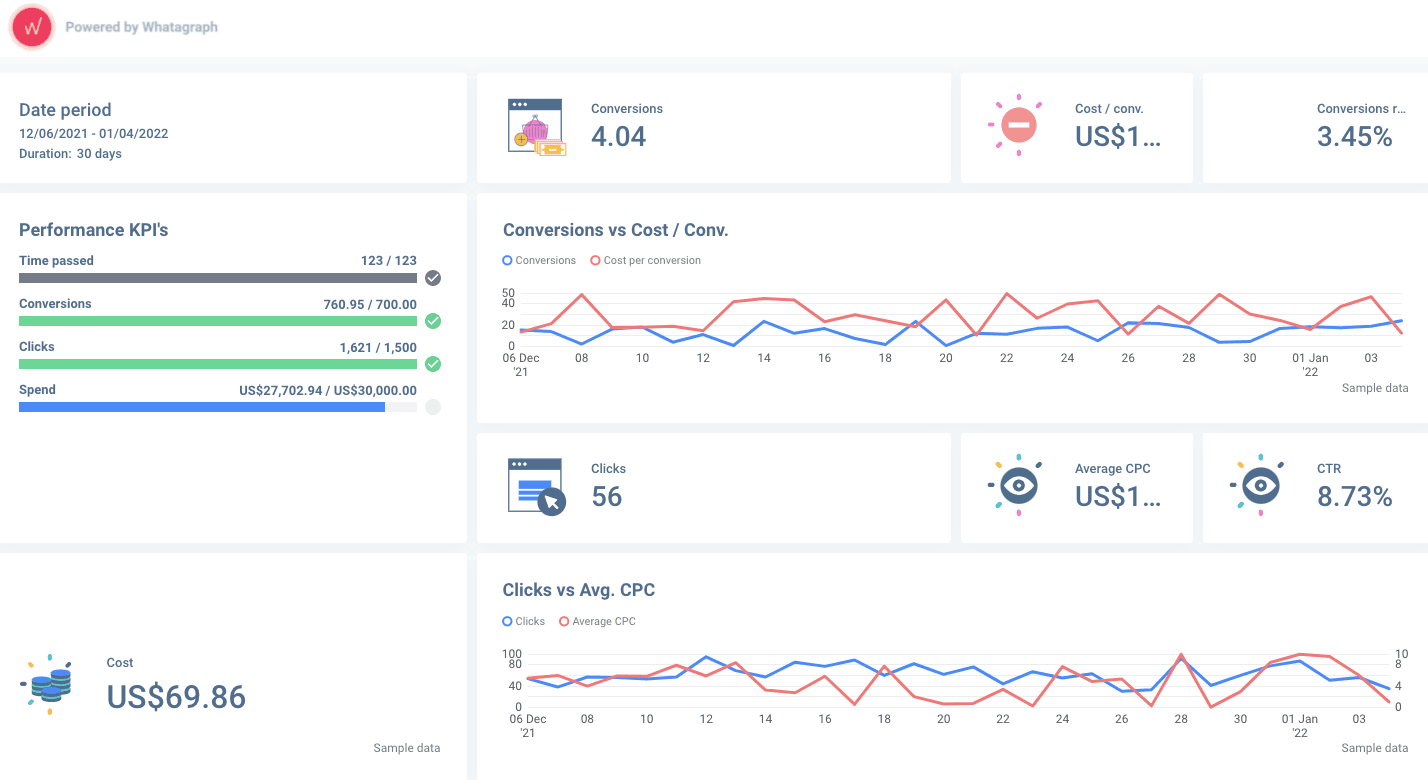
Get our Google Analytics report template!
KPIs talk about the core goals of your organization. They require an understanding of your business objectives and the ability to turn those objectives into measurable goals.
The easiest way to create a visual KPI report is to use Whatagraph. Our tool allows selecting relevant KPIs, measuring your performance based on them, and sharing it with your company so that everyone keeps track. With proper data visualization, your clients will able to see what's working and what's not.
So, what are you waiting for? Sign up for your free trial of Whatagraph today!
Published on Dec 30 2019
WRITTEN BY
Dominyka VaičiūnaitėDominyka is a copywriter at Whatagraph with a background in product marketing and customer success. Her degree in Mass Communications/Media Studies helps her to use simple words to explain complex ideas. In addition to adding value to our landing pages, you can find her name behind numerous product releases, in-app notifications, and guides in our help center.


By submitting this form, you agree to our privacy policy