A Complete YouTube Reporting Tool for Agencies
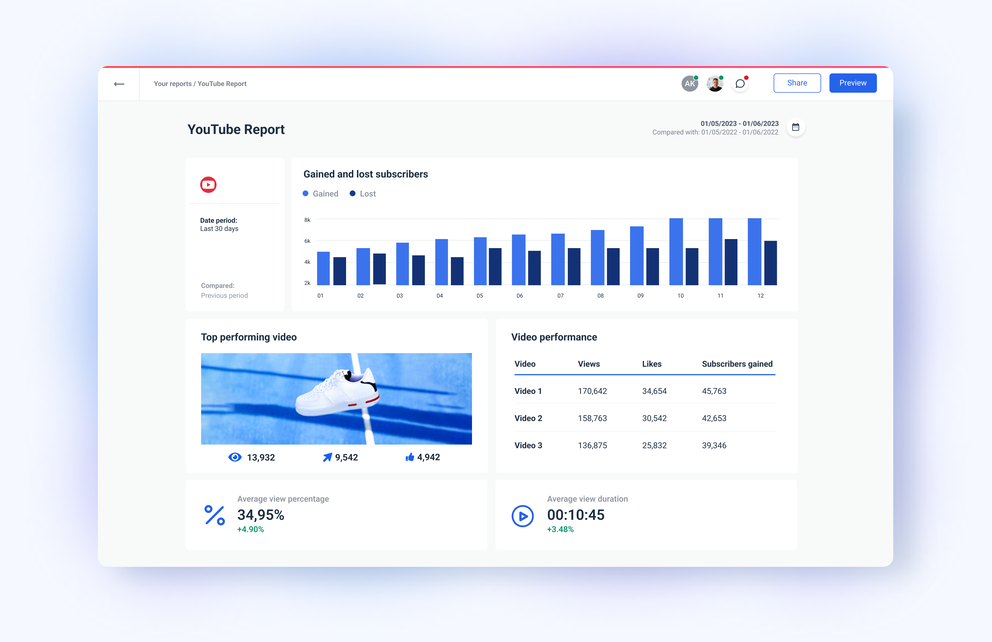
Create a master YouTube report and efficiently track KPIs and goals. Get channel and video performance data. Get timely information about your clients’ likes, comments, views and subscribers. Send customized and automated YouTube reports to your client.


Easily Track Video Analytics & Performance
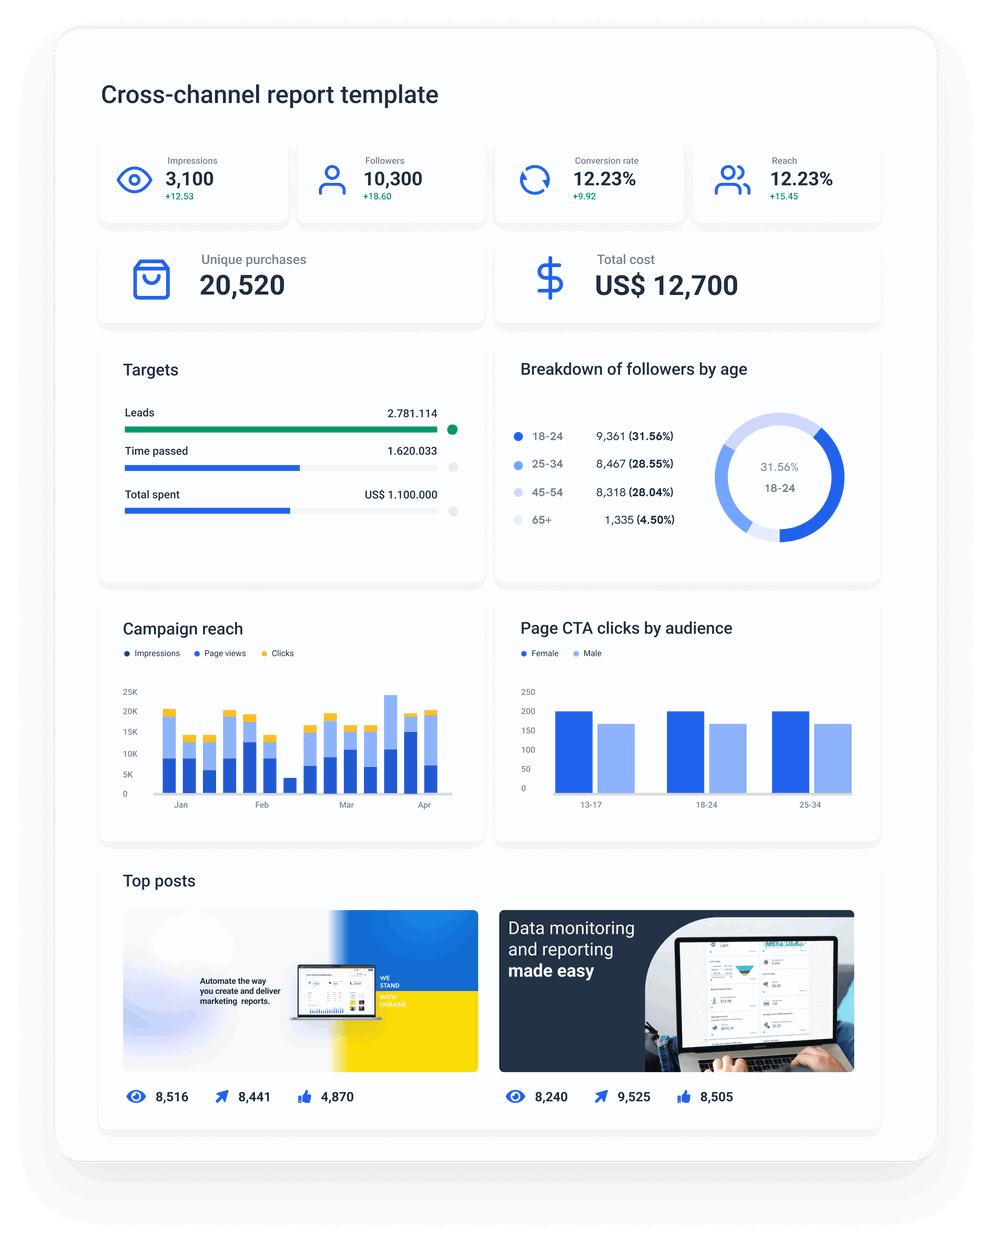
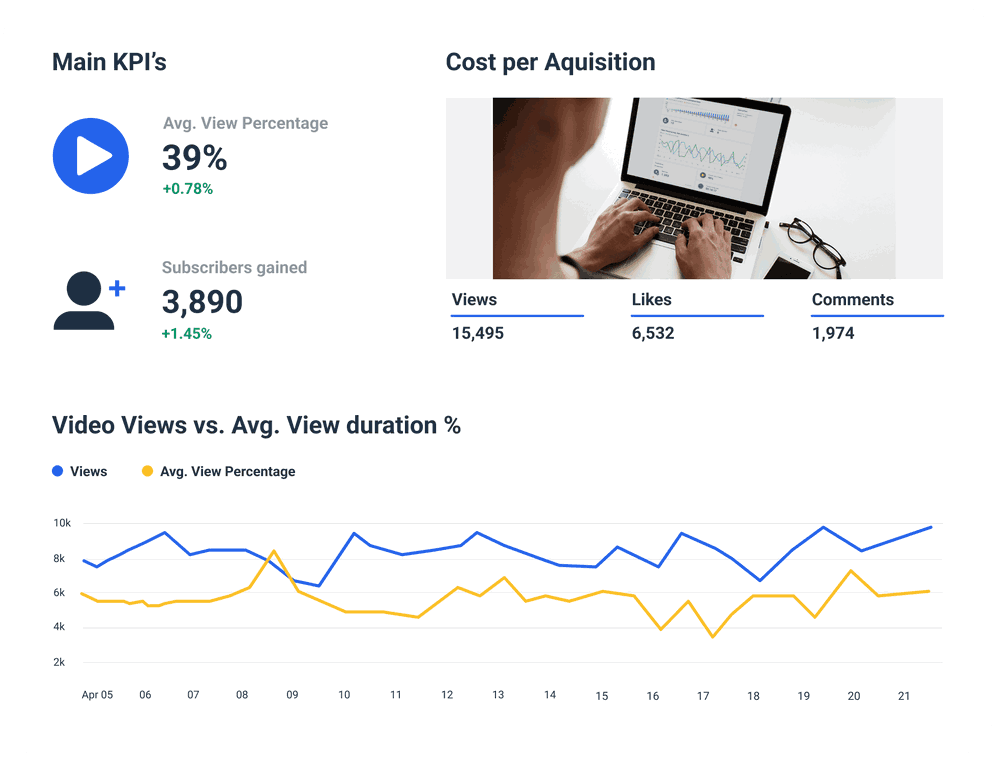
Find out about the audience watching your client’s YouTube videos. Get all your client KPIs in one place and transform them into actionable insights with Whatagraph. Easily visualize your audience growth, subscribers, interactions, engagement metrics, and more. Stay on top of your YouTube analytics with our easy-to-use YouTube reporting software.
Create Insightful Video Analytics Reports & Dashboards with Whatagraph's YouTube Reporting Tool
Automatically Collect YouTube Performance Data for All Your Video KPIs

YouTube Reporting Made Easy & Simple With Whatagraph
It can be hard to determine which YouTube metrics really matter. Your clients don’t have to do that anymore. With Whatagraph’s report, their YouTube report gives them only the data they need. This way, they can quickly see how their channel is performing and what changes they need to make.
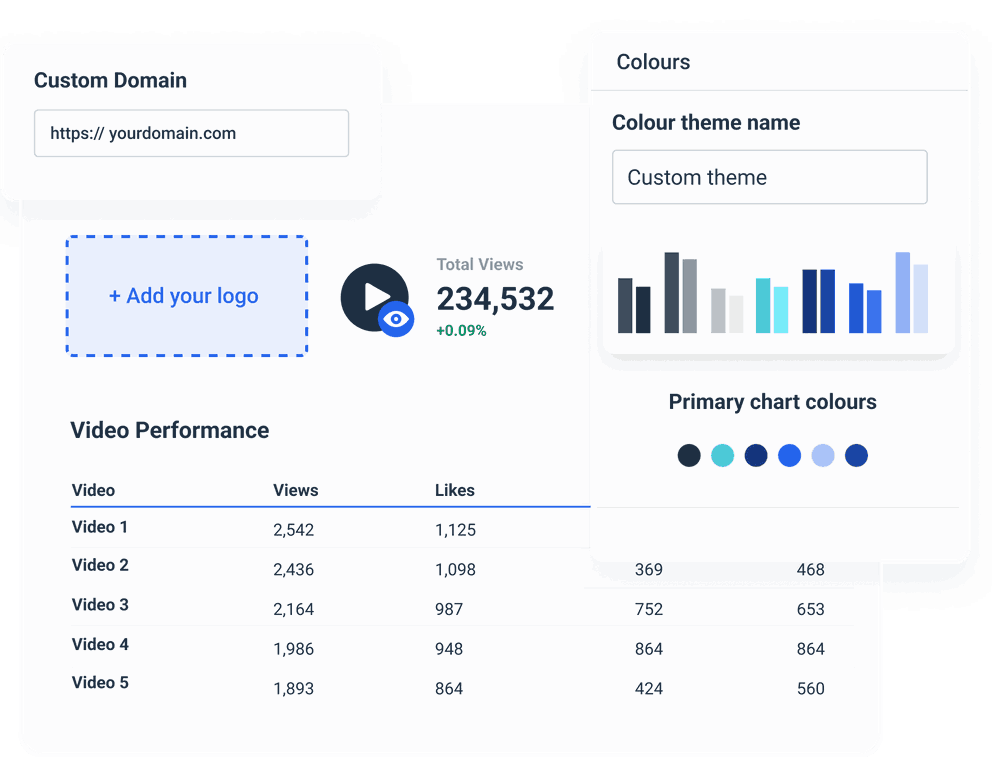
Create Custom YouTube Analytics Reports in Minutes
Customize and change everything about our reports and dashboards. Want to remove the Whatagraph logo? Poof, gone. Want to alter colours, fonts and overall report theme? 3, 2, 1, done. Want to change the domain? Click, click, delete. Want to track specific engagement metrics that are not supported by YouTube’s API? Build custom formulas and widgets.
All reporting features your agency needs


No credit card required
FAQs
All your questions answered. And if you can’t find it here, chat to our friendly team.
What are the best YouTube reporting tools?
What KPIs to track when using YouTube for marketing?
- Watch Time;
- Engagement;
- Shares;
- Views;
- Audience Retention;
- Subscriber Growth.
How to build a YouTube report with Whatagraph?
- Create a Whatagraph account
2. Connect your client’s marketing platforms
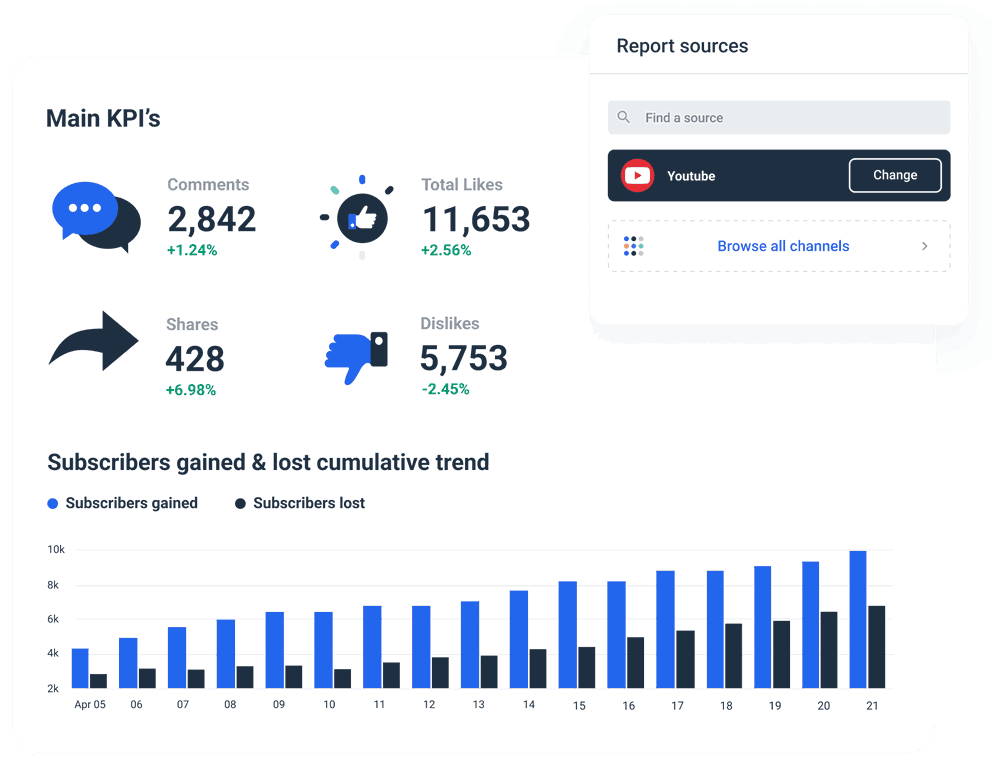
Connect the platforms you want to pull the data from. Besides YouTube, Whatagraph integrates with 40+ other marketing platforms, such as TikTok, Instagram and many others.
3. Create a template by adding pre-made widgets or creating it from scratch
It’s good to be loved! Our clients are not shy about expressing it.
I made a switch from GDS and Sheets for reporting to Whatagraph, and I am saving literal hours each week on performance report creation. Our small firm actually managed to onboard 2 new clients as a result of all the time we saved on managing data and reporting. The customer service is also really helpful and easy to reach.

Capterra verified review by
Mindaugas S., Marketing Consultant
Having active customer support to help fix any issues was a big contributor, but we also really liked the ability to save templates and connect sources to multiple charts/widgets at once without having to edit them individually. And having the grid layout is much easier to stay consistent with than the free form setup that Data Studio has.

Capterra verified review by
Nico T., Media Planner
The system has standard templates that are easy and fast to use. Also you can build your own report with lightning speed. It is very easy to use, has a lot of integration, and let get started very fast.

Capterra verified review by
Rasmus Bernt K., External Senior Management Consultant
We love Whatagraph - we would definitely recommend and our account manager is great! I love how easy this tool is to use, everyone on the team finds it much more user-friendly than other dashboards. Integration was easy, we sent some example reports to the team who duplicated these for us. We literally had to log in and send it to our clients!

Capterra verified review by
Stephanie S., Digital Director
We are showing our clients the work that we're doing for them and this is incredibly important for our clients ROI. They want to see results and having a tool like Whatagraph that can show data from virtually every source we use is hugely important.

Capterra verified review by
John S., SEO Strategist
The tool is easy to use; you do not need to have development resources. Even my junior project managers are capable of making campaign reports in minutes. There are a lot of pre-made templates you can use as well as many pre-made widgets.

Capterra verified review by
Erman E., Marketing Specialist
Really easy to connect data sources within the tool. The library of report templates has been helpful. The customer support team has been responsive to all of our needs. Our team enjoys the simplicity of setting up the reports and how the data is presented.

Capterra verified review by
Brent N., Director of Operations
Easy to create really beautiful graphs and reports which can help other team members to understand the most important takeaways. I especially like the automated report function, so I don't have to check on the same thing repeatedly.

Capterra verified review by
Orsolya S., Online Marketing Manager
Need more help with getting started?
We can set up your report campaign for you!
Ready for insights?
It's time to focus your time on the tasks that really matter, and let us worry about your marketing analytics. Start your free 7-day trial.
- Free for 7 days
- No credit card required
- Live chat support
- Cancel anytime
No credit card required