What are Lead Generation KPIs?
A lead generation key performance indicator – KPI for short – is a metric that you can use to assess the performance of your sales and marketing operations.
Having a clear understanding of your lead generation KPIs will improve your sales effectiveness and help you get the best results you can.
When we talk about lead generation, we’re referring to anything related to sales and marketing. This includes cold outreach, paid ads, SEO, and even your website performance.
Lead Generation KPIs to Measure Cold Outreach Success
1. Positive reply rate
Reply rate is a helpful metric, but it’s even more useful if you look at the positive reply rate.
To calculate it, use the formula:
(Number of positive replies / Number of total replies) * 100
For example, suppose you send a cold email campaign to 100 prospects that generates 20 replies. If 10 of those are people saying “Sorry, I’m not interested”, but you count it as a 20% reply rate, that won’t be an accurate picture of your campaign results.
A 10% positive reply rate gives you more helpful feedback than the total reply rate, as you can clearly see that 10% of your prospects felt there was value in your email.
You can use that information to start improving your prospect list based on what the people positively replying have in common.
This KPI needs to be tracked manually, as most cold email software won’t be able to determine the difference between a positive or negative reply.
2. Meeting booking rate
Your meeting booking rate tells you how many people you are booking meetings with your sales team compared to the total number of people you reached out to.
To calculate it, use the formula:
(Number of meetings booked / total number of outreach messages sent) * 100
If your meeting booking rate is high, it demonstrates that your email template, prospect list, and call-to-action are working in harmony.
But, if it’s low, it’s a sign that something needs to be adapted in your campaign.
Generally, it’s best not to ask for a meeting on your first outreach message. Instead, start a conversation over email or LinkedIn, and then once you’re talking, ask them to schedule a call on a booking system.
At the end of your campaigns, look back at your meeting booking rate to assess how successful you were.
3. Email Bounce rate
The email bounce rate tells you the number of emails that can’t be delivered. In most cases, it’s due to sending an email to a non-existent email address.
To calculate it, use the formula:
(Number of bounced emails / Number of emails sent) * 100
Your bounce rate needs to be below 3-5%, or you risk facing scrutiny from email service providers like Gmail and Outlook.
Data from analyzing 65+ million emails sent using QuickMail found that the average bounce rate for cold outreach campaigns is 7.5%, but you should be aiming for much lower than that.
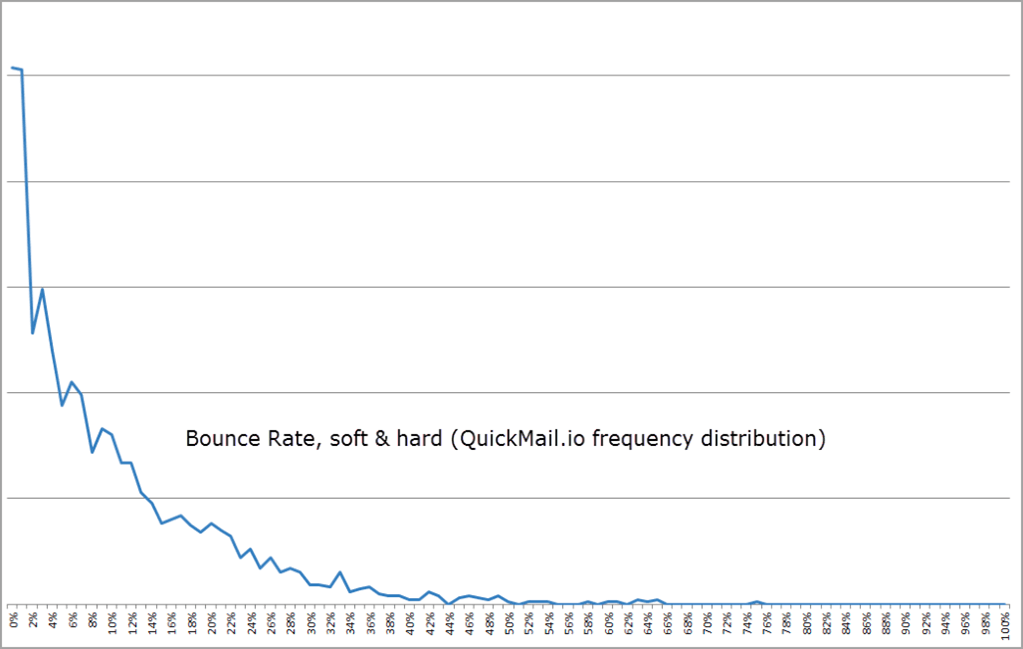
One effective way to bring down your bounce rate is by verifying the email addresses you include in your campaigns before reaching out to them.
Lead Generation KPIs to Measure Paid Ads Performance
4. Return on ad spend (ROAS)
Your Return on Ad Spend (ROAS) tells you many dollars you make for every dollar you spend on paid advertising. It’s an essential lead generation KPI to include in any marketing report that includes a paid activity.
To calculate it, use the formula:
(Revenue from ads / Amount spend on ads) * 100
For example, a Google Ads ROAS of $5 would mean for every $1 spent, you make $5 back.
Most good ad management platforms like Google Ads or Meta for Business will give you a clear breakdown of your ROAS, so you don’t need to worry about calculating it yourself.
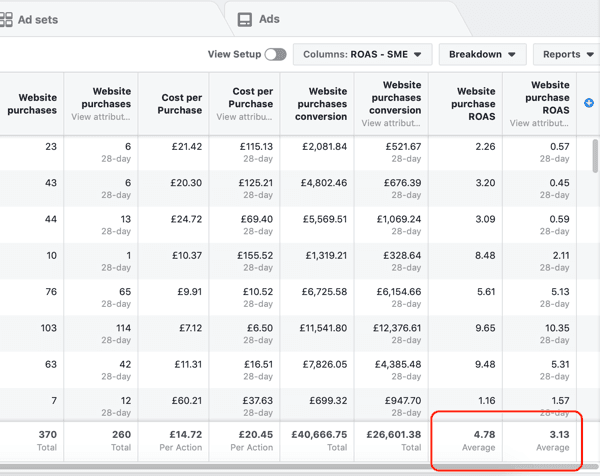
Source: Social Media Examiner
When you know your ROAS, you can start to scale your campaigns and predict how much you’ll make for every dollar spent.
5. Cost per click (CPC)
Your cost per click (CPC) is the amount you pay for every click on an advertisement that you’re running.
To calculate it, use the formula:
(Total spent on advertising / Total clicks tracked) * 100
It’s a helpful metric to track because you can use your CPC to reverse engineer how much you need to spend to hit specific lead generation goals.
For example, if you know you have a landing page conversion rate of 20%, you know that if you send 100 people to the page, you can get 20 sign-ups.
If your CPC is $10, you’ll need to spend $1,000 in order to get 20 people to take the action you’re looking for.
This is helpful when reporting back to your manager or CFO for budgets, as you can forecast your expected results.
6. Paid conversion rate
You need to know if your paid advertising is delivering a return on investment or helping you hit non-monetary goals you have set, like ebook downloads or free trials.
A simple way to calculate your paid conversion rate is with the following formula:
(Number of clicks / Number of conversions) * 100
Keeping track of this lead generation KPI is vital because it’s how you’ll analyze your results from different paid ad channels. If you’re running ads across multiple platforms at once, you can track each channel separately to find the most effective channels for your business.
Lead Generation KPIs to Measure SEO Performance
7. Number of organic clicks
If you’re investing in SEO and growing your organic traffic, this metric is crucial to understanding your performance.
You can easily track the number of organic clicks your website and key pages are getting using Google Search Console.
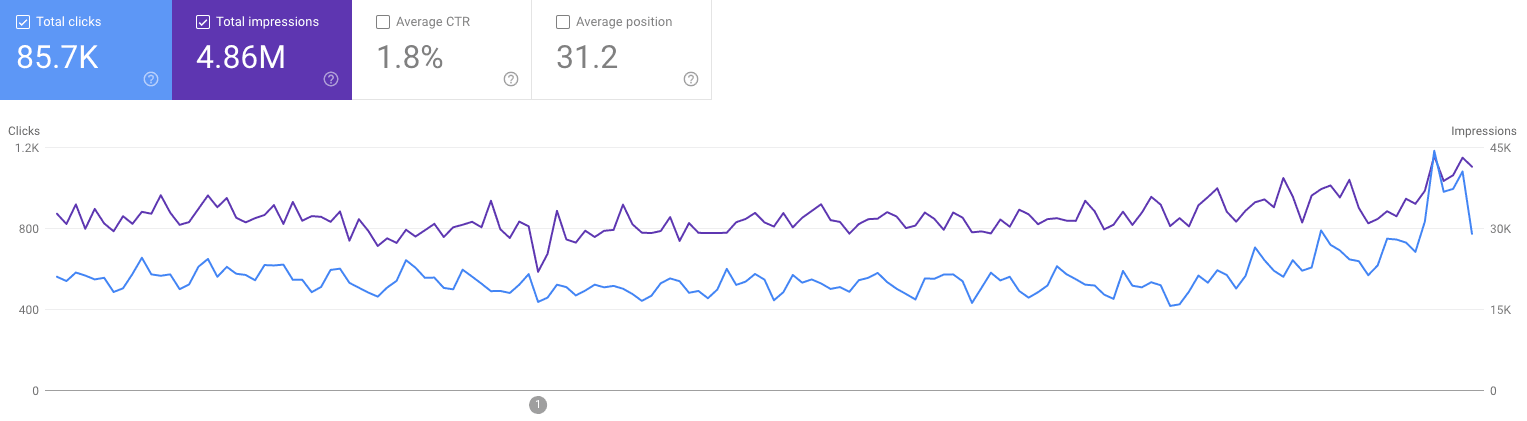
You’ll know if your efforts are paying off and be able to break down your organic clicks by date, keyword, page, and any other parameter you need to segment traffic by.
8. Average time on page
There’s no point in having traffic if your visitors aren’t engaging with your website content and sticking around.
Your average time on page tells you how long your visitors spend on different pages on your site.
It can be used to:
- See which content your visitors find most interesting
- Track which channels generate the most engaged visitors
- Understand your website performance
Most website analytics platforms, such as Google Analytics, will automatically measure this metric for visitors who opt-in to be tracked.
9. Organic conversion rate
Your organic conversion rate indicates whether the traffic you bring to your website is qualified for your product or service.
To calculate it, use the formula:
(Number of conversions / Number of organic visitors) * 100
You can track your organic conversion rate on a page-by-page basis to understand where your conversions are coming from.
If you see that one type of landing page is performing well, you can double down on that page format and create more similar pages to drive more conversions.
Lead Generation KPIs to Measure Overall Sales and Marketing Performance
10. Marketing qualified leads (MQLs)
Tracking the number of marketing qualified leads (MQLs) in your pipeline is key to understanding overall marketing performance. Utilizing effective sales lead tools can help streamline this process.
For example, you can set a target at the start of a quarter. Having a clear number means your team can work backward and reverse-engineer what they need to do to hit their target.
11. MQL to SQL conversion rate
Once an MQL has been passed on to your sales team, the next step is for your sales team to qualify the leads. Anyone that passes the test is referred to as a sales-qualified lead (SQL).
Your MQL to SQL conversion rate – and the ratio between MQLs and SQLs – is important because it indicates whether your marketing team is bringing in the correct type of leads.
To calculate it, use the formula:
(Number of MQLs / Number of SQLs) * 100
The higher this conversion rate, the better.
The best-performing teams will ensure sales and marketing are regularly communicating and sharing feedback about which type of leads are turning into SQLs. Your marketing team can then re-focus their efforts on attracting more people that fit the criteria for an SQL.
When your MQLs are handed to your sales team, it will be easy to convert them into customers.
12. Lead quality
Lead quality is a complex KPI to measure, but every B2B sales team needs to be tracking it in some form.
Only 56% of companies screen their leads for quality, but it’s an important step in understanding the success of your lead generation efforts.
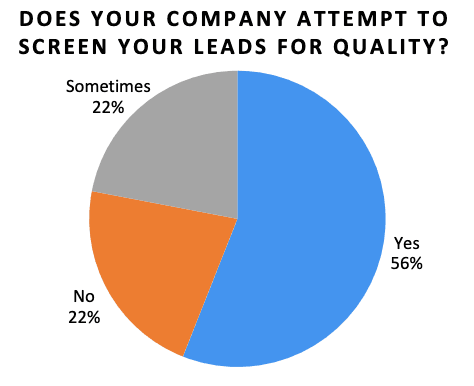
Source: Verse
The quality of your sales leads is a reflection of everything your sales and marketing team are doing, from your product positioning to the value propositions you’re using to promote your product.
If your marketing resonates with the right people, you’ll have a high score on your lead quality tracker.
On the other hand, if your positioning isn’t quite right or you’re targeting the wrong audience, you’ll see a lower lead quality and struggle to convert those people into happy customers.
13. Cost per acquisition (CPA)
Cost per acquisition (CPA) is the total cost to your business of acquiring a new customer.
To calculate it, use the formula:
(Total amount spend / Total conversions)
It’s a critical lead generation KPI to track. If your CPA trends upwards over time, it’s a sign that:
- Your marketing efforts aren’t targeting the right audience
- Your industry is becoming more competitive
- Your product isn’t as compelling to customers as it previously was
You can use this information to make updates to your product or service positioning, as well as optimize how you’re spending money to acquire new customers.
Every industry has a different CPA, so you need to work out yours by tracking it over time.
14. Average contract value (ACV)
Your average contract value (ACV) is the amount of money the average customer spends on your product or service.
The formula for ACV is:
Total contract value / Total years in contract
ACV helps you understand how much revenue each new customer brings to your business.
Once you have a figure, you can use this to set lead generation KPIs. For example, if your ACV is $1,200, you can set a target for your sales and marketing team to keep your CPA under $300 so you have a good profit margin on each new customer.
If your ACV is too low, your team will struggle to generate new customers profitably.
15. Customer lifetime value (CLV)
Customer lifetime value (CLV) is similar to ACV, but slightly different. ACV is looked at on an annual basis, but CLV is done on a lifetime basis.
To calculate CLV, use the formula:
(Annual revenue generated from a customer * Contract length in years)
Knowing your CLV gives you a full understanding of how much each customer spends with your business.
If you operate a business where customers spend more the longer they have been a customer, then it’s going to help you optimize your marketing spend. For example, if a customer typically spends $1,000 in year one, but that doubles in year two of being a customer, you can afford to pay more to acquire new customers than the first-year CLV suggests.
Some advertising platforms also allow you to bid based on your CLV. This means you can run ad campaigns and optimize your budget to acquire customers at a lower cost than your CLV.
Wrapping Up
Your lead generation KPIs are key to understanding if your sales efforts are paying off and generating results.
The best way to track your lead generation KPIs is in a central sales team dashboard. You track each KPI over time, and everyone can easily see if you’re on track to hit your targets, and if not, adjustments can be made.