Yet, we understand if you’re feeling overwhelmed. There are way too many KPIs, different channels to monitor, and different periods of time to report on. Here is a clear breakdown of some of the most common KPIs you should be tracking by marketing channels, c, whether you work in-house as a marketer or in an agency capacity for your clients.
Top 5 Marketing KPIs
Whether you launched Facebook Ads, experimented with a new lead nurturing campaign, or evaluated your strategy’s progress at the end of the quarter, you’d benefit from tracking these KPIs.
1. Return on Investment
In short, ROI will tell you whether or not your hard work, investments, and campaigns are paying off. It’s a measurement that highlights the size of the profit you generated against the investments you made in time and cold, hard cash.
Digital marketing agencies use this metric to see how their work affects the company’s net income or the bottom line on a company’s statement.
Marketing ROI compares the revenue generated by specific marketing or ad campaigns to the costs of running them.
2. Customer Lifetime Value (CLV)
It emphasizes the value of a single customer to your company as a whole. In other words, CLV measures the revenue/gross profit generated by a single customer over the course of their relationship with you.
Tracking this KPI will allow you to:
- Improve and increase your profits;
- Identify opportunities to increase customer lifetime value;
- Prevent customer attrition;
- Calculate the size of appropriate marketing investments.
You can use a good reporting tool to get historical and real-time data on this KPI. Whatagraph, for example, allows you to connect all of your marketing channels at once to see how CLV performed in the past versus now. Begin by identifying the campaigns that generate the most qualified leads using our pre-made marketing reporting template.
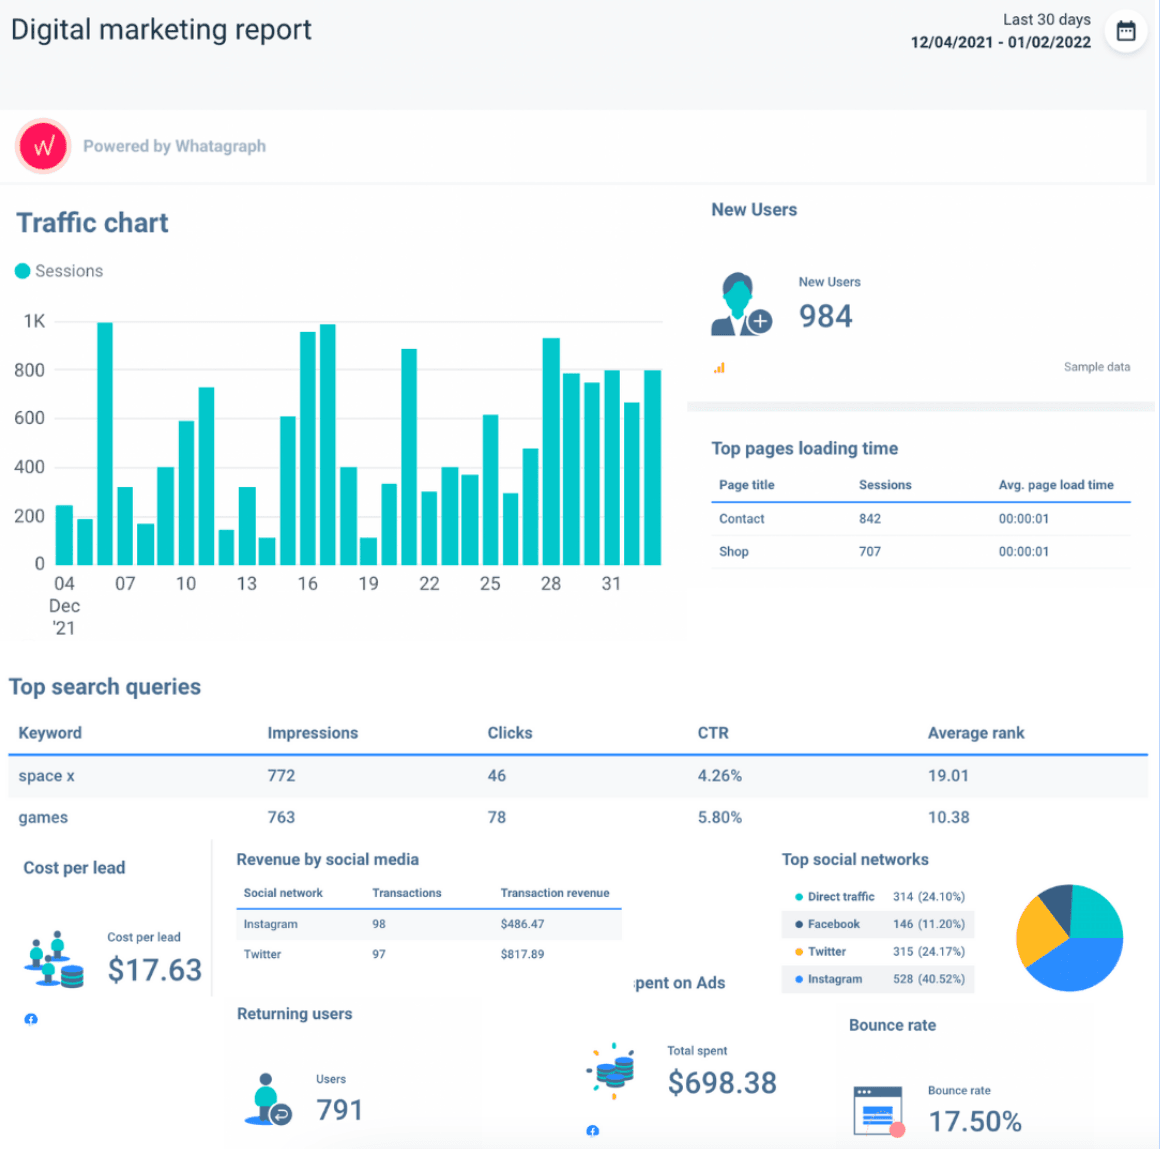
3. Conversion Rate
Simply put, conversion rate tells you whether or not a user completed an action you wanted them to do. It is usually measured in percentages; the higher the percentage, the better your campaign performed.
Those completed actions could be:
- A user lands on your pricing page and fills out a form to book a demo;
- A visitor starts your product’s free trial;
- A free trial user turns into a paying customer;
- An email subscriber opened your product newsletter;
- A customer purchases an item from your eCommerce store. And many other actions.
The conversion rate doesn’t care about outputs and processes. This KPI is all about the outcomes and results. No matter if you track website, social media, email or form conversion rates.
Tracking this KPI is beneficial to marketing agencies because it demonstrates the precise concrete output of their work.
Not to get overwhelmed by all this complex data, try out our performance report. All the reports you see in Whatagraph are customizable and adjustable. So, if you see irrelevant KPIs - delete them in one click.
Some conversion stats in the marketing agency industry :
- The average paid search conversion rate is 6.6%;
- The average email conversion rate is 2.3%;
- The average organic search conversion rate is 2.3%;
- The average referral conversion rate is 3.6%
If you’re falling behind when you compare your conversion rate with these industry benchmarks, you’ll know where to direct your next marketing efforts.
For example, Kyle Sobko of Sondercare found out that they are actually doing amazing compared to the benchmark in their industry (healthcare), but only when his company set up proper conversion goals first.
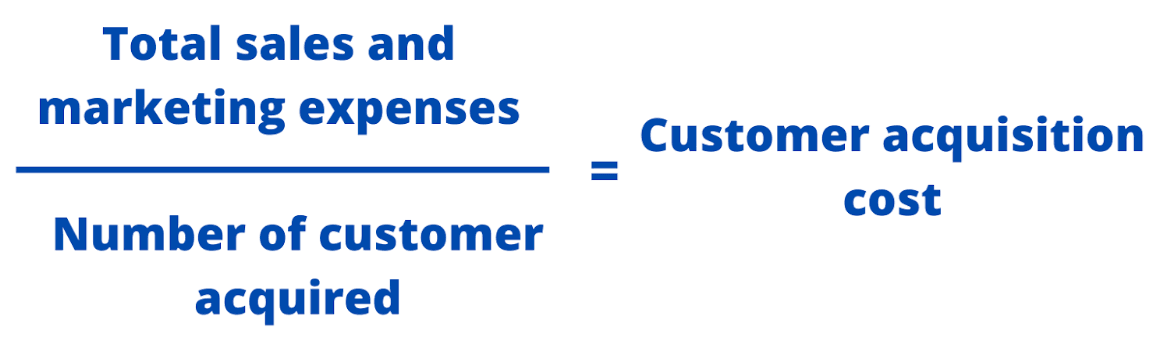
4. Customer Acquisition Cost
How much money do I need to spend to get one more customer? - sat quietly pondering marketer asked himself in his mind. Well, we'll tell you!
First, definition. TechTarget defines CAC as ‘the fee associated with convincing a consumer to buy your product or service’.
Second, determine the time period for which you want to analyze the scope of your efforts and costs. This includes:
- The platforms and tools you are using for marketing;
- Employers;
- Advertising;
- Marketing distribution.
Once you have this data, you can use the following calculation or a reporting tool to do it for you.
CAC tracking and monitoring are critical for ensuring that your marketing activities are worthwhile and that you are not wasting money. If CAC exceeds LTV, you are in the red and the future is not looking so great.
According to Angela Blakenship of BestNeighborhood, tracking your CAC is something you should do from the very beginning of your business. As she says, once it spirals out of control, the damage control will cost even more time and money.
5. Customer Satisfaction Score
You’ve got all these KPIs tracking revenues and sales, but business is not just about selling and profit. It’s about people. No matter the type of business, you need to measure your customer satisfaction rate to learn how your customer feels about your product or service.
CSAT (customer satisfaction score) is a metric to showcase how happy your customers are.
To calculate your CSAT score, multiply the number of satisfied customers (those who rated you 4 or 5) by the total number of responses. For example, if 57 of your 100 responses are rated 4 or 5, your score is 57.
KPIs By Marketing Channel:
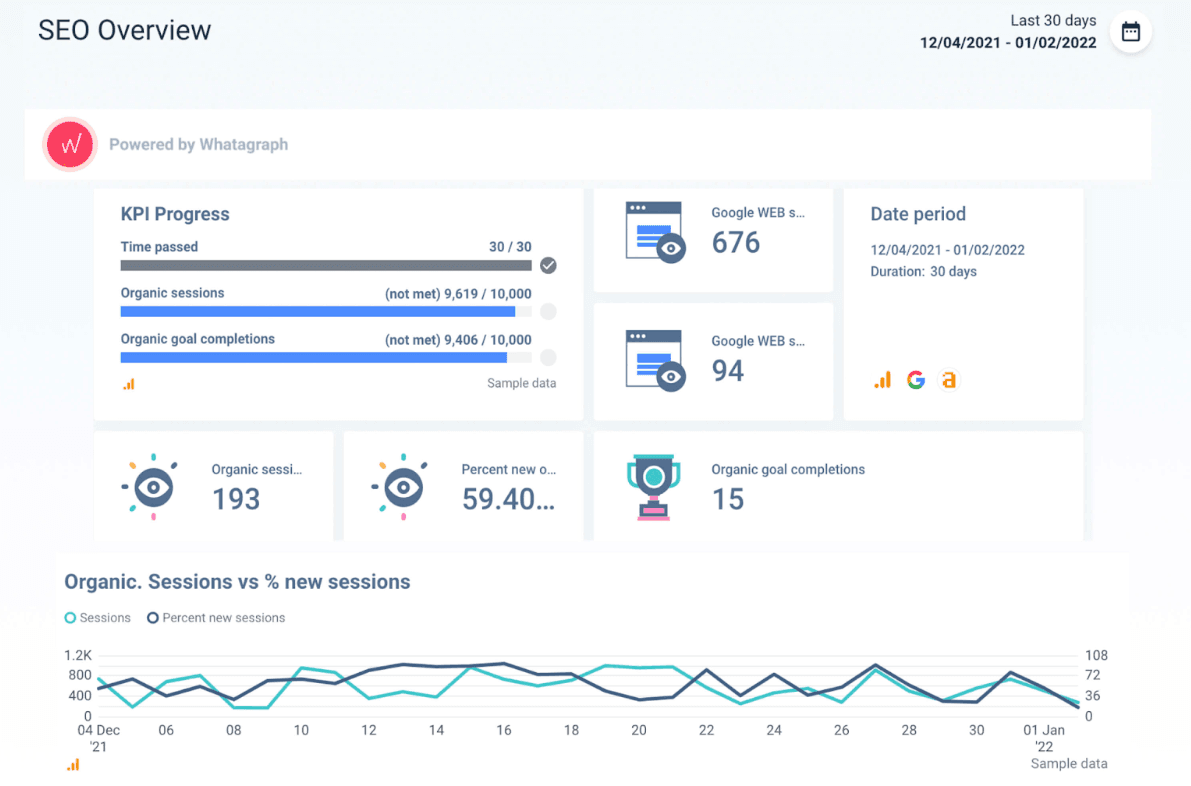
SEO KPIs
Digital marketing agencies try their best to rank their clients' blogs or pages higher to improve their traffic. If they rank in the top 5, they have a 67% higher chance of receiving a click and potentially - a sale from new customers.
Here are some of the most important SEO and website KPIs, formulas and reasons to track them:
1. Organic traffic
Definition
You generate organic traffic when a user clicks on the link to your website or lands on any of the landing pages from an unpaid source.
Why tracking it is important?
Monitoring organic traffic will tell you how well you target specific audiences and use keywords. The higher the traffic, the better you answer their questions and provide solutions to their problem. The more organic traffic, the more benefits for your business, including increased brand awareness and new customers.
How to track it?
If you are using Google Analytics, go to Acquisition → All Traffic → Source/Medium → Select Organic Traffic. Or, you could skip all these steps and open a Whatagraph account to get all this data with one click automatically. Here is a modern KPI Google Analytics tool template for it, just for you!
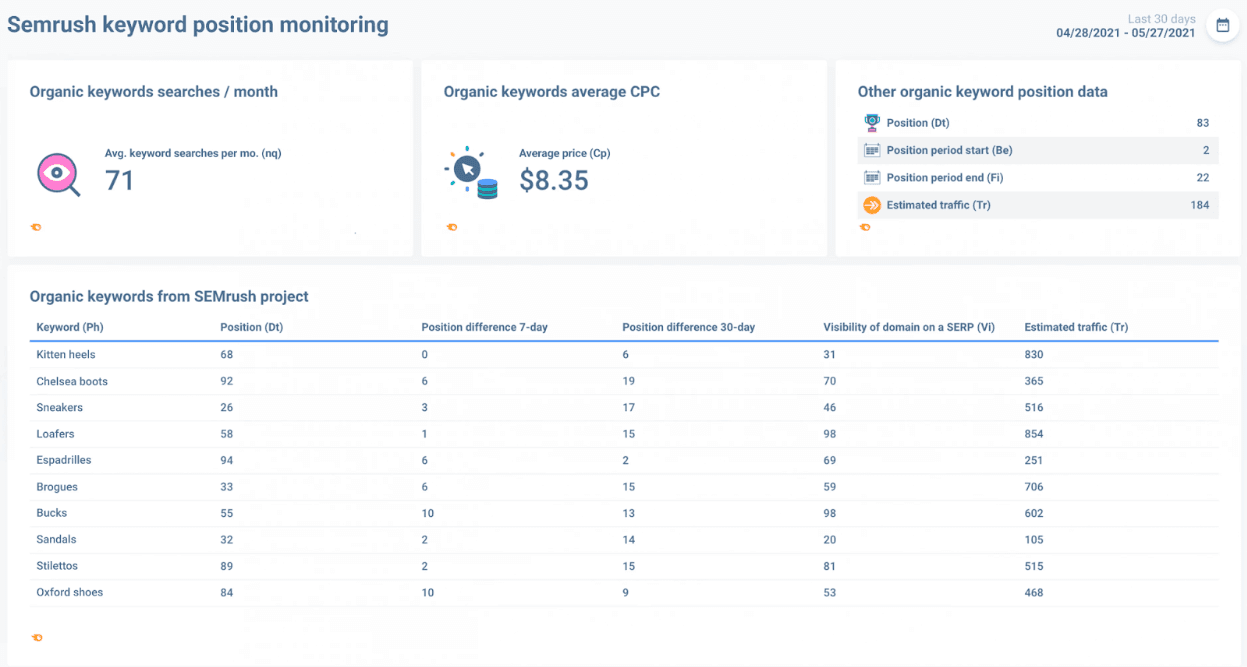
2. Keyword rankings
Definition
Keyword rankings in SEO refer to the position of your page on the search results page for a particular keyword search.
Why tracking it is important?
Monitoring this KPI will give you advanced analytics into how your keyword and page associated with that keyword perform in Google search results. The higher the position in SERPs, the more traffic you can get. This is one of the most useful marketing metrics to track because a bump in keyword ranking can significantly affect your bottom line.
How to track it?
The easiest way is with a tool such as SEMRush integrated with Whatagraph. Connect your accounts, and learn which of your keywords are ranking and which ones aren’t.
3. New backlinks
Definition
In a nutshell, a new backlink is when another website links to yours. This is one of the most important metrics for your SEO strategy and overall inbound marketing. More backlinks mean that your website is considered trustworthy by Google and other search engines.
Why tracking it is important?
New backlinks tell you which new websites gave a link to yours and to which pages. The more backlinks you have pointing to a certain page, the easier it is for that page to rank well in search engines. Better rankings = more website visitors and more conversions.
How to track it?
You can track the current status of your new backlinks through Ahrefs or SEMrush.
Lost backlinks
Definition
Lost backlinks indicate that something happened at the other website that caused the editor to remove it, or that a page was deleted - in any case, it's a reason for you to conduct research to determine what happened and how to re-establish the link.
Why tracking it is important
Lost backlinks may result in decreased performance for the pages to which the links were directed and your entire website. If you start to see your links dropping off, someone might be running a black-hat SEO campaign against your - so it’s worth keeping tabs on this metric.
How to track it?
Get a reporting tool like Ahrefs or SEMRush. You won’t be able to measure it manually (Yup, just like any other SEO KPI mentioned above).
Facebook Ads KPIs
Facebook ads KPIs evaluate the performance of your campaign to determine whether or not your Facebook ads are producing the desired results. Track the following KPIs:
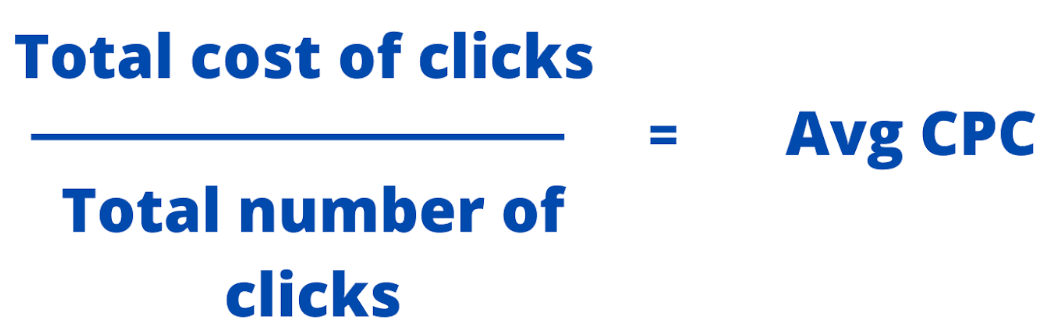
1. Cost per click
Definition
CPC is the average cost to you for each ad click.
Why tracking it is important?
Simply put, to decrease the cost spent on clicks whilst increasing the click-through rate. To do that, monitoring CPC will help identify which keywords, ads and copy perform best in the ad campaign.
How to track it?
Manually:
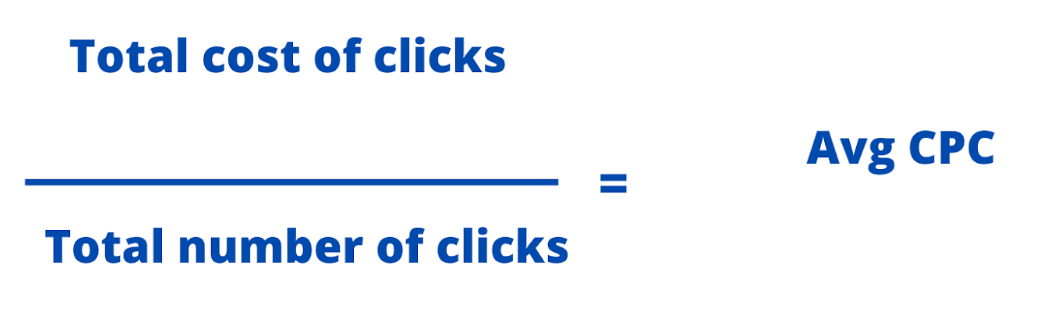
Or you could use a tool such as Whatagraph to create a Facebook Ads dashboard.
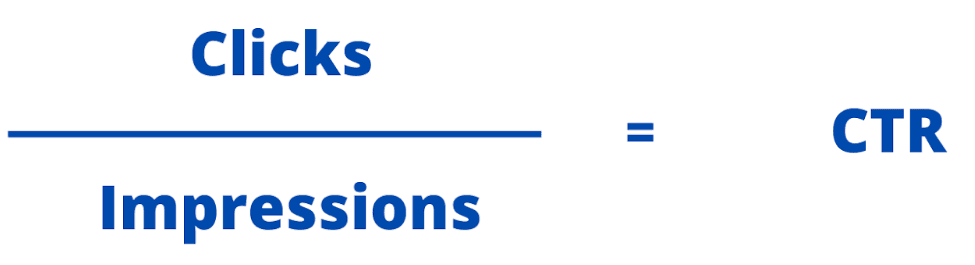
2. Click-through-rate
Definition
CTR tells how many times your ad was clicked on. It is usually measured in percentages and shows how much people are inclined to click on your ad/link after seeing it.
Why tracking it is important?
Tracking this KPI will help to determine if your ad copy attracts people’s attention enough to be clicked on. Sometimes there is a need to alter the copy, the visual, or the offer.
How to track it?
Manually:
Or you could use a tool such as Whatagraph and create a Facebook Ads dashboard.
3. Cost-per-purchase
Definition
Cost per purchase or CPC is the KPI to tell you how much you pay for a single click you get on your Facebook ad.
Why tracking it is important?
Tracking CPC will prevent overspending. Depending on the CPC, you can choose to improve ad efficiency by increasing or decreasing the spending, or changing the creatives for better performance.
How to track it?
Manually:
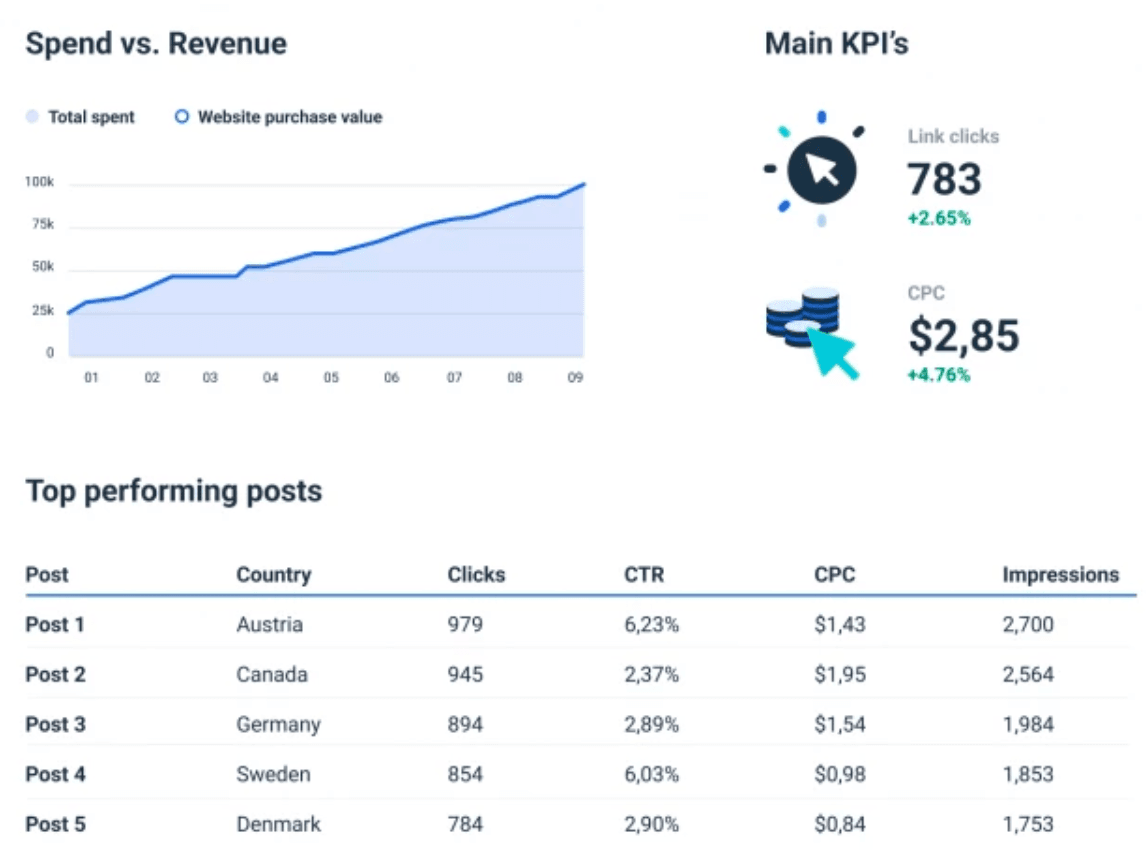
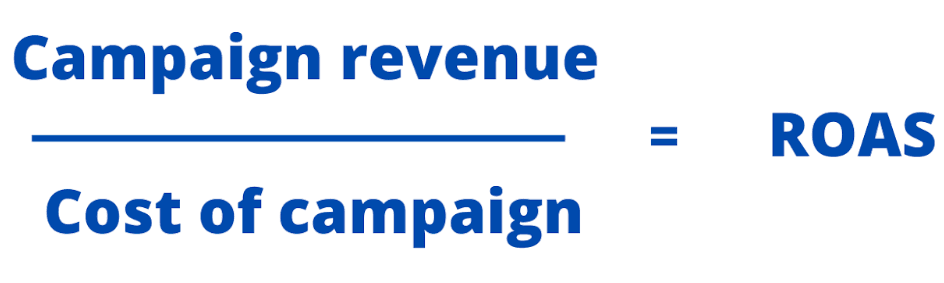
4. Return on ad spend
Definition
ROAS is a key performance indicator that shows how much money you make from your advertising campaign. This is the metric to look at if you want to know how well your Facebook ads are performing.
Why tracking it is important?
To find out whether your Facebook ad campaigns are generating any revenue, you need to monitor ROAS. It also helps decision-makers focus marketing spending by determining which ad campaigns are most effective.
How to track it?
Manually:
By using Facebook Ads manager/Facebook Business suit/Facebook reporting tool.
Google Analytics KPIs
Do you know how your website is performing? If you are lost in all these metrics and don’t know where to start, here is a list of beneficial website KPIs:
1. Average session duration
Definition
Average session duration shows you have much time a visitor spent on your website. The more, the better, naturally. The more time they are online with you, the better the lead conversion rate and the more money in the bank.
Why tracking it is important?
Tracking session duration will provide insights into the time user spend on your website and how they interacted with it - whether it was just a visit or a landing page conversion, for example.
How to track it?
Manually:
With a tool: A Powerful Google Analytics /GA4 Reporting Tool for Agencies
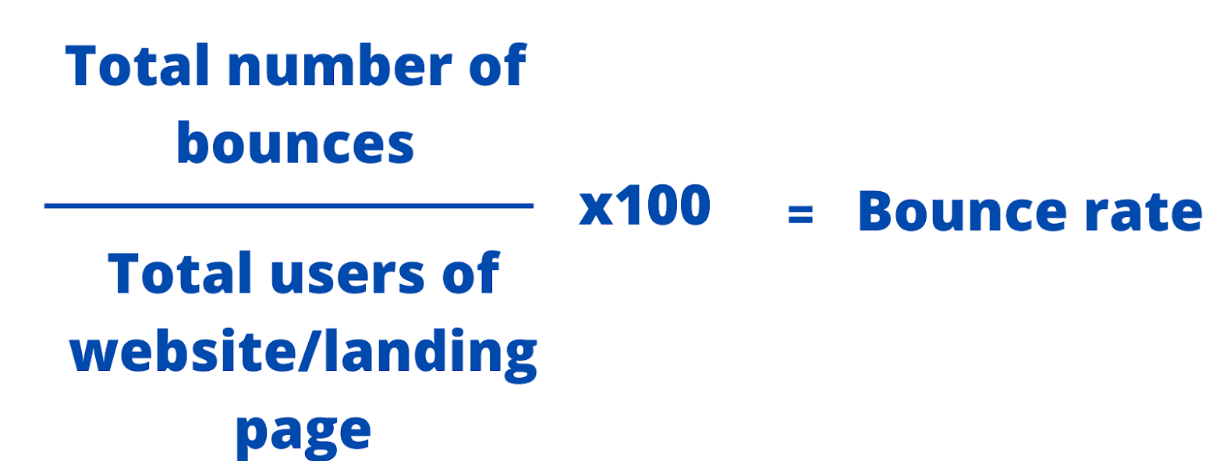
2. Bounce rate
Definition
Bounce rate is a key performance indicator that measures the percentage of visitors who leave a website without taking any action.
Why tracking it is important?
Bounce rate tracking can help you learn how users interact with specific pages on your site. This allows you to make optimization and marketing decisions based on whether or not visitors engage with the page. Bounce rate is one of the most important marketing key performance indicators because it can show you if there are serious flaws in your funnel that need your attention.
How to track it?
Manually:
With a tool: A Powerful Google Analytics /GA4 Reporting Tool for Agencies
3. New vs. returning visitors
Definition
It is what it sounds to be. New visitors are when a new user landed on your page for the very first time. Returning visitors are users who have already visited your site at least once.
Why tracking it is important?
Tracking new visitors tells you how well your marketing experiments and initiatives are working and whether or not they are efficient enough to attract visitors to your blog or other places.
If you get a high number of new visitors, that means your campaigns are working and new people are coming in from organic, paid ads or platforms like LinkedIn or Facebook.
If you get a high number of returning visitors, that could mean that they found you elsewhere, used different channels, etc
How to track it?
There is no formula to manually calculate neither new nor returning customers. It’s preferable to do it with a reporting tool.
Email Marketing KPIs
Email marketing plays an important role in the marketing strategy and spreading awareness of your product. Here are the KPIs for email marketing you should consider tracking:
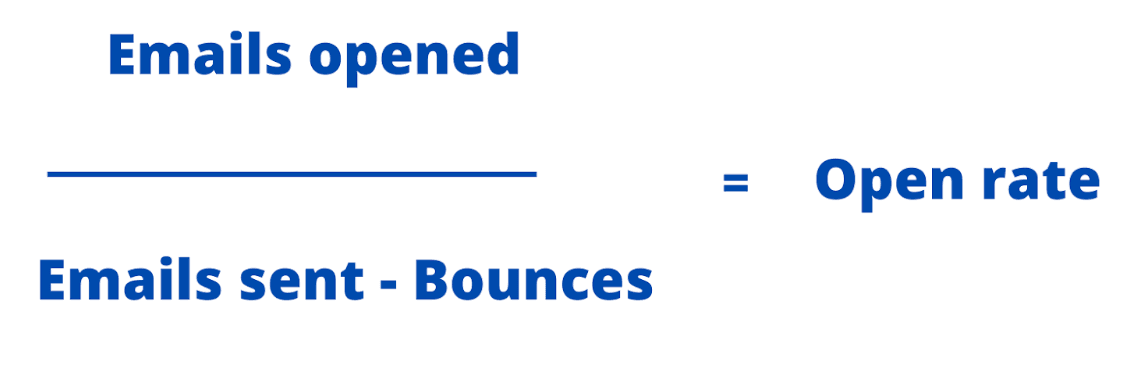
1. Open rate
Definition
The open rate is an email marketing KPI that indicates how many people clicked and opened your email. In other words, it calculates the average percentage of email recipients who open a sender's email message.
Why tracking it is important?
Open rate highlights the quality of your CTA and headlines. The lower the open rate, the less effective your headlines are.
How to track it?
Manually:
If you want to deep dive into these metrics we have an entire article dedicated to kpis for email marketing.
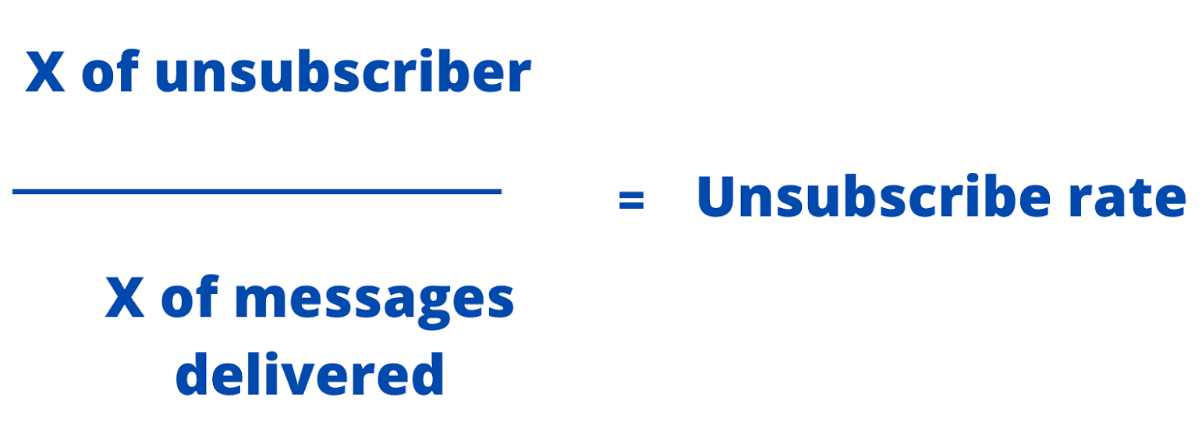
2. Unsubscribe rate
Definition
The unsubscribe rate is a key performance indicator that shows how many people unsubscribe from your emails. In other words, the unsubscribe rate is a metric that indicates the percentage of users who unsubscribe from a mailing list following an email campaign.
Why tracking it is important?
A high unsubscribe rate might indicate that your emails aren’t relevant to your audience or that your copy and offer are low quality. Try experimenting with new content, visuals and CTAs.
How to track it?
Manually:
3. Click-to-open rate
Definition
Click-to-open rate or CTOR is a less commonly known email marketing metric that shows the ratio of unique opens to unique clicks.
Why tracking it is important?
The benefit of tracking the CTOR is clear - the % gives a clear overview of your email marketing campaign and its performance.
How to track it?
Manually: Number of Emails Read / Number of Delivered Emails × 100 = Email Open Rate.
With a tool: Email Monitoring Software
Digital Marketing KPIs
Every digital marketing strategy is different trying to achieve different goals. Here is a list of top digital marketing KPIs that are used across the board in most agencies:
1. Customer lifetime value
Definition
As mentioned earlier, CLV emphasizes the value of a single customer to your company as a whole.
Why tracking it is important?
Tracking this KPI will allow you to improve and increase your profits and prevent attrition.
How to track it?
Try the marketing reporting template to spot CLV trends and current status easily.
2. Marketing qualified leads
Definition
The marketing qualified leads is the stage when the marketing team identifies a lead/customer that fits the required criteria and then is handed to sales.
Why tracking it is important?
A solid performance in this KPI will demonstrate to the client that your advertising strategy is effective and that you are generating revenue for your customer's business.
How to track it?
Try the marketing reporting template to easily spot MQLs as opposed to sales-qualified leads (SQLs).
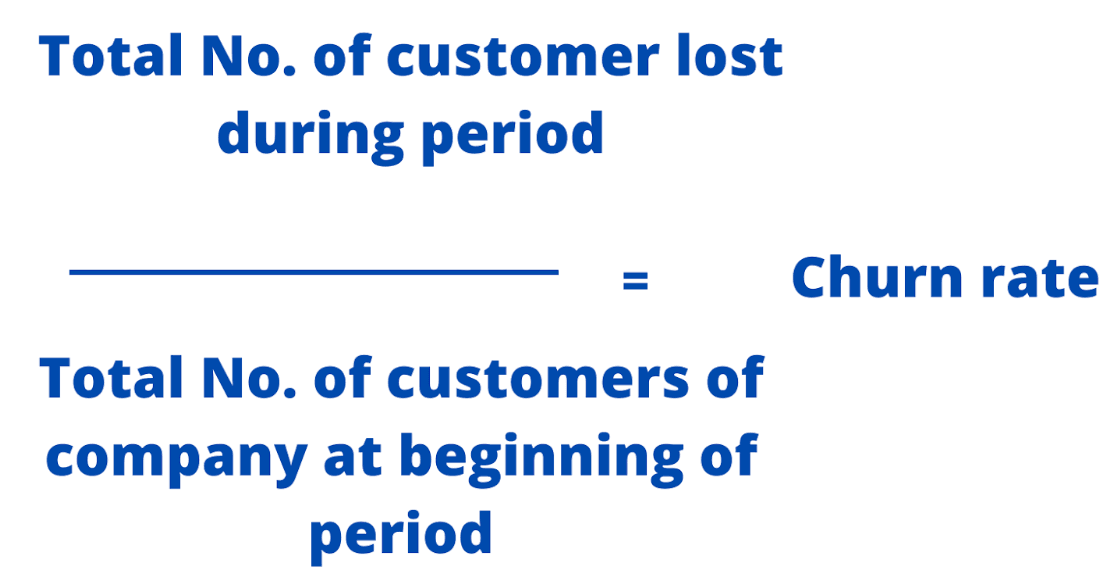
3. Churn rate
Definition
The churn rate is the percentage of users who stopped purchasing your product during a specific time period. It could imply that customers or subscribers who purchased a subscription from you cancelled or did not renew their subscription during a specified time period.
Why tracking it is important?
This KPI tells agencies about current customer behaviour; Helps prevent revenue losses; Assists in measuring marketing expenses.
How to track it?
For early startups and SMB-market companies, a good annual churn rate is between 10% and 15% in the first year.
To calculate the customer churn rate, divide the number of customers you lost during a set period by the number of customers you had at the start of that period.
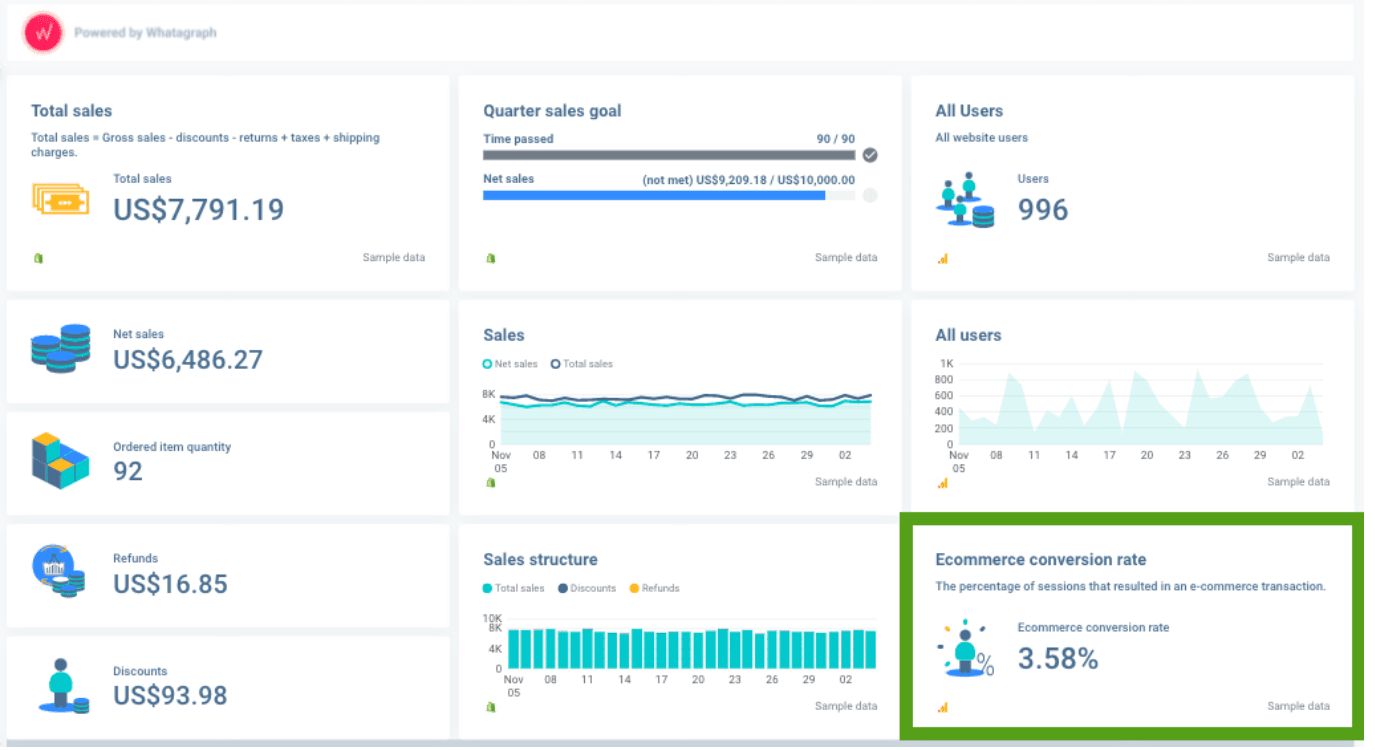
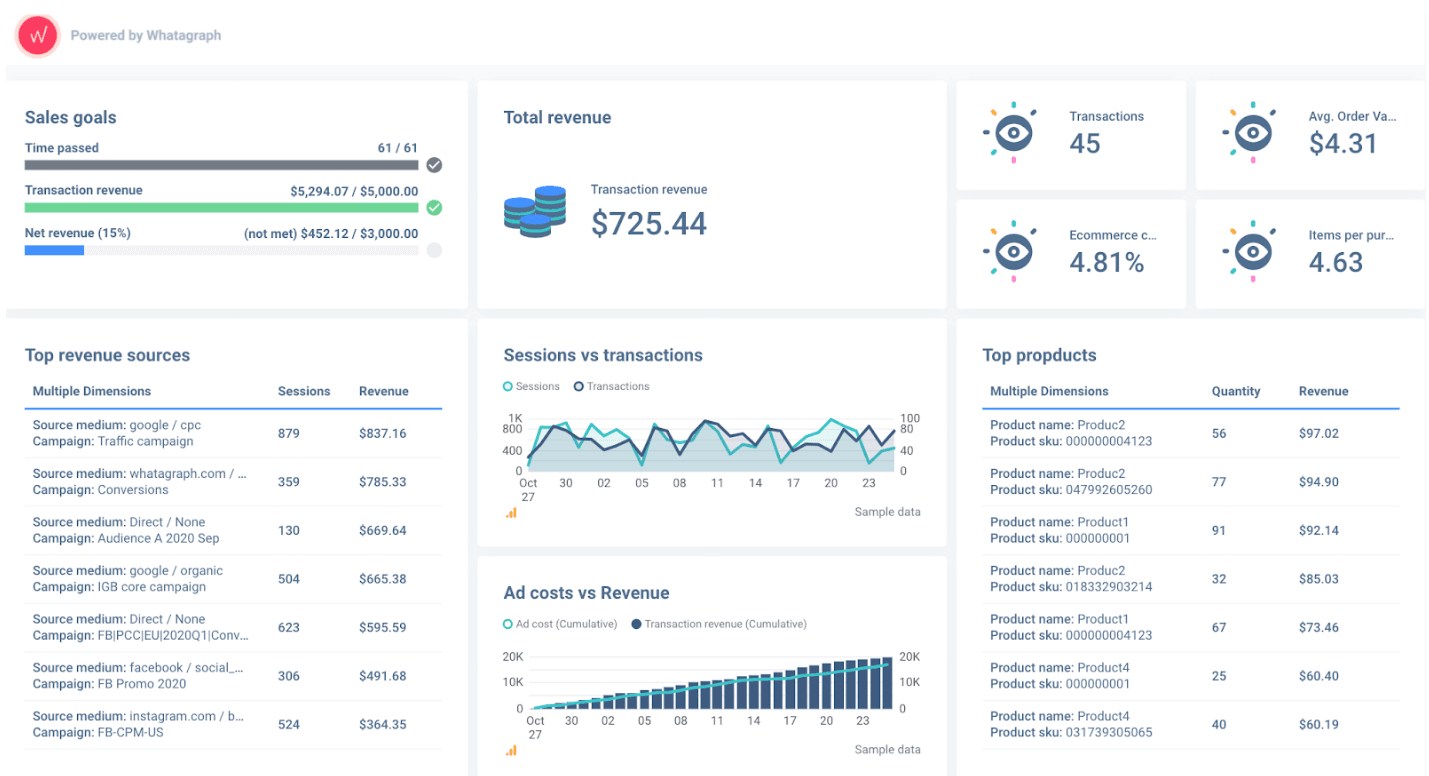
E-commerce Marketing KPIs
Ecommerce marketing KPIs assess how well a company is meeting its organizational objectives.
This means that monitoring eCommerce KPIs will enable the company to make better decisions regarding revenue, branding and marketing, and so on. Here is a list of the most important ones:
1. Website traffic
Definition
Website traffic is the KPI that tracks the volume of people who visit your site. Different from organic traffic, website traffic tracks ALL types of traffic (paid, direct, email, display, social, referral)
Why tracking it is important?
By tracking website traffic, you can easily learn about the demographics of visitors who come to buy your products; You can easily discover the source they come from; You can easily identify which pages convert the best.
How to track it?
The best and most efficient way is to use an eCommerce reporting tool to connect all your marketing channels and pull accurate data. If you need more help on how to choose the right kpis for your ecommerce business, we have an entire article dedicated to ecommerce kpis.
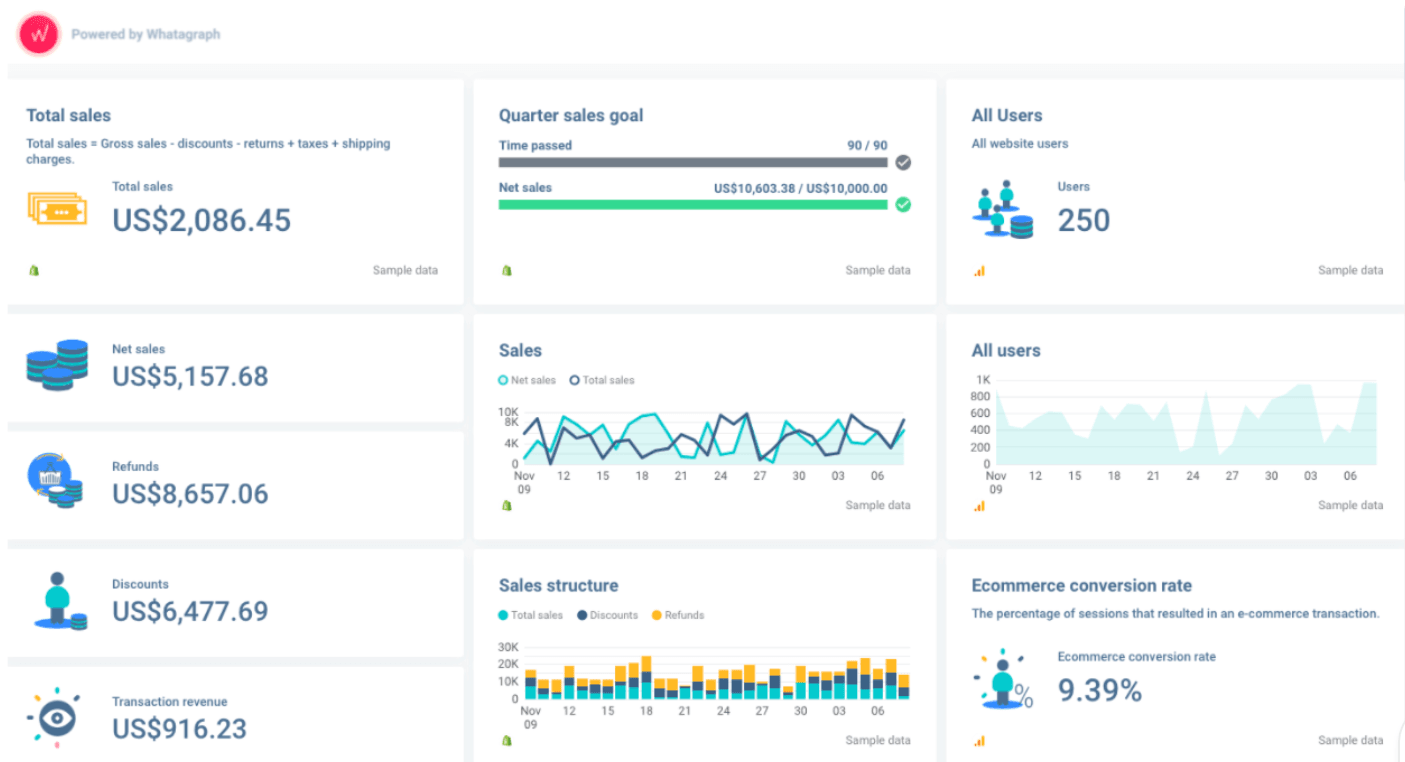
2. Total revenue
Definition
Total revenue is a metric that shows how much your client’s business generates.
Why tracking it is important?
Monitoring total revenue will give an overview of how much money your business is generating and whether that amount can cover all the expenses.
How to track it?
To measure total revenue, you must add ALL your expenses and divide them into the goods sold. It’s a pretty complex KPI, so finding a good reporting tool is recommended to avoid making any human errors. Instead of tracking minor metrics like cost per lead, this value will give you a global overview of cash earned.
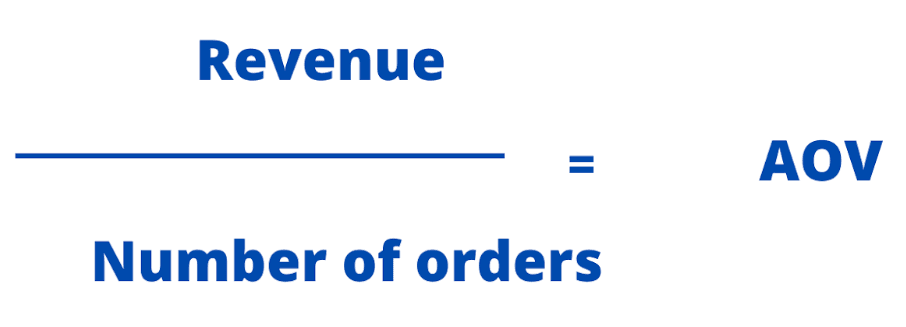
3. Average order value
Definition
AOV tracks the average amount a customer spends on an order.
Why tracking it is important?
The benefits of tracking average order value include: learning about customer satisfaction, buying habits; improving profit margin and customer retention rates.
How to track it?
Manually:
With an automated e-Commerce reporting tool.
Content Marketing KPIs
Analyzing content marketing KPIs help to write better content and ensure that the content provided appeals to the target audience. To learn if your audience loves your content, take a look at the status of these KPIs:
1. Time on page
Definition
Time one page shows how much time a user spends reading your content and engaging with a page.
Why tracking it is important?
If the time on the page is low, that means that your content might not be interesting enough to your readers. Take advantage of this KPI and learn from it so you can optimize your content accordingly.
How to track it?
It is impossible to measure it manually as you won’t have the opportunity to stalk your readers with a timer. That’s just creepy. Better get a tool that tracks this data legally.
2. Page per sessions
Definition
Page per session tells how many pages a user visits in one go.
Why tracking it is important?
By tracking user experience on your website, you can learn what attracts their attention: specific CTAs, other blog pages or landing pages. This way, you can determine what to create more of and what to completely remove from your site. In most cases, improving your internal linking will do the trick to improve this metric.
How to track it?
To track your pages per session, you’d need to get a tool like Google Analytics, SEMRush or Whatagraph.
If you’re a content marketing manager or just want to better understand the most important metrics we put together an entire article about content marketing KPIs.
Social Media KPIs
1. Reach
Definition
Reach - this KPI measures the number of people who have seen your content piece, an ad or a post, since it went live.
Why tracking it is important?
It provides valuable insights into how many new unique individuals stumbled upon your content. It highlights your ad or a post-performance and gives data on your client’s audience, demographics and size.
How to measure it?
To measure it, divide reach into total followers and multiple 100x.
2. Engagement
Definition
Engagement measures your client’s audience behaviour and actions taken about the post. This could be: liking, commenting or sharing.
Why tracking it is important?
High engagement rates show that the content you provide to your client’s audience resonates with them.
You can also gather historical data to learn what they prefer to see and optimise your strategy accordingly.
How to measure it?
Likes + Comments + Shares / Followers × 100
If you want to learn more about social media metrics, we have a full article on social media KPIs.
Website KPIs
1. Traffic by Source
Definition
Traffic by the source is a KPI that identifies the place from which internet users found your site. It could be from a direct, search or referral source.
Why is tracking this website KPI important?
Tracking this KPI will assist you in determining where significant traffic changes are coming from and assessing the effects of various marketing channels and campaigns.
How to track it?
To track traffic by source, use this Google Analytics report template to get live and real-time data.
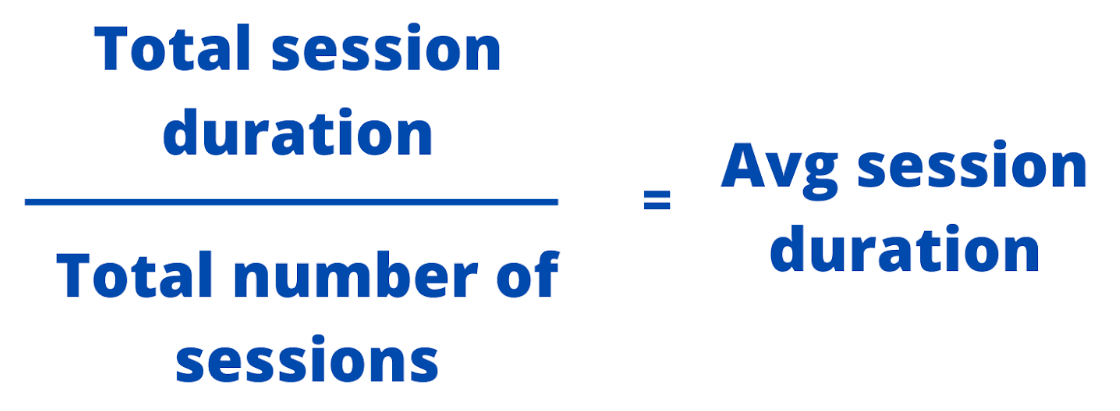
2. Average Session Duration
Definition
Average session duration measures the average time a user spends on your site.
Why tracking it is important?
Tracking average session duration can help you learn and understand your client’s audience more. What content keeps their attention the most, and what do they prefer to read.
How to track it?
average session duration = total session duration / total sessions
If you want to learn more, check out our article about website kpis.
Conclusion
Marketing KPI tracking and monitoring may be the most important aspect of running marketing campaigns and developing strategies. Whether you're launching Facebook ads or new email campaigns, finding the right metrics to track your progress is critical. The KPIs provided in this blog are the most commonly used ones.
You need a reliable marketing reporting tool if you’re looking for an intuitive and modern way to track your marketing KPIs (for yourself or your clients). Try Whatagraph today for free!