What is a weekly marketing report?
A weekly marketing report is a document marketers use to collect data, monitor performance, and generate actionable marketing insights on a weekly basis. Marketing teams often use weekly reports as a status check for ongoing campaigns or published content. For this reason, weekly reports should prioritize important metrics such as traffic and the number of leads.
Why weekly?
The weekly timeframe of these reports ensures there’s no breakdown in campaign performance, which could affect a whole month’s progress if left unchecked.
If you can’t see a day-to-day improvement on your channels, a weekly summary can give you more context and help with future decisions.
Weekly insights are especially important in marketing reporting, where data can change daily, and having a bird’s eye view is essential for a successful campaign.
This type of report can also shed light on long-term projects, like SEO, PR, and content marketing campaigns, and how these projects influence your business goals.

How to write weekly marketing reports?
Writing a detailed weekly marketing report may not be limited to these points, but it will surely set you in the right direction.
1. Organize your information
Your weekly report must be as clear and concise as possible. The purpose of a weekly report is not to stress your manager or client out but to inform them as adequately as possible about your weekly progress and whether your marketing strategy is unfolding as planned.
Take note of important marketing KPIs, gather as many reporting points as you need, and write them down. This will act as a general frame of your weekly report.
When you are satisfied with every piece of information you have highlighted, you can now arrange them according to their importance using well-structured headings and paragraphs.
2. Decide which metrics to include
Your weekly marketing report should cover the metrics that aren’t important enough to raise concerns daily but are too urgent for addressing on a monthly basis.
PPC campaigns, blog posts, and marketing emails need some time to gain traction online, while monitoring them daily can give you a false impression that they are not performing.
This is why your weekly marketing reports should be more detailed than your daily ones and include KPIs and metrics that help you visualize your long-term marketing efforts.
The KPIs you should put in your weekly report fall into these categories:
- Website traffic,
- Website engagement,
- PPC channels,
- Social media engagement,
- Audience growth,
- Email marketing.
Let’s break down each category and see which metrics to include in your weekly report.
Website traffic
The number of visitors can vary with daily spikes and dips. Weekly trends, however, are more valuable for monitoring your online presence.
Your weekly report gives you a bigger picture of your website traffic that spans those short-time peaks and valleys. To identify channels that consistently drive traffic to your site, make sure you track:
- Total Sessions,
- Total Unique Visitors,
- New vs. Returning Visitors,
- Traffic Source,
- Sessions/Users by Campaign.
The aim is to determine what type of visitors are coming to your site, how often, and what content brings them in the first place.
Website engagement
Sure, the number of visitors coming to your site and where they are from is essential information. But you should also learn how visitors engage with your site week after week:
- Which blog posts are the most popular?
- Which landing pages get the most clicks?
- Where is your site losing potential leads?
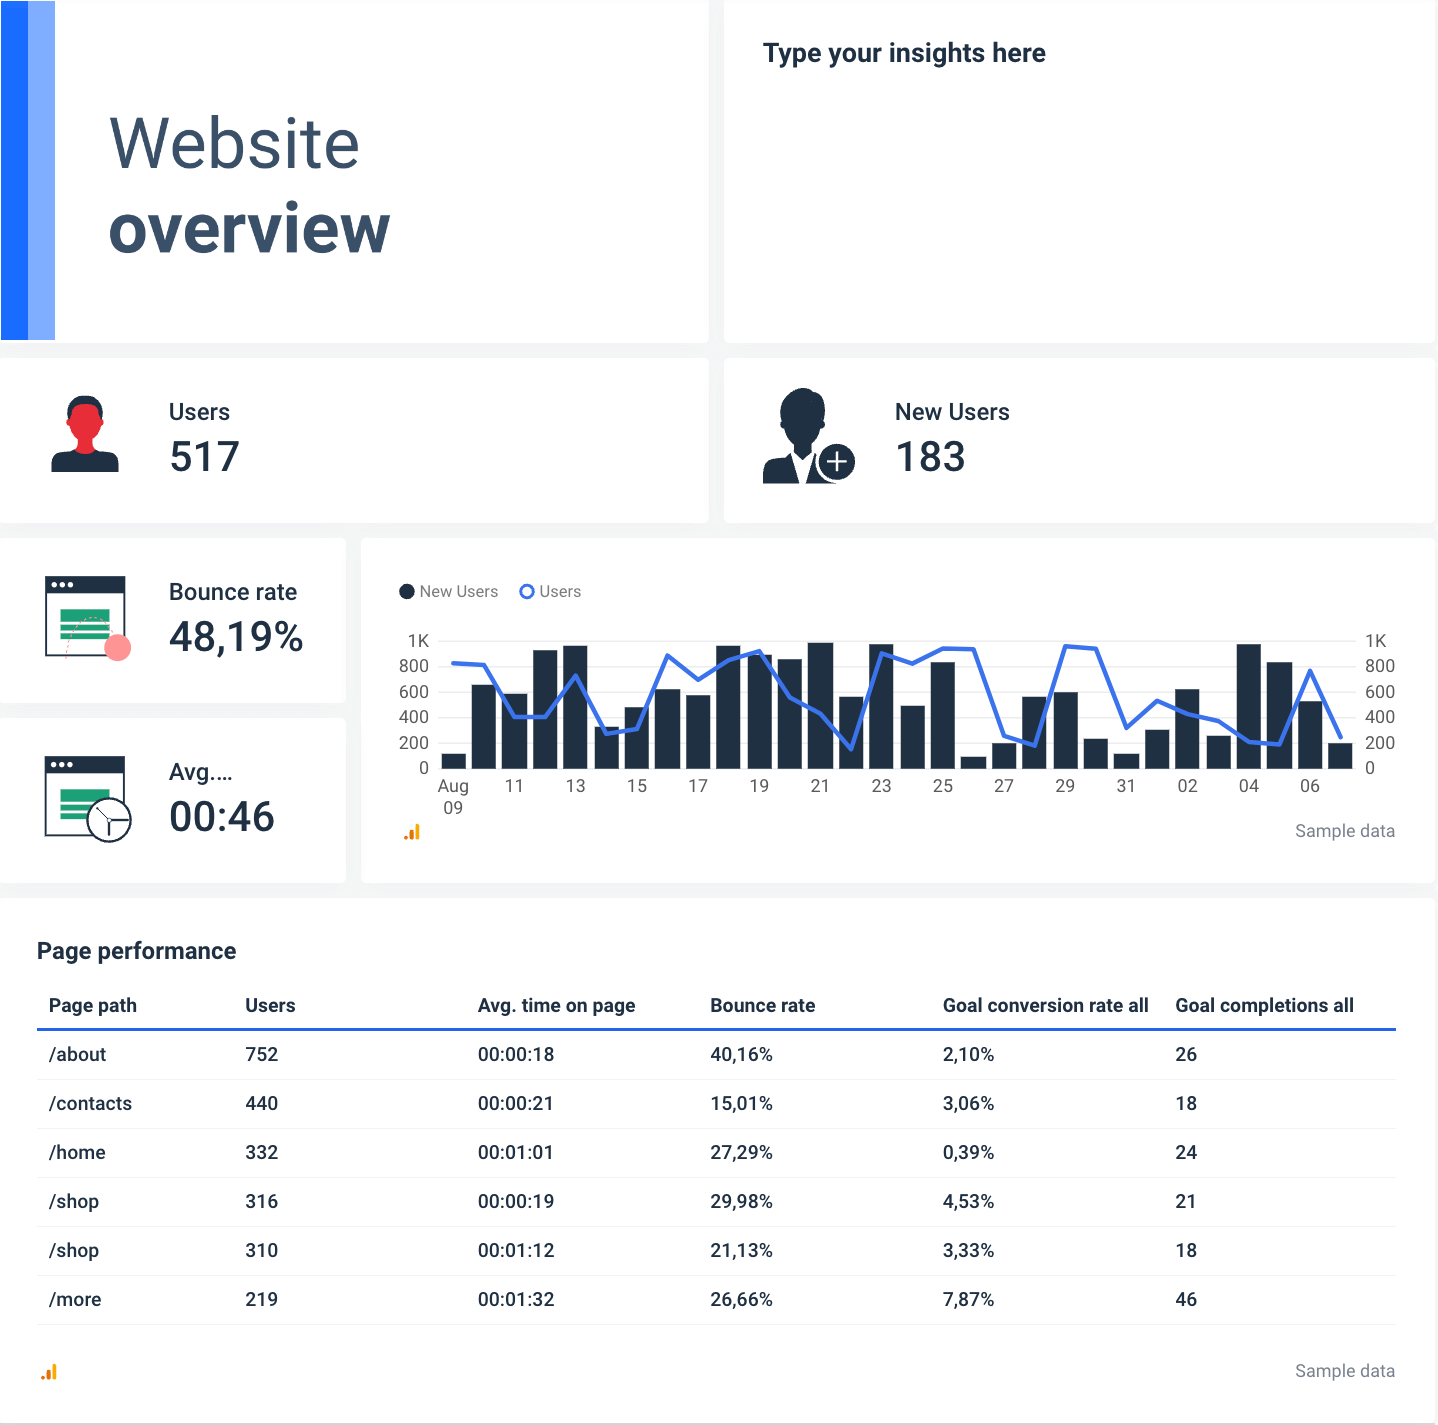
For website engagement, you’re most interested in:
- Most popular blog posts,
- Most popular landing pages,
- Pages with the highest exit rates,
- Time on site,
- Bounce rate.
You should also include specific conversion goals that you’ve set. It can be the number of email subscribers, but since we’re all most interested in the bottom line, outline some sales goals and include the conversion rate and return on investment. You can even connect ecommerce data from your CRM and create a hybrid weekly report that both the marketing and sales teams can use to align their actions.
Social media engagement metrics
Your daily marketing reports can alert you to any short-term changes that need your attention. On the other hand, weekly monitoring helps you spot longer-term trends, discover which content attracts the most attention, and plan your future marketing activities.
Weekly social media reporting allows you to react quickly and create more engaging content as a reaction.
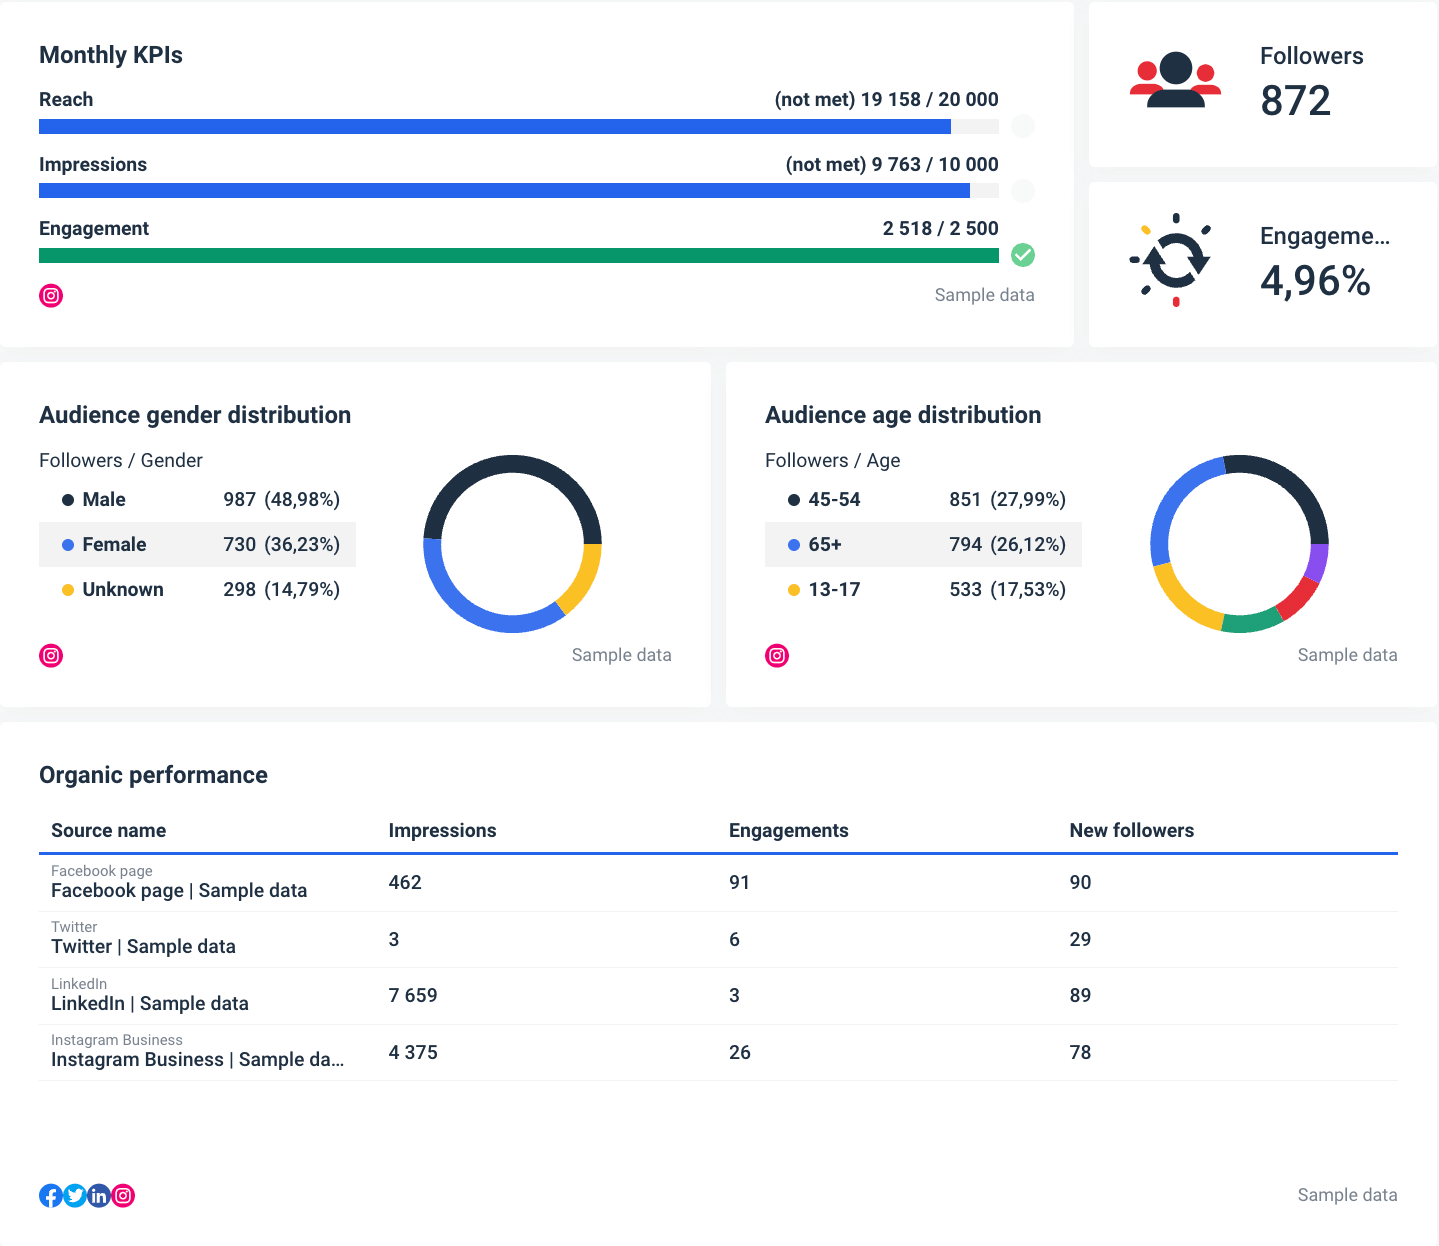
Some examples of KPIs to track with your weekly social media report include:
- Weekly Reach,
- Follower Growth Rate,
- Engagement Rate,
- Click-through Rate (CTR),
- Top Performing Posts.
The two last KPIs are probably the most valuable from the list; one can tell you which posts are most effective for your business and the other which type of posts your target audience finds most appealing.
Audience growth metrics
The number of new subscribers is another KPI worth tracking every week. Each new name on the list is a potential new customer, so your goal is to keep the list growing.
The audience growth from week to week can tell you whether the changes you’ve made in your marketing strategy are giving results.
This metric shows how successful your website, content, and social media marketing are in targeting certain demographics and encouraging people to sign up.
Email marketing metrics
When you send an email, there’s little you can do to change the course of the campaign. However, the marketing data takes time to form. Not everyone checks their emails the second they receive them.
Your email campaign can take days to yield accurate open and click-through rates, which is why a weekly report is a perfect place to start monitoring the metrics like:
- Open Rate,
- Click-through Rate,
- Unsubscribe Rate.
A weekly email marketing report can indicate how well your last week’s email performed and give you a heads up if it’s a successful campaign.
PPC channels
New ad campaigns can take a few days to gain momentum and show valuable stats. A quick look at daily reports is fine, but you want to focus on weekly reports for trends.
It’s the same for paid ads on social media as on Google and other search engines.
The actual metrics you’ll extract depend on the platform, but make sure to include:
- Reach,
- Cost-per-Click (CPC),
- Cost-per-Conversion,
- Click-through Rate.
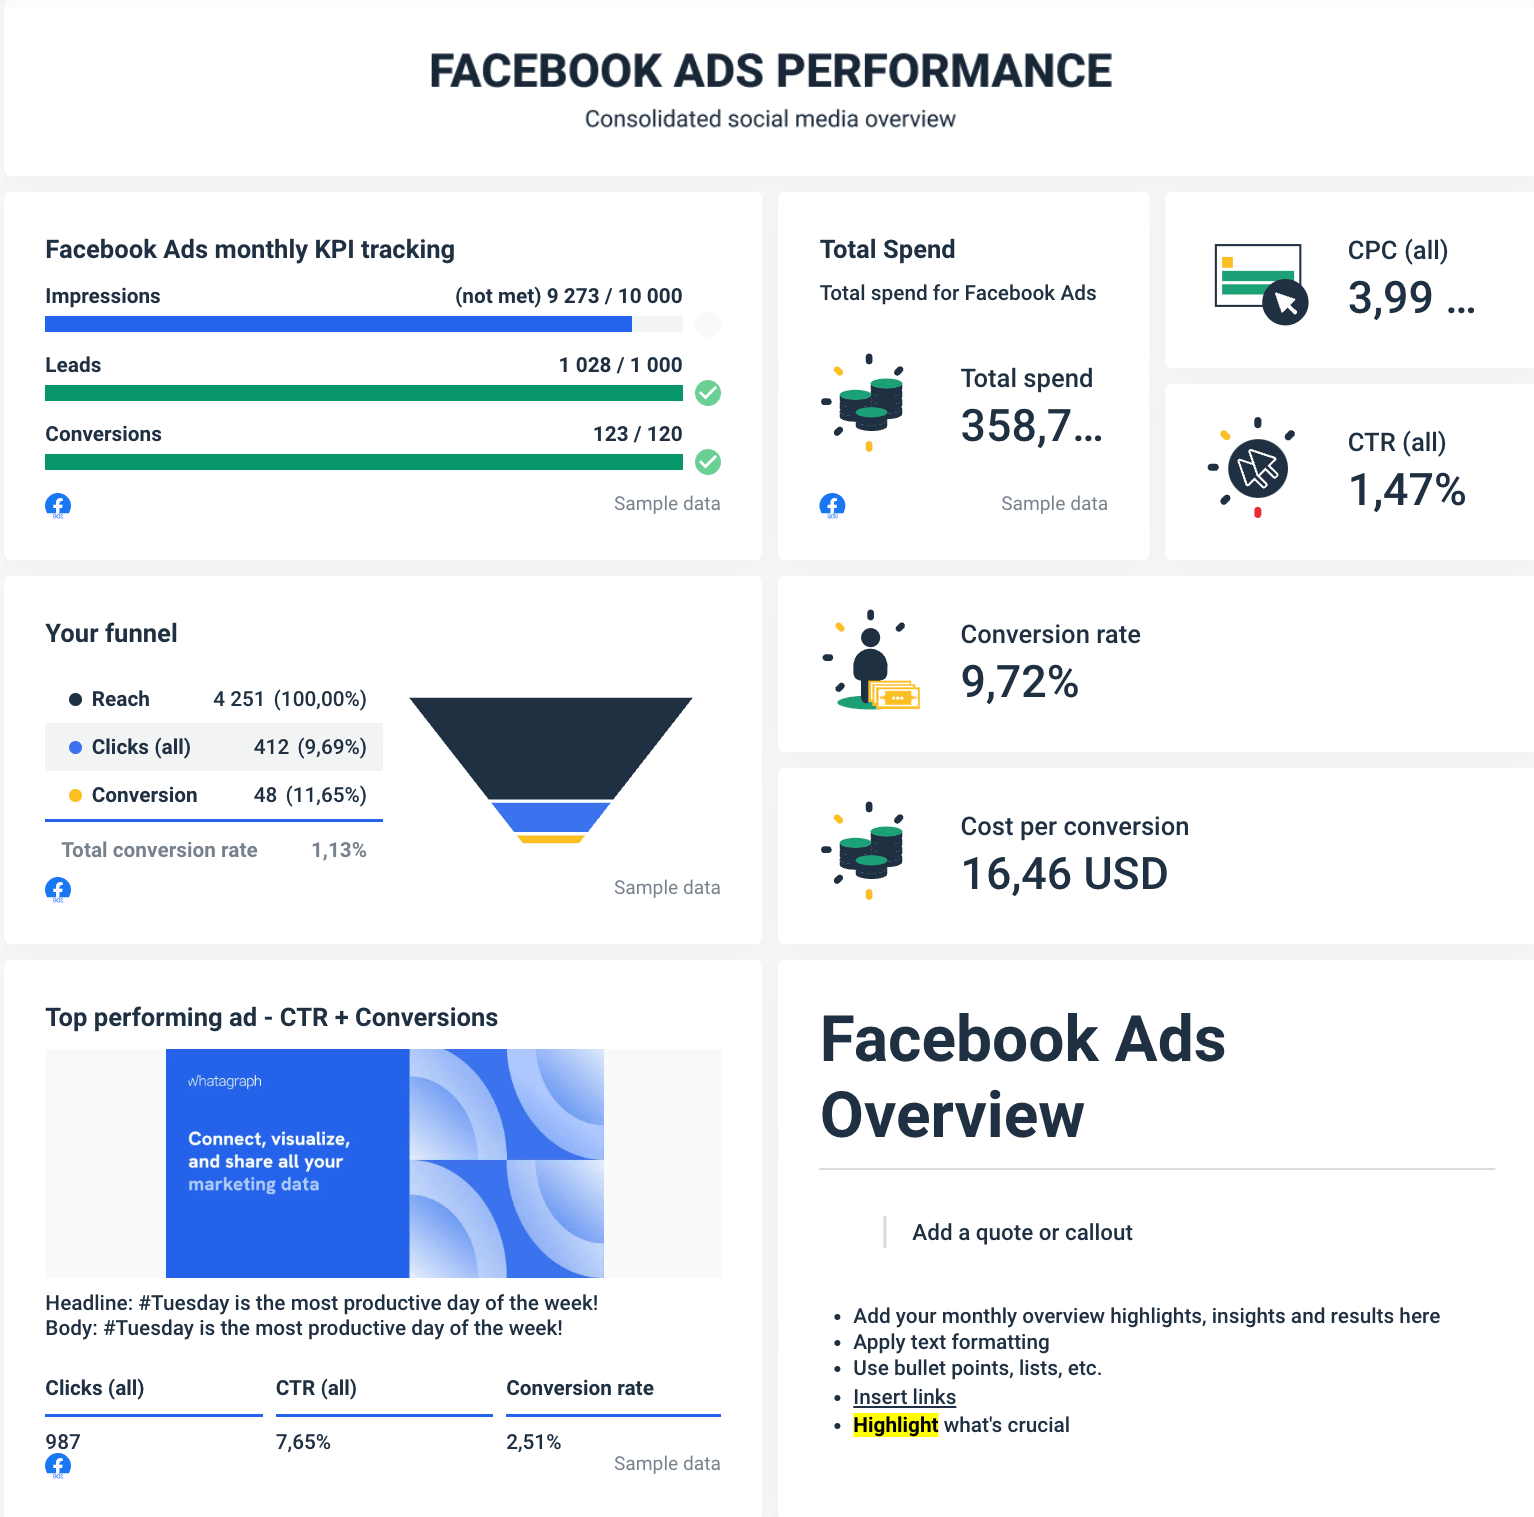
If you want to closely monitor paid ads and optimize your marketing budget, these metrics should be on your daily, weekly, and monthly marketing reports.
3. Use a report template
You can create a weekly marketing report much faster and with more accuracy if you use a report template.
And by that, we don’t mean Excel templates — those are things of the past. Instead, you should use a marketing reporting tool that can pull data from various sources. A data-driven template saves you hours of building different types of marketing performance reports.
You should also be able to integrate this template with platforms like Google Analytics 4, email marketing tools, LinkedIn Ads, Facebook Ads, and every other social media channel that your marketing agency uses.
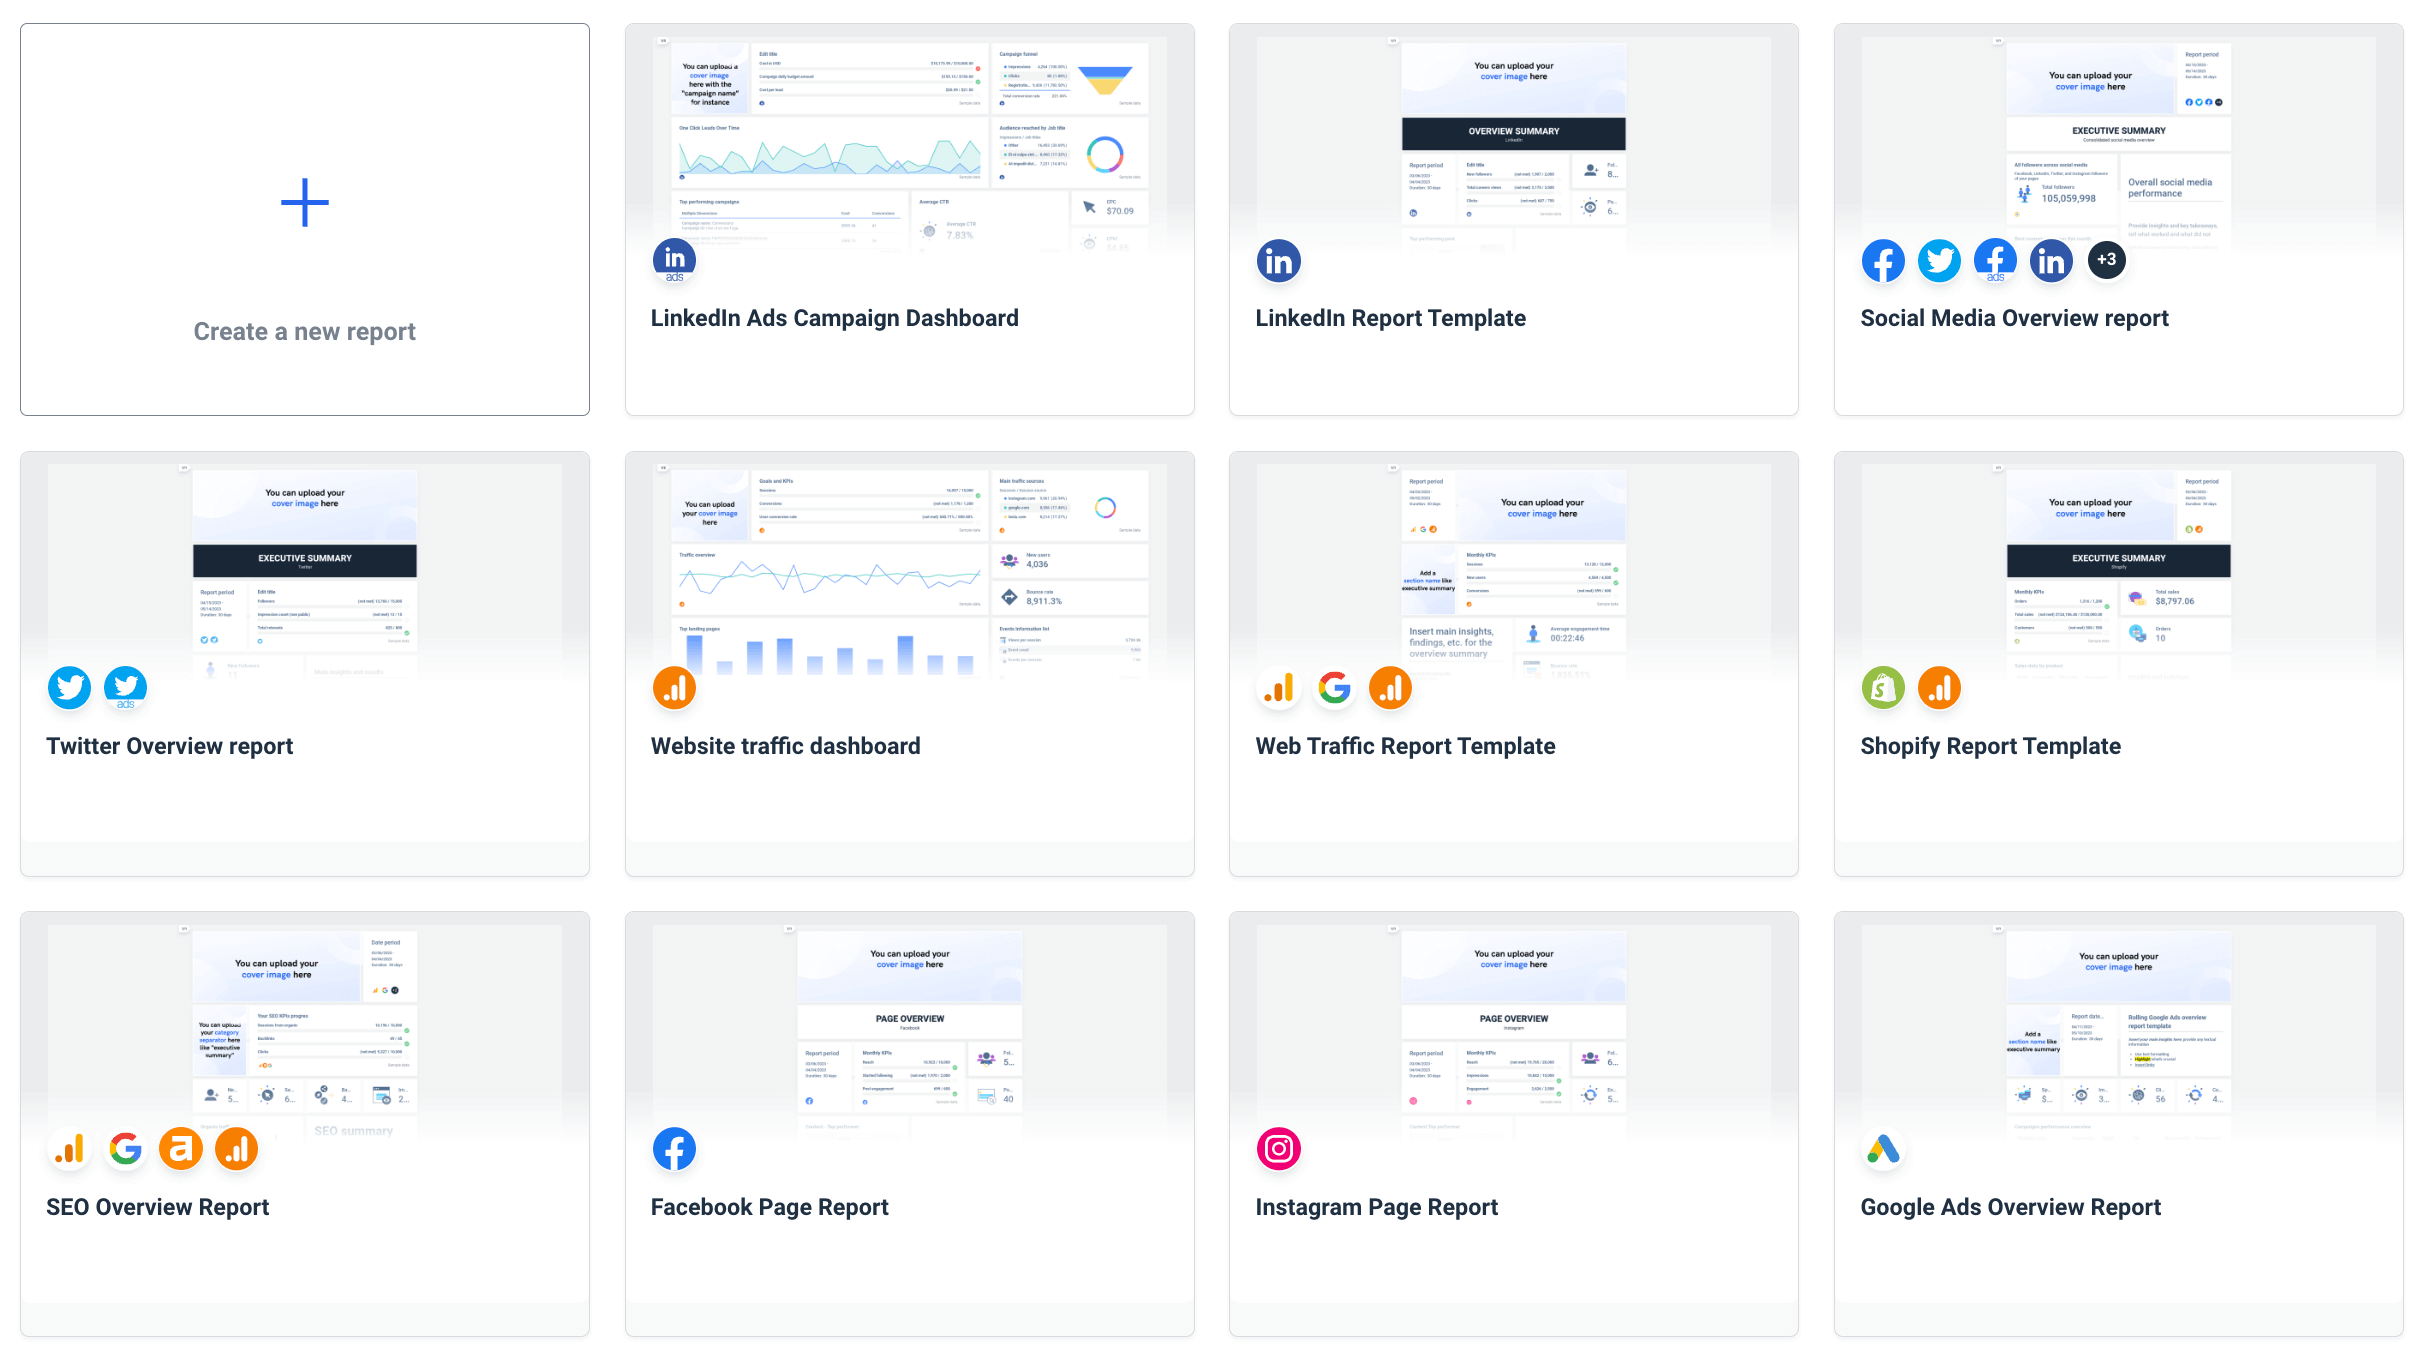
Social media marketing is an important part of the overall digital reporting. It contains specific marketing data you should include both in your weekly and monthly marketing report template.
However, the social media marketing report is only one of many types of weekly reports that help you understand the bottom line.
Your weekly marketing report template can be a one-pager and focus only on website traffic or contain multiple pages and analyze different key performance indicators, such as organic traffic, rankings, and referrals, as well as data from Google Ads, social media platforms, and other marketing channels.
4. Pay attention to design
To make your report as engaging as possible, consider its design. Use colors to distinguish between tasks, e.g., completed in blue, pending in green, and tasks yet to start in red. You can use different designs for different report examples.
Marketing report templates allow you to easily include charts and graphs, diagrams, timelines, maps, and other data visualization widgets.
To get an idea of what a well-designed marketing report should look like, check out our article on 6 stunning marketing report examples with templates you can use.
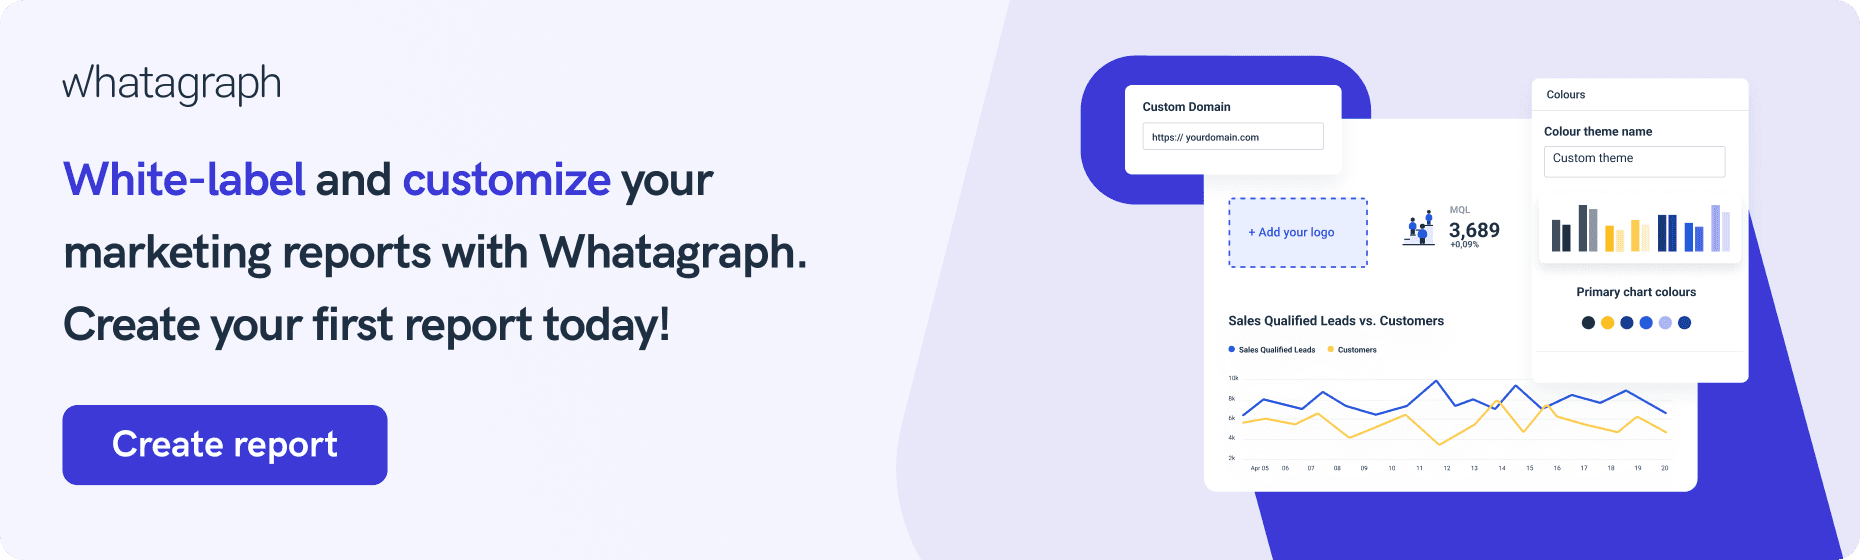
More advanced reporting solutions allow you to change the color scheme for the entire report, as well as replace the original branding with yours or your client’s.
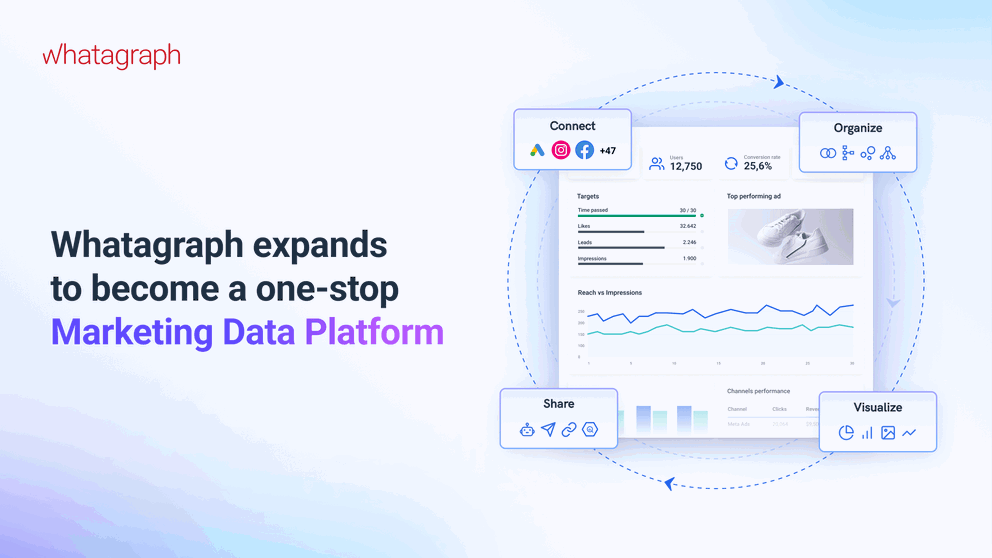
How does Whatagraph make weekly reporting easier?
Whatagraph eliminates a ton of manual work from your reporting process and brings on the speed and accuracy that Excel reports can only dream about. So, what makes Whatagraph an ideal choice for marketing reporting?
One platform
Whatagraph is an all-in-one platform to connect, visualize, and share your marketing data. This makes the whole process much faster and more stable than using separate tools for connecting or visualization.
Thanks to native integration with over 45 marketing platforms, the speed and performance of your reports don’t depend on 3rd party connectors.
No integration for your source yet? Connect your data via a custom API or export it to Google BigQuery or Google Sheets first.
Report and widget templates
Cut your reporting time by grabbing a template from our library. Edit any template to fit your needs and save it for future use. Change the report color and logo to match your or your client’s branding.
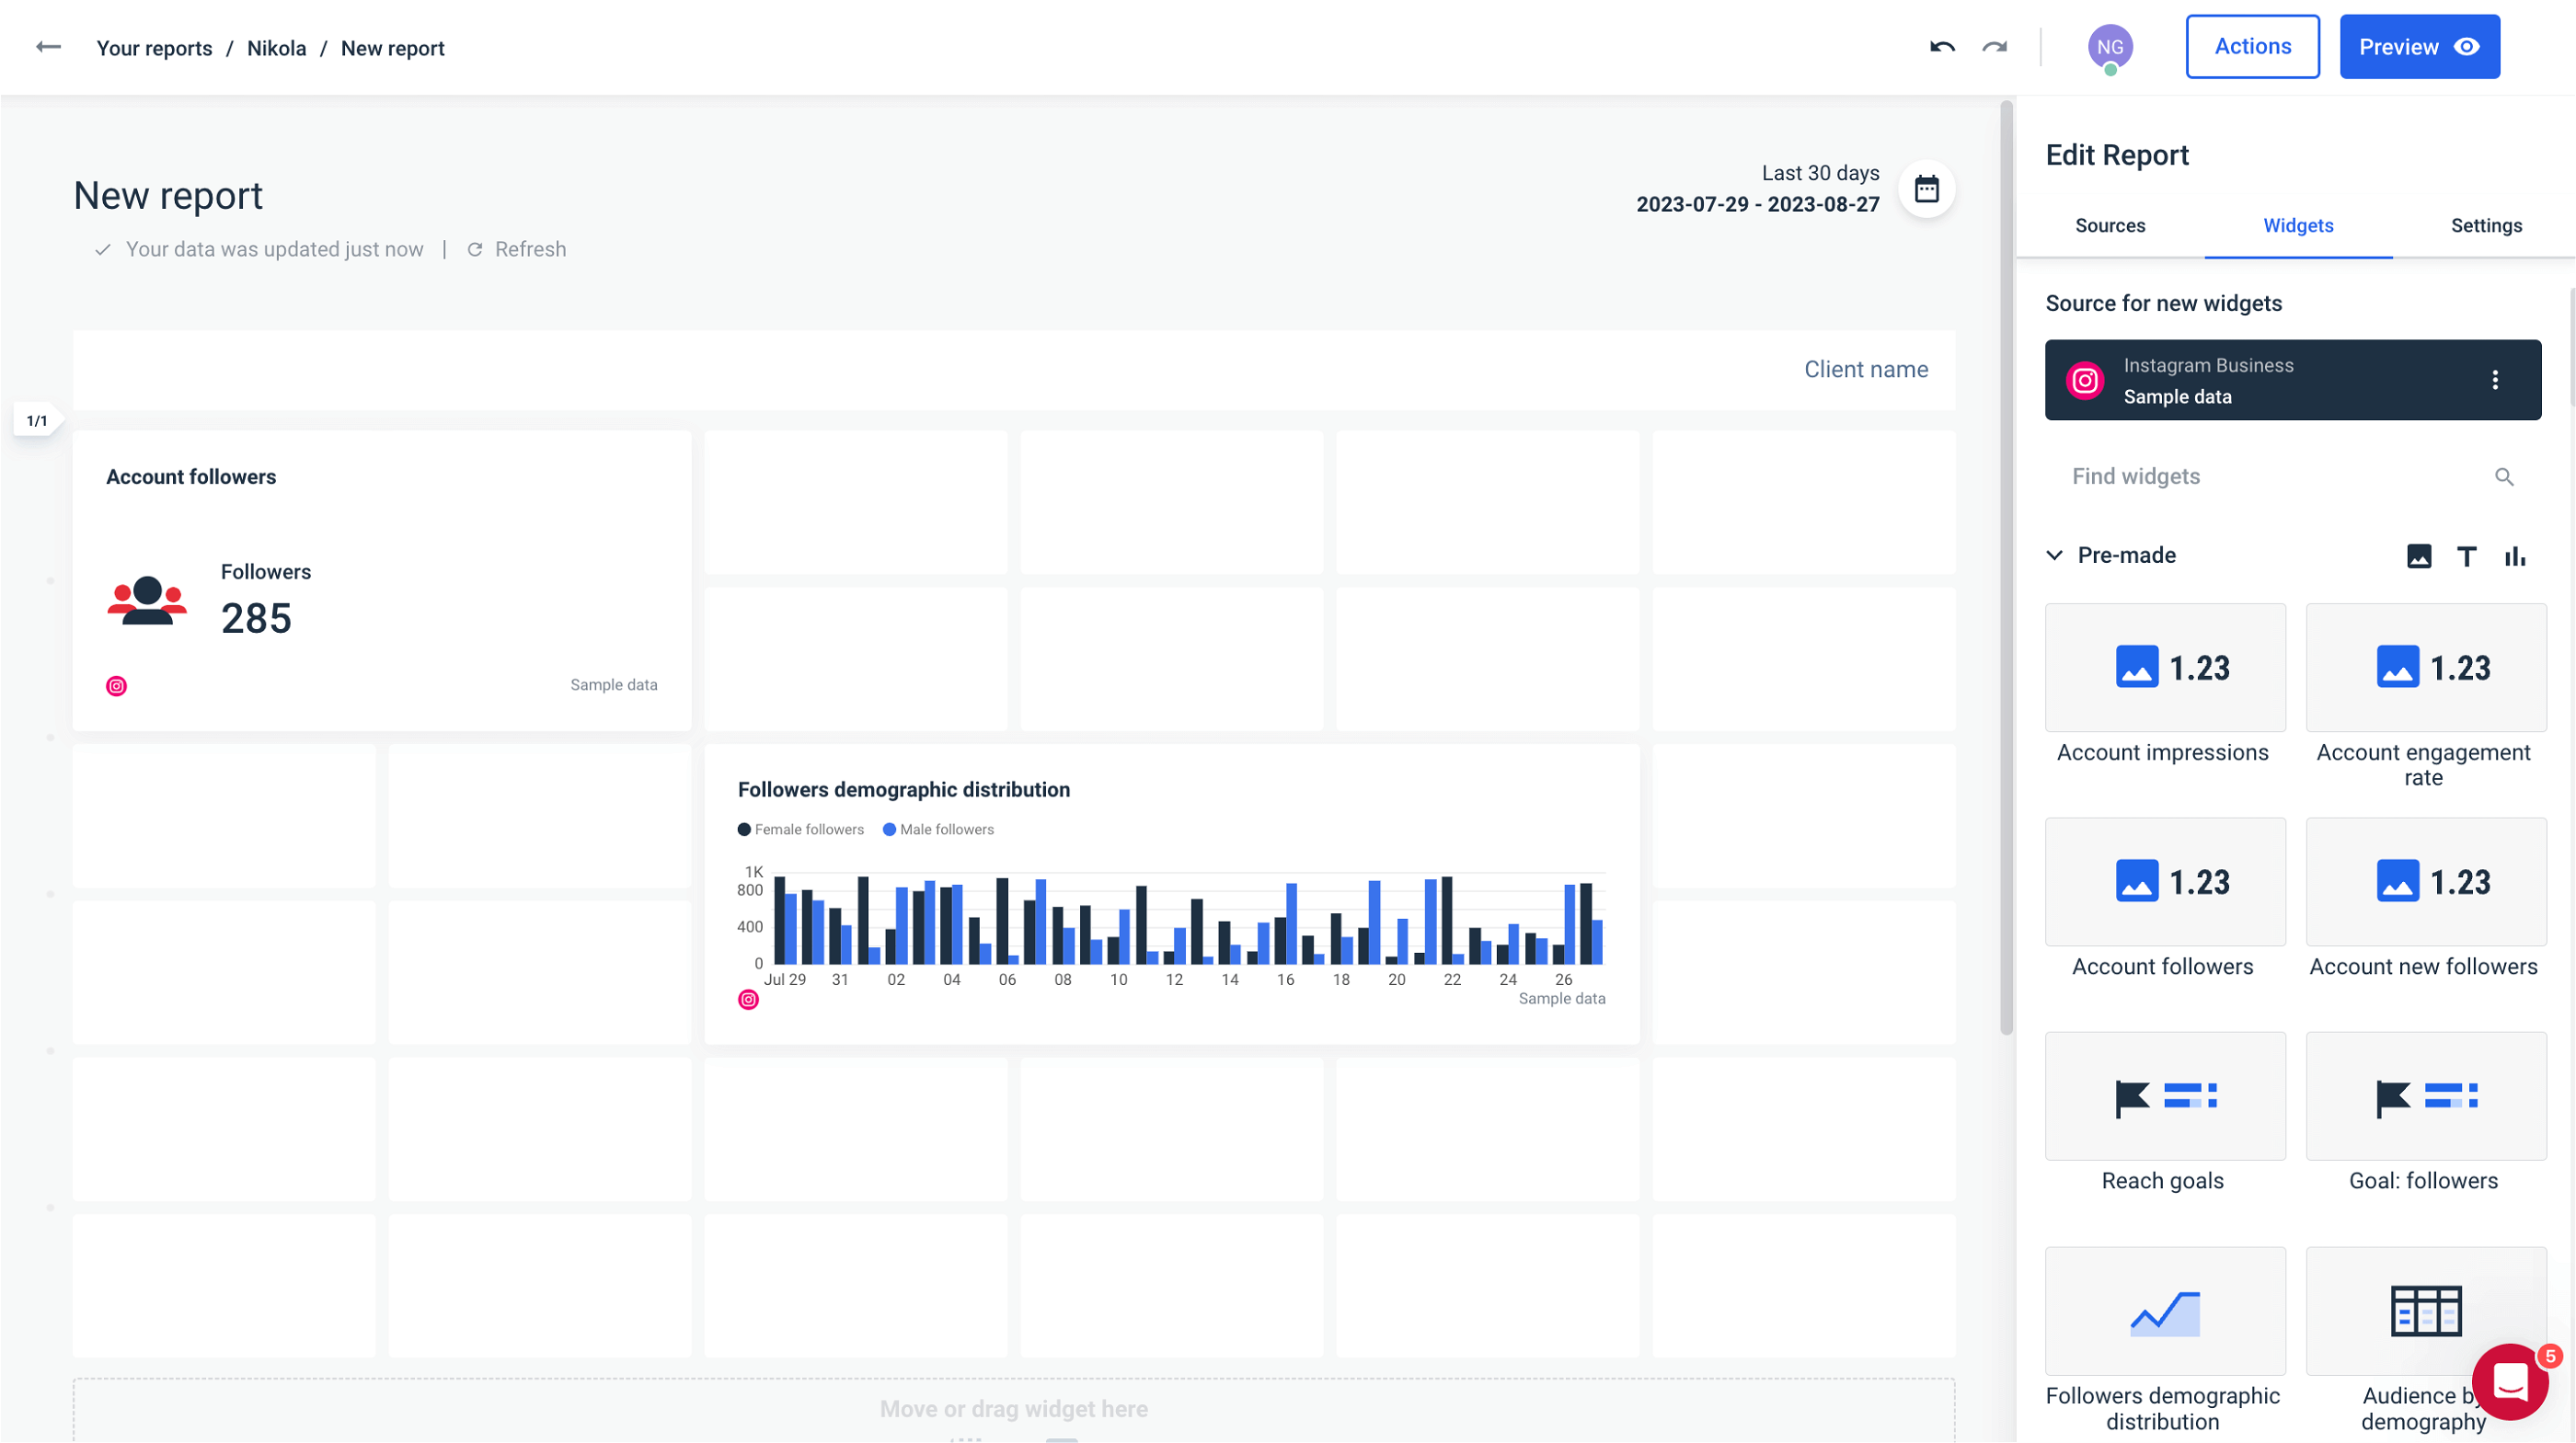
Building a report in Whatagraph is intuitive thanks to widgets you can drag and drop on the page like interactive building blocks. You can resize and rearrange the visualizations, add custom filters, or change their data source. Any graph, chart, or table you customize is available for use in future reports.
Custom formulas
Combine and change the basic metrics you pull from the marketing platforms and create new metrics thanks to custom formulas.
These formulas are easy to build and allow you to create unlimited new metrics, which is handy when creating tailored cross-channel marketing reports.
Report folders
Keep your reporting environment neat and organized by placing reports in separate folders — by client, department, account, etc. This makes it easier to locate any marketing dashboard or report you need and harder to misplace any saved template.
These folders are also useful for in-house marketing teams in large companies that need to create analytics reports on different brands or countries.
In the case of Rekom Group, a global nightlife leader that chose Whatagraph as their marketing data platform, folders represent different countries.
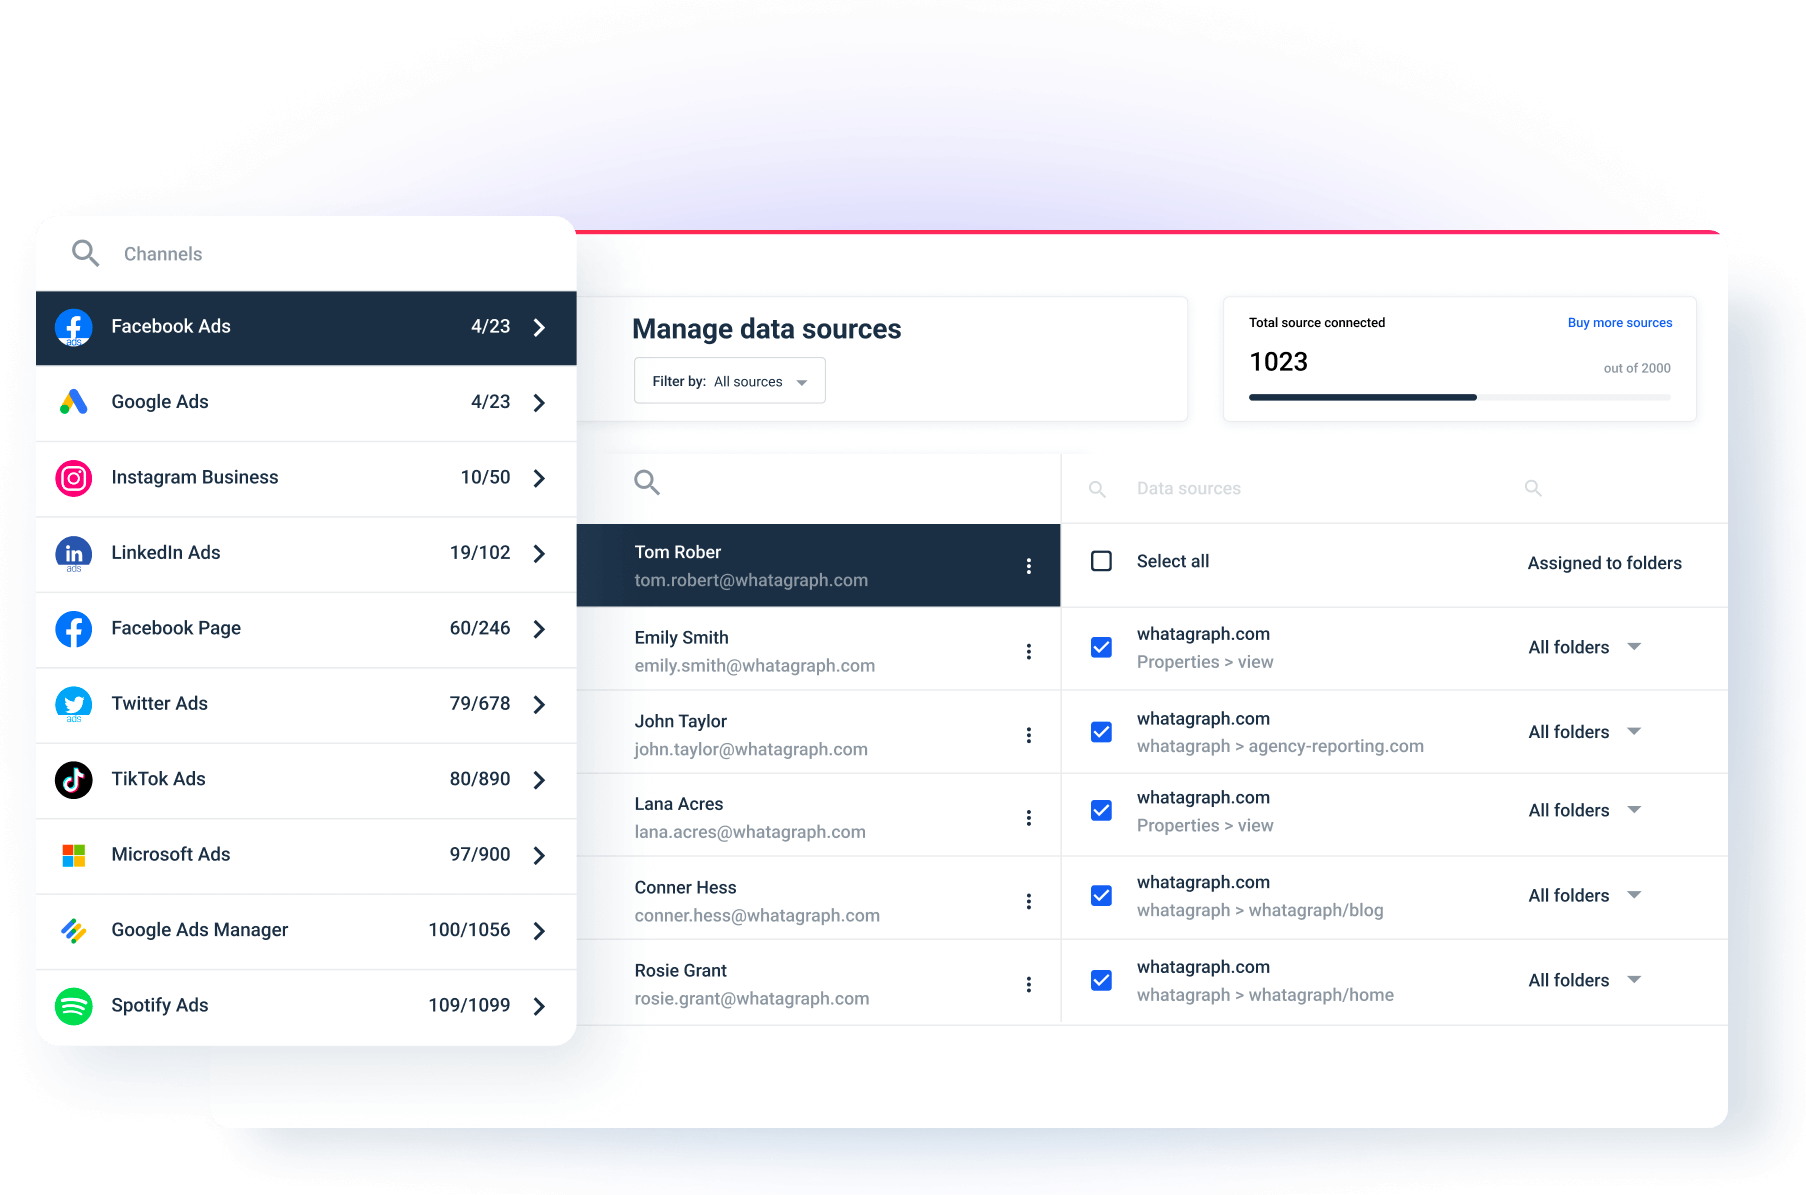
Within each folder, Rekom marketers can use country-level reports to make optimizations and improve the performance of multiple venues at once. On the other hand, reports and dashboards for a single venue contain a specific set of social or web assets.
But Whatagraph allows you to create any folder structure you need, depending on your business departments, functions, and teams.
Edit templates in bulk
Whatagraph allows you to create unlimited reports in any pricing plan. But imagine having, for example, to replace Google Analytics with Google Analytics 4 in every one of them or adding a new message to the cover page.
The bulk template edit feature saves you from manually changing each report. Add or remove marketing channels, and change the name or company logo to multiple reports simultaneously.
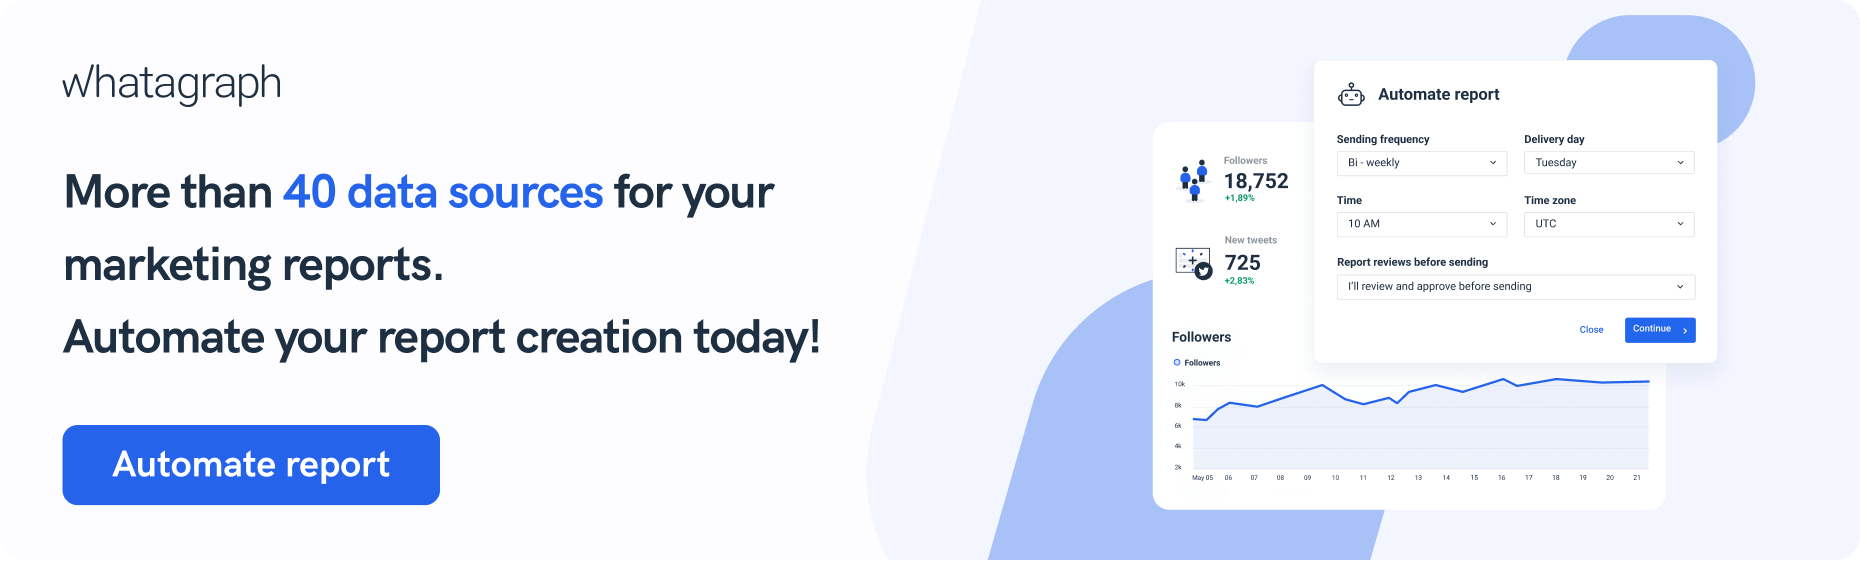
Automated reporting
Why bother with downloading and sending one report at a time? Create an email template, pick the frequency, add recipients, set the delivery time, and Whatagraph does the rest. Automate report sending and never again worry about missing deadlines or mixing up schedules.
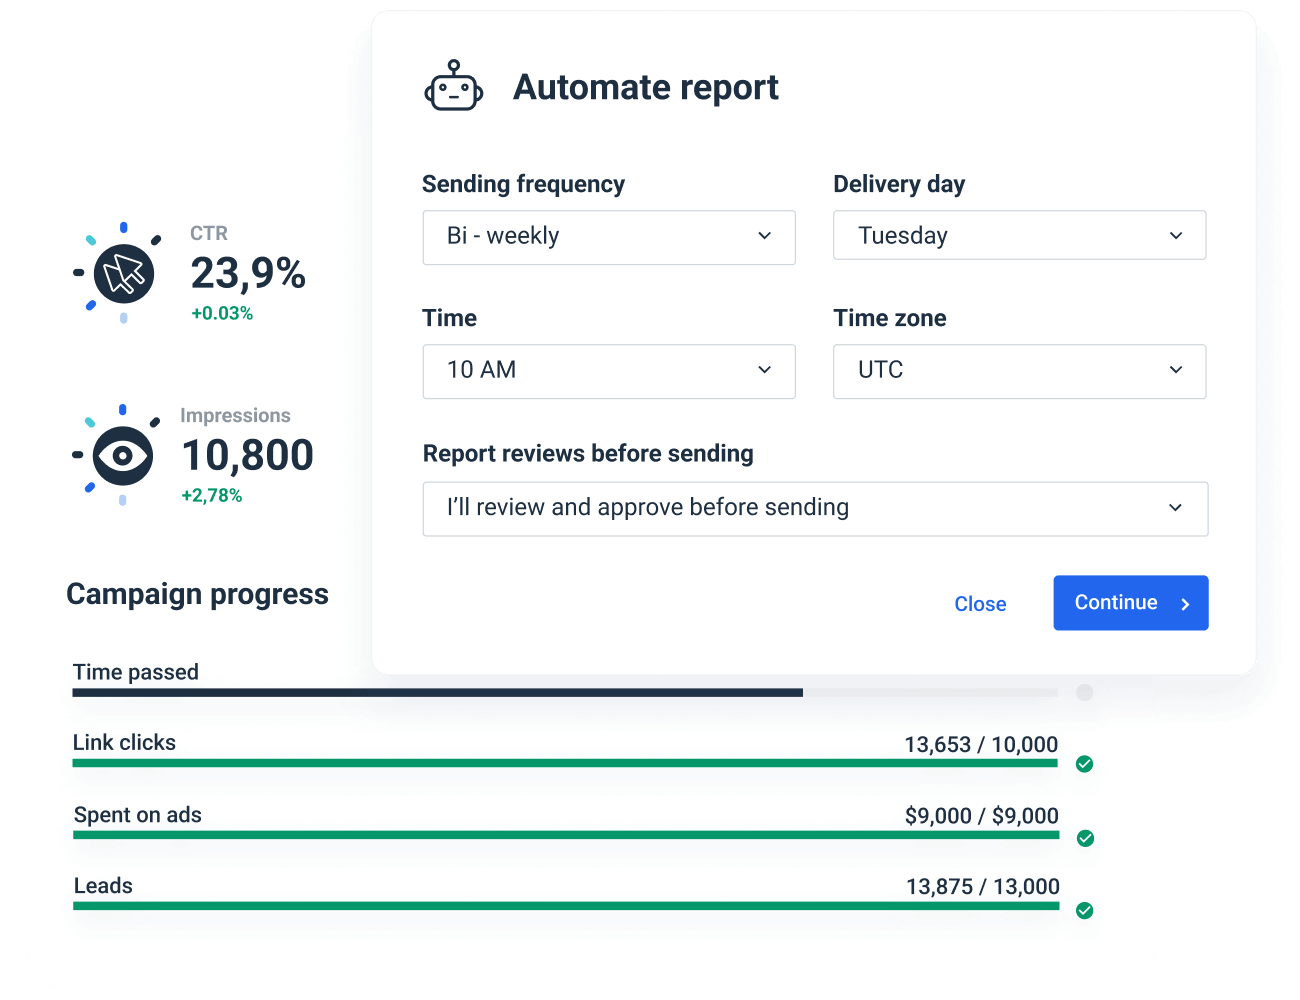
Decide whether to send reports immediately or inspect them one last time before they go out. If your stakeholders prefer a more real-time approach, share a live link so they can see the changes as the report updates.
Wrapping up
Creating and sending weekly reports can be one of the most fruitful activities for your marketing team, agency, and even your client. The best part is that with a reporting tool like Whatagraph, you can create a weekly report in just minutes. Sign up for your free trial today and make your first weekly marketing report without a headache!