A Workflow Diagram: What It Is and How to Create It
Visualization can help you understand how your business works. It makes your processes clearer and easier to analyze and understand. One of the most powerful visualization tools is the workflow diagram, and in this article, you’ll learn what this tool is, why it’s useful, and how to create it.
What Do the Standard Workflow Diagram Shapes and Symbols Mean?
What Are the 3 Basic Components of a Workflow Diagram?
Types of a Workflow Diagram
How to Create a Workflow Diagram?
Step #1 - Select Your Process
Step #2 - Define the Beginning and End Point
Step #3 - Gather Your Information
Step #4 - Get Rid of Inefficiencies
Step #5 - Design the Workflow Diagram
Step #6 - Analyze the Results
Automating Workflows with Software
Conclusion
What Is a Workflow Diagram?
A workflow diagram is a graphic overview of a business process, most commonly done through a flowchart. It shows the steps needed to complete your work from the beginning to the end using standardized symbols, pointing out the person responsible for each step of the process.
Creating a workflow diagram, or workflow requires a deep workflow analysis that can reveal potential weaknesses, flaws, and areas for improvement.
A Little History Lesson
The origins of today’s workflow can be traced back to Henry Gantt and Frederick Wilson Taylor, two American mechanical engineers and leading proponents of scientific management.
The technological advancement in the workplace has expanded the ability to further research and spread knowledge of the workflow system. The need for the rational organization of the work was affected by the growing field of optimization theory, the Apollo program, and World War II.
The idea of total quality management became popular in the 1980s, and businesses wanted to become globally competitive, making the period flourishing for workflows which helped total quality management efforts and the movement whose purpose was to recognize and eliminate defects in the business and manufacturing process called Six Sigma.
Why Are Workflow Diagrams Useful?
Workflow diagrams are used to streamline daily business operations and activities, improve efficiency, and boost workforce productivity and profits.
They help employees keep track of the steps or tasks in the process. With a visual representation of the tasks, time, and the person responsible for each task, the risk of cumulative delays is considerably lower.
In other words, they can double-check the task that needs to be done and find out who’s responsible for it, thus helping them to understand their roles better and how each of them relates to other departments. This, in turn, can lead to better communication and more cohesiveness.
Workflow diagrams can help you to efficiently analyze and streamline business processes at the workplace.
They can help you understand the entire process more thoroughly and identify potential problems before they happen. Workflow diagrams can also help if you want to track metrics for processes, improve processes by removing inefficiencies, or automate manual processes.
When Can You Use a Workflow Diagram?
Even though these visualization methods originated in the manufacturing industry, they are extremely useful for almost any business. Here are some examples of industries that can benefit from a workflow diagram:
• Finance – a workflow can help you document a lot of processes, from payment processing to purchase orders and collections;
• Medical – a workflow can help hospitals represent the steps taken in an ER visit;
• Education – a workflow can help depict the steps university students take to enroll;
• Military – a workflow can depict the steps taken during a military deployment operation;
• E-commerce – a workflow can represent the process customers go through, from ordering a product to receiving it;
• App development – a workflow can represent each step an app goes through, including brainstorming, planning, designing, programming, launching, and bug fixing.
As you can see, you can use a workflow diagram in a wide range of businesses.
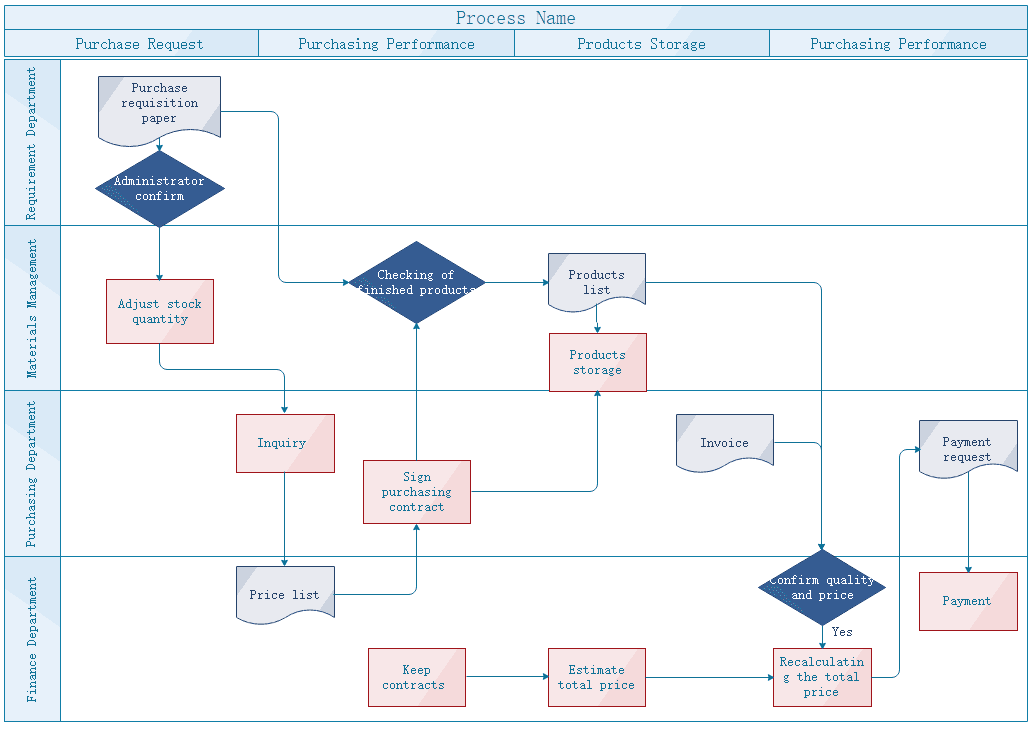
What Do the Standard Workflow Diagram Shapes and Symbols Mean?
Before creating a workflow, you need to understand the standard shapes and symbols used in the process. There’s a variety of symbols based on the use-case, but here are the most commonly used to help you get started:
• Rectangle – shows the action or process carried out by an individual and the instructions needed;
• Oval – signifies the beginning or final point of a process;
• Diamond – used when approval or decision needs to be made;
• Arrow – shows the connection between different processes or steps;
• Circle – used when you need to leap from one to another section.
What Are the 3 Basic Components of a Workflow Diagram?
The elements of workflow diagrams are created to show the flow between each step, and each step can be assigned one of the following statuses:
Input
It refers to something that’s needed to complete the step, such as information, a decision, capital, equipment, or action.
For example, one input in a marketing agency can be “create a logo design.” This can be put inside a rectangle. If the following step is “add the words,” the following input would be “copy team create a tagline.” You would use an arrow to connect these steps.
Transformation
It’s the changes that lead to the creation of the output, such as a change in location (e.g., customers moving from the street into the shop), a change in physical characteristics (e.g., the design being transformed into a digital app), or a change in purpose or ownership.
Output
This refers to the result of the transformation or the finished product.
Types of a Workflow Diagram
There are different types of workflow diagram, but these are the most commonly used:
ANSI flowchart – the original standard for a workflow diagram that uses symbols from ANSI (the American National Standards Institute) to describe each of the steps involved.
UML activity – graphical representation of the order of tasks or steps involved and the flow of control using the Unified Modeling Language.
BPMN – Business Process Modelling Notation is a type of diagram that uses standardized symbols that allow both non-technical and technical users to understand it more easily.
SIPOC – Suppliers Inputs Processes Outputs Customers is a type of diagram that concentrates on analyzing the various aspects of workflows and identifying their levels of importance. The focus here is put on those who create and receive the data, unlike traditional diagrams where the order of steps is the main focus.
How to Create a Workflow Diagram?
Here are the steps you need to take to create a workflow diagram:
Step #1 - Select Your Process
Identify the process you plan to track and the reason for tracking it. Think about the things you want to discover. This will help you choose the right type of a workflow diagram for your needs. Consider the people that are going to see and use the workflow.
If it’s intended for non-technical users, choose a BPMN diagram so that everyone can understand the symbols used in the diagram.
Another thing to consider is whether your diagram is presenting how a process currently works, or how you hope the new implementation will look.
Step #2 - Define the Beginning and End Point
Make sure you have a clear beginning and end goal. Think about what’s defining the start and end of the process.
Step #3 - Gather Your Information
This step involves communicating with different departments and employees to gather the information that will ensure your diagram is accurate. Outline what tasks are involved in each step and who is responsible for those tasks and decisions.
Don’t forget to note process timelines, potential bottlenecks, flaws, deviations, and potential improvements.
Step #4 - Get Rid of Inefficiencies
Check out your tasks and put them into one of the following categories: useful, must-have, nice-to-have, and unnecessary. This categorization will help you to streamline your process and assign tasks to the right employees.
For an easier categorization, think about your overall goal and that of your company. If a certain task Is not contributing to this goal, put it into the unnecessary category.
Step #5 - Design the Workflow Diagram
This is where you turn all that information into visuals. It’s your choice whether you’re going to use a diagramming tool or a pen and paper. No matter the method you use, it’s important to make it easy to use, share, and edit.
Step #6 - Analyze the Results
Now it’s time to see if any processes are taking too long, any bottlenecks, or any stages that are costlier than they should be. Are you able to boost efficiency through automation? Think about these things and consider them.
Automating Workflows with Software
What’s better than documenting workflows? Automating them. You can use workflow software or diagramming tools to route tasks between team members or employees, eliminating the need for the chaos of emails.
Employees usually get a dashboard of tasks and to-dos, while managers can see their workflows from a top-down perspective, as well as bottlenecks, deadlines, etc.
A workflow diagram helps you to visualize a business process so that you can understand it on a deeper level. It’s extremely beneficial for both employees and managers as it helps them see each step of the process and find out what tasks they responsible for.
Published on Jun 22 2020
WRITTEN BY
Indrė Jankutė-Carmaciu
Indrė is a copywriter at Whatagraph with extensive experience in search engine optimization and public relations. She holds a degree in International Relations, while her professional background includes different marketing and advertising niches. She manages to merge marketing strategy and public speaking while educating readers on how to automate their businesses.