Discover a Powerful DashThis Alternative
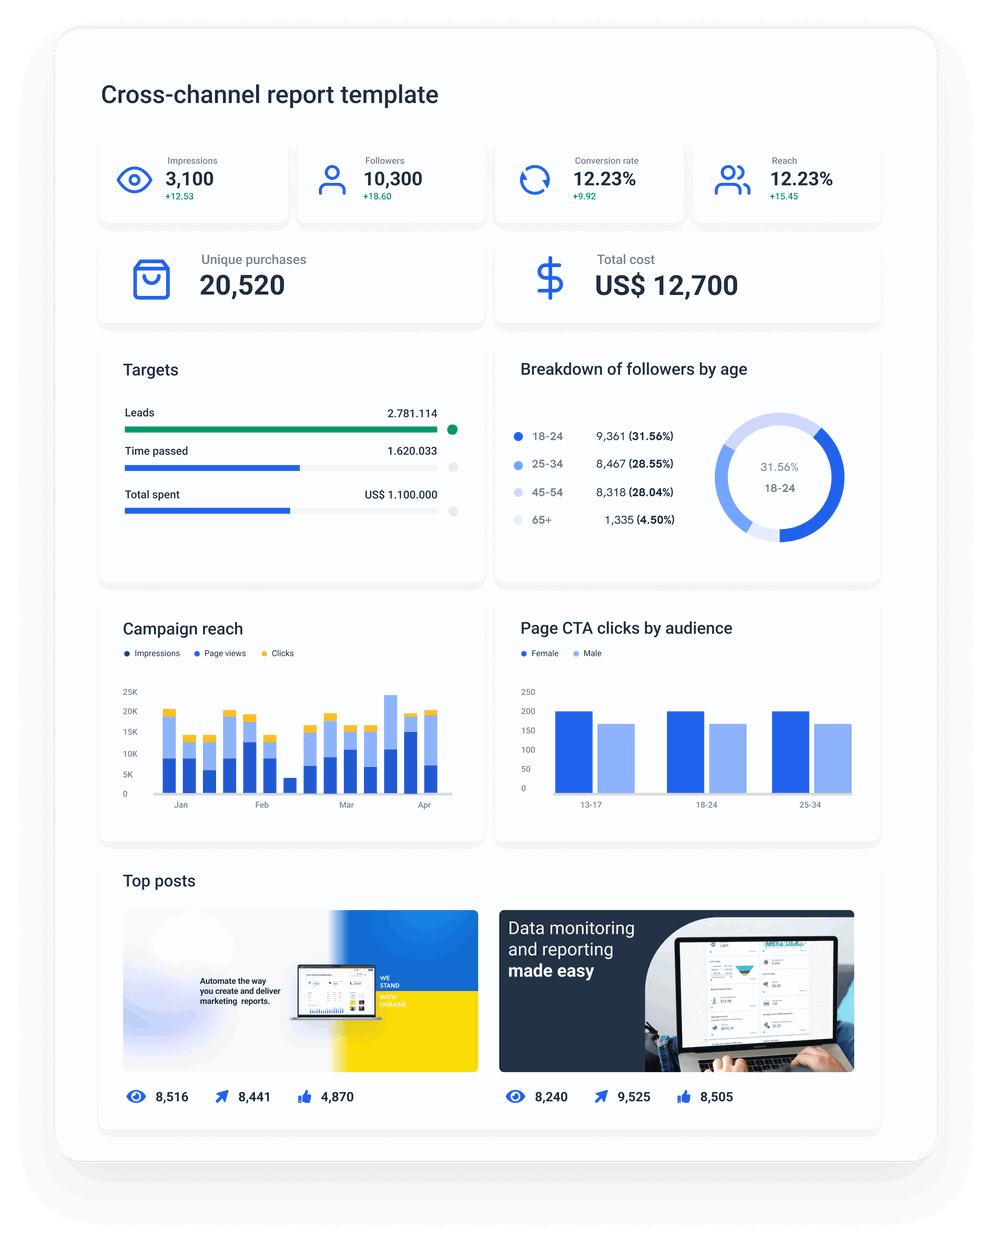
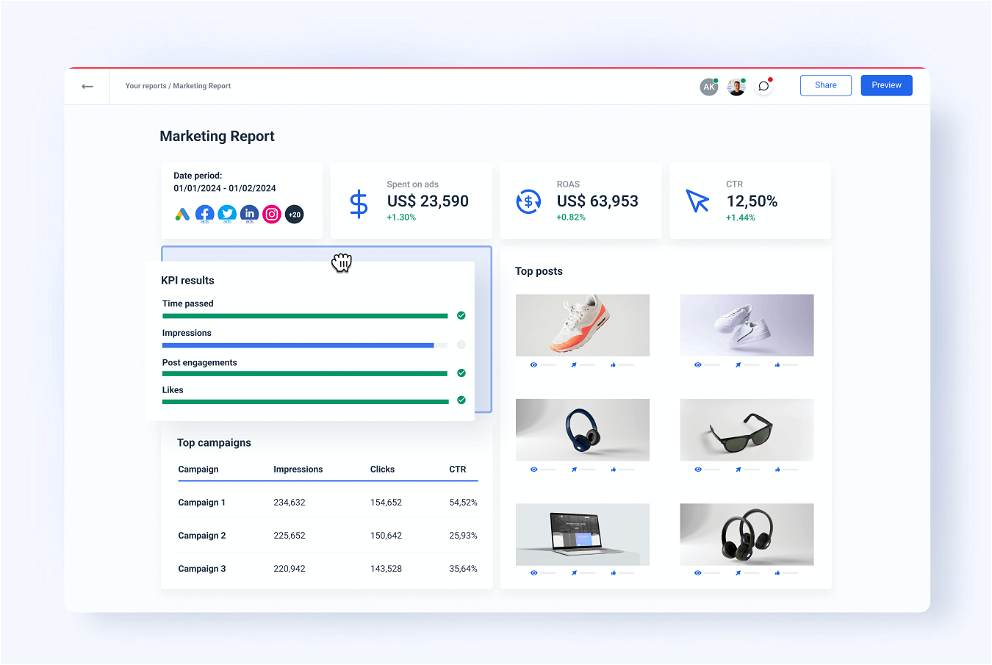
Whatagraph offers an easy-to-use, all-inclusive platform to connect, organize, visualize, and share marketing data with excellent support and automation features. Switch to a worthy DashThis alternative with more native integrations, unlimited dashboards, and effortless cross-channel monitoring.
- Live chat customer support

- 45+ marketing channels
- Cross-channel monitoring
No credit card required


3 Reasons to Choose Whatagraph as Your DashThis Alternative
More integrations than DashThis + export options
Data export in a spreadsheet format and data transfers to a warehouse are not possible in DashThis. Whatagraph on the other hand has more native integrations with popular marketing sources and allows visualizing data from BigQuery and Custom API.
Organize data before visualizing it
Whatagraph allows you to get insights faster and provide more engaging and clear reporting to clients or stakeholders. Whatagraph you can unify, rename, and translate data outputs at scale, aggregate data to create tiers or totals, and blend cross-channel data into one source.
Time-saving & superior visualization
Whatagraph has an intuitive and fast data visualization environment with a drag-and-drop builder, pre-made widgets, and templates. It also provides extensive customization, enables you to create cross-channel overviews, and link dozens of reports to a template to edit them simultaneously.
A One-stop Shop Alternative to Dashthis
A single platform for all your marketing reporting and data needs. Clear “per-source” pricing plans, intuitive and easy-to-use, great for cross-channel reporting.
 | ||
|---|---|---|
| Connect | ||
| Native integrations |  | |
| Data warehouse as a source | |  |
| Custom API | | |
| Organize | ||
| Data organization capabilities | | |
| Data blending | | |
| Aggregate data from multiple sources | | |
| Unify and group cross-channel data | | |
| Create custom metrics and dimensions | | |
| Apply calculations and formulas | | |
| Visualize | ||
| Data visualization | | |
| Intuitive visualization builder | | |
| Linked templates | | |
| Cross-channel overviews | | |
| Unlimited reports/dashboards | | |
| Report/dashboard customization | | |
| Share | ||
| Sharing PDFs, sending out report emails or live links | | |
| Data export in spreadsheet format | | |
| Data transfer to a warehouse | | |
| Support | ||
| Live chat support | | |
DashThis Pros and Cons – What Do Users Say?
I was recently introduced to DashThis, after finding Google Analytics to have some functional and flexibility issues. I've found DashThis to be more intuitive and flexible than Google Analytics.

Capterra verified review by
Chuck W. IT Liaison Government Administration, 10,001+ employees
Overall I am pleased with the features it offers. However, what I like least about this software is the lack of customization options. It seems like you can only design your dashboard based on a few pre-set templates, which was a bit disappointing to me.

Capterra verified review by
Mike K. Online Marketing Consultant Marketing and Advertising, 1-10 employees
Can do with more customization in things like the automated email notifications and date range views of reports.

Capterra verified review by
Tarek R. Head of Digital Marketing and Advertising, 11-50 employees
With a little big of learning (which my rep was SO helpful with), this software is pretty much plug and play for great dashboards with all kinds of customizable metrics.

Capterra verified review by
Morgan C. Director of Marketing Retail, 11-50 employees
Can be expensive as there is a limitation for the number of widgets per dashboard and the software is priced by number of dashboards per plan.

Capterra verified review by
Eva J. E-Commerce Retail, 1-10 employees
FAQs
All your questions answered. And if you can’t find it here, chat to our friendly team.
Is Whatagraph a marketing reporting platform?
Yes, Whatagraph has advanced data visualization functionality, but it’s much more than just dashboard software. It’s an all-in-one platform that allows you to connect data from scattered sources, organize it for faster insights, visualize, and automate the way you share reports and dashboards.
Who is Whatagraph for?
Whatagraph is ideal for marketing agencies and businesses who struggle with any of these pain points:
- Clunky, slow, and overly complex tool stack. Things falling apart, connectors breaking off, need to transform data in one place, visualize in another. Data process needs managing and maintaining.
- Data chaos, siloed and scattered data from all the sources and campaigns. Lack of focus on what really matters - strategy and execution.
- It's tough to connect, aggregate, and organize all the data without an advanced skillset, tech knowledge, or involving data professionals. Hence, tough to uncover insights and see a holistic view of performance.
- Data visualization for analysis and reporting involves a lot of time and hassle, hard to set up, tough to get decent and clear visual results.
- Data processes eat up a lot of time and resources.
- Hard to scale the existing stack of tools for more clients or more campaigns.
- Data accuracy is an issue with existing stack of tools being unreliable. Low confidence in the data they have.
- Reports do not resonate with clients or stakeholders.
Is Whatagraph a good DashThis alternative?
Yes, Whatagraph is a powerful DashThis alternative. For starters, With Whatagraph, you can create an unlimited number of reports and dashboards in any pricing plan, while DashBoard charges every dashboard you create. Whatagraph not only has more native integrations to popular marketing platforms but also allows you to connect data from any source using a custom API or export source data to Google Sheets or BigQuery first.
Are DashThis reviews mostly positive or negative?
DashThis reviews are mainly positive, with users praising the ease of use and the abundance of native integrations. However, those who moved to Whatagraph or another DashThis competitor highlight the lack of dashboard customization options, missing data organize features, and a dashboard-based pricing model.
How does DashThis pricing work?
DashThis pricing is based on the number of dashboards you can create. There are several pricing plans available starting from 3, 10, 25, and 50 to as many dashboards as you need.
When you decide how many dashboards you need, you can choose your subscription. Any plan that includes 10 dashboards or more gives you access to white-label options.
You can switch to a new plan even if you prepaid for a year and will be charged the remaining balance.
In Whatagraph, you can create as many dashboards and reports as you want, regardless of the pricing plan you choose.


Ready for insights?
It's time to focus your time on the tasks that really matter, and let us worry about your marketing analytics. Start your free 7-day trial.
- Free for 7 days
- No credit card required
- Live chat support
- Cancel anytime
No credit card required