Discover a Powerful NinjaCat Alternative
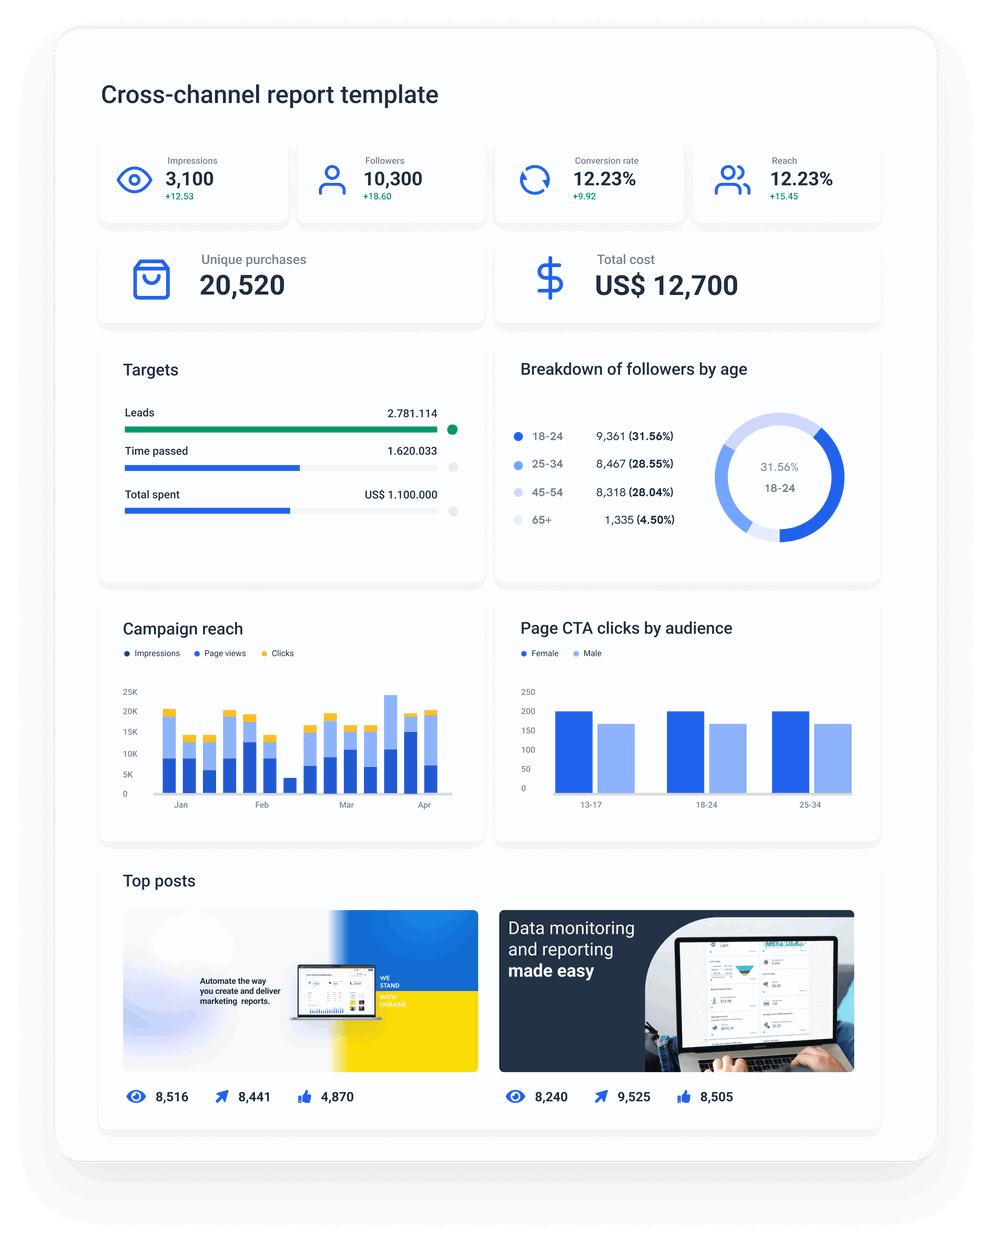
Whatagraph presents an easy-to-use, all-in-one platform to connect, organize, visualize, and share marketing data with excellent support and automation features. Upgrade to an intuitive NinjaCat alternative with a simple drag-and-drop visualization builder with pre-made widgets and plenty of customizable features. Share live dashboard links so your clients and stakeholders can explore the data on their side.
- 45+ marketing channels

- Live chat customer support
- Live dashboard sharing
No credit card required


3 Reasons to Choose Whatagraph as Your NinjaCat Alternative
No crashes and losing your progress
Users say that NinjaCat crashes often, and their progress is lost since there’s no autosave. There are also speed issues. With Whatagraph you don’t need to worry about crashes or losing your progress. Even a heavy report with 10 sources and 100 widgets takes seconds to load.
No data knowledge needed
In NinjaCat, you must understand databases and learn how to work with massive data tables. You must also switch between your data sets and visualization to make edits. Whatagraph doesn’t require tech knowledge or data analytics skills to prepare data for visualization.
Visualize data without hassle
In NinjaCat, data visualization is a complex experience with many extra clicks and spaces. You must separately build templates, dashboard profiles, and reports, merge things, and assign them to clients. Whatagraph has one intuitive drag-and-drop visualization environment where all changes you make apply immediately.
A One-stop Shop Alternative to NinjaCat
A fast loading intuitive platform for all your marketing data needs that's easy to navigate.
 | ||
|---|---|---|
| Connect | ||
| Native integrations with popular marketing sources |  | |
| Google Sheets and data warehouse integrations | | |
| Organize | ||
| Data organization capabilities | | |
| Intuitiveness and ease-of-use | |  |
| Connected “organize” and “visualize” environments | | |
| Visualize | ||
| Data visualization | | |
| Intuitiveness and ease-of-use | | |
| Your reports and dashboards in one easy-to-navigate environment | | |
| Reusable assets | | |
| Speed, stability, and additional points | | |
| Share | ||
| Sharing PDFs, sending out report emails or live links | | |
| Data export in spreadsheet format | | |
| Data transfer to a warehouse | | |
NinjaCat Pros and Cons – What Do Users Say?
It is an all-in-one solution for analytics, KPI monitoring, reporting, and call tracking. It makes visualizing the data across a larger amount of clients and their disparate campaigns easy and helpful.

Capterra verified review by
Graeme G. Content Strategist
Creating templates can be difficult to create if you haven't had any training on the software and data may not pull in time for critical deadlines.

Capterra verified review by
Jeremy F. Sr. Account Manager Accounting, 51-200 employees
It allows us to share with our clients their total ad spend & total conversions. Tracking & notifing for phone calls allows us to show our clients that the program we run is successful.

Capterra verified review by
Rajiv A. director of client relations Marketing and Advertising, 1-10 employees
I think that the biggest disadvantage is the filtering options. If you are working with a bunch of accounts and need to sort them out, there is currently not many ways to do this. The biggest problem is the loading times. It loads very slowly if there is a bunch of data.

Capterra verified review by
Brandon L. Data Specialist Marketing and Advertising, 11-50 employees
There's quite a bit of data customization available within the template. This was a huge selling point for us. We require the ability to combine datasets, to filter and manipulate data in order to provide reports and analysis tailored for each client.

Capterra verified review by
Benjamin B. Digital Channels Manager Marketing and Advertising, 1-10 employees
There are a few minor inconveniences that we've learned to adapt to while using NinjaCat. One is that monitoring dashboards are not updated in real time. So, data you or a client is seeing is only accurate up to the previous day.

Capterra verified review by
Verified Reviewer Internet Marketing Specialist Marketing and Advertising, 11-50 employees
FAQs
All your questions answered. And if you can’t find it here, chat to our friendly team.
Who is Whatagraph for?
Whatagraph is ideal for marketing agencies and businesses who struggle with any of these pain points:
- Clunky, slow, and overly complex tool stack. Things falling apart, connectors breaking off, need to transform data in one place, visualize in another. Data process needs managing and maintaining.
- Data chaos, siloed and scattered data from all the sources and campaigns. Lack of focus on what really matters - strategy and execution.
- It's tough to connect, aggregate, and organize all the data without an advanced skillset, tech knowledge, or involving data professionals. Hence, tough to uncover insights and see a holistic view of performance.
- Data visualization for analysis and reporting involves a lot of time and hassle, hard to set up, tough to get decent and clear visual results.
- Data processes eat up a lot of time and resources.
- Hard to scale the existing stack of tools for more clients or more campaigns.
- Data accuracy is an issue with existing stack of tools being unreliable. Low confidence in the data they have.
- Reports do not resonate with clients or stakeholders.
Is Whatagraph a data integration tool?
Yes, Whatagraph has data integration functionality but it also has advanced native data visualization, no-code organization features, and the ability to automatically share dashboards and reports with clients and stakeholders.
How does NinjaCat pricing work?
NinjaCat doesn’t offer fixed pricing plans, and no information can be found on their website. The pricing is determined by the user needs during the demo call with their account executives.
Is Whatagraph a strong NinjaCat competitor?
Yes, Whatagraph is a strong NinjaCat competitor. Unlike NinjaCat which takes some effort to master, Whatagraph is incomparably easier to use and on top of it loads much faster.
Adding and managing sources is also much more intuitive in Whatagraph, as you’re welcome to create as many folders for your dashboards and reports as you want.
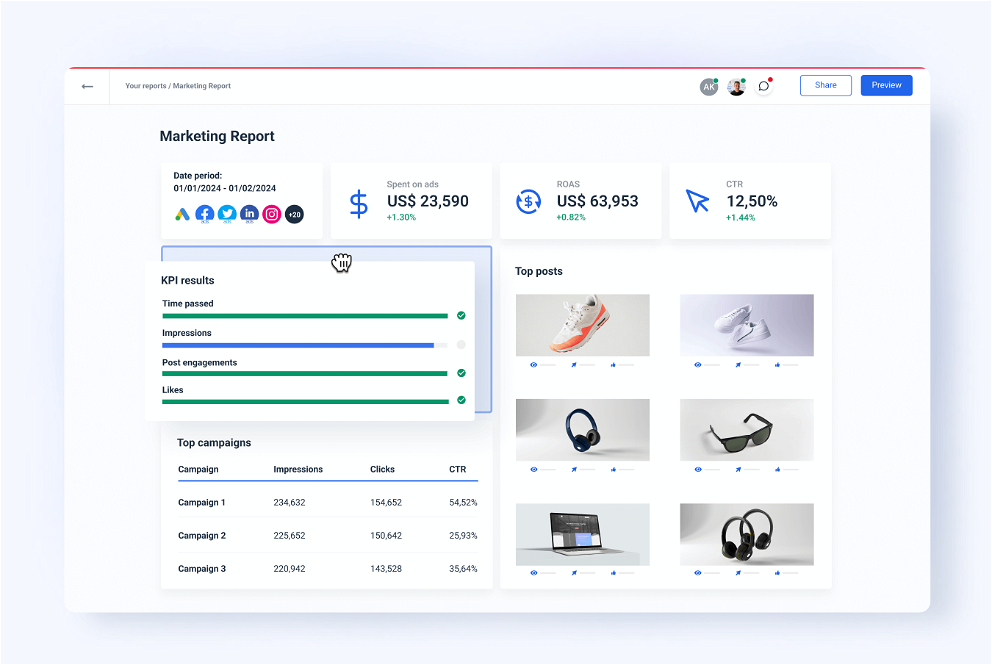
Whatagraph also allows you to save every visualization you create as a template for future use. Finally, you can share live links to Whatagraph dashboards while NinjaCat only allows sharing in PDF format.
What does NinjaCat do?
The NinjaCat product details from GetApp describe it as an “all-in-one reporting, call tracking, and call monitoring solution for tracking pay-per-click campaigns, SEO, AdWords, and more for digital marketing agencies.”
Are NinjaCat reviews mainly positive or negative?
NinjaCat reviews are mainly positive, with users praising the data customization options, abundance of sources, and stellar customer service. However, those who moved to Whatagraph or other tools point out that NinjaCat often slows down. It takes more clicks and spaces to complete any desired action, and the data visualization feature is not as straightforward and intuitive.


Ready for insights?
It's time to focus your time on the tasks that really matter, and let us worry about your marketing analytics. Start your free 7-day trial.
- Free for 7 days
- No credit card required
- Live chat support
- Cancel anytime
No credit card required