Facebook Ads Report Template
Running Facebook Ads campaigns and want to keep an eye on CTR, CPC, or any other key metrics? Our Facebook Ads report template lets you combine multiple data sources and monitor each channel’s performance in one report! Connect your clients’ accounts and watch your Facebook Ads report auto-populate with the most recent data. Automate the way you share Facebook ad performance reports as scheduled emails.


Simplify reporting with a customizable Facebook Ads report template
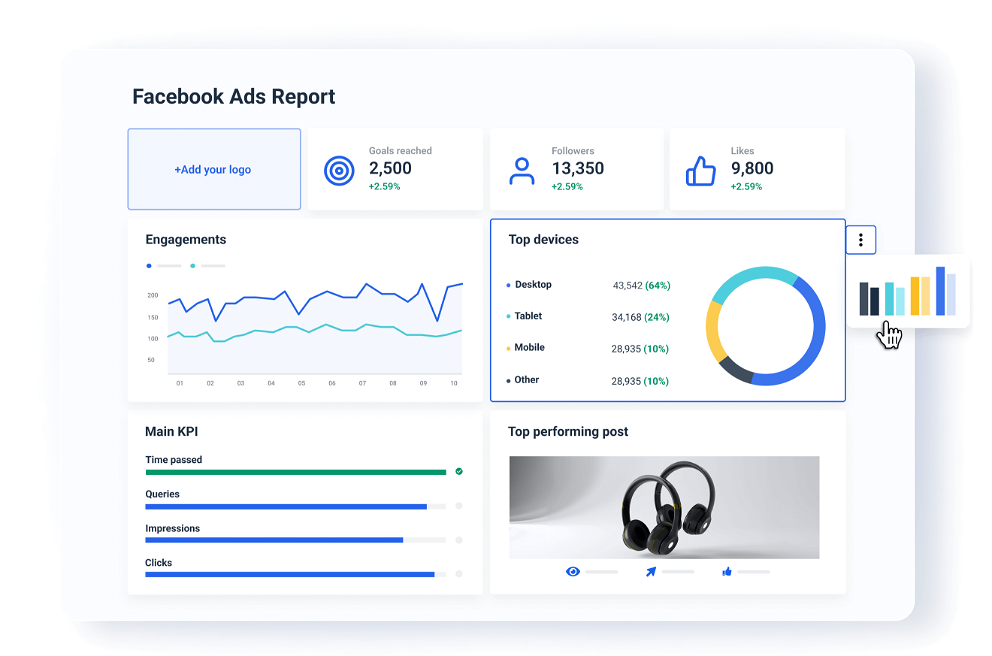
Don’t settle for standardized default report themes, slides, or spreadsheets. Create your own custom reports in minutes using this Facebook marketing report template. With Whatagraph, you can easily change the color, theme, and widgets to match your agency's brand. Create engaging campaign performance reports and show your clients you care.
Save time with fully automated Facebook Ads reports
Send automated Facebook advertising reports without pressing the ‘send’ button. Once you connect the Facebook Ads account to this template, select the sending frequency, decide on the time period and number of recipients, and automate the whole reporting process. Easily keep your team and clients updated on the most important Facebook Ads data, including CPM, number of received link clicks, ROAS, and website conversions.

Create an engaging Facebook Ads report in minutes
Whether you have a monthly meeting or a call with your client, create a comprehensive Facebook Ads report and answer all the questions that may come up. Present data that gives an overview of your ad campaign performance. Highlight ad impressions, relevance score, cost per result, and audience demographics. Whatagraph shows you all of these details in a single report. Easily change and adapt our Facebook Ads reporting template to your needs. Add and remove widgets, apply filters, and insert custom comments and annotations.
Report all Facebook Ad campaign KPIs & metrics in one place
Get an in-depth view of your Facebook ad account performance and track ad set analytics. Use our Facebook Ad reporting template to see how each campaign is doing in terms of CPM, the number of received link clicks, ROAS, and ad spend. Use our organize feature to present your Facebook insights the way you want them. Develop better and more optimized online marketing strategies with aggregated data - from Facebook Ads and many other platforms.
All reporting features your agency needs
45+ data sources
Create a true cross-channel digital marketing dashboard in Whatagraph. Over 45 integrations for your cross-channel marketing campaigns.
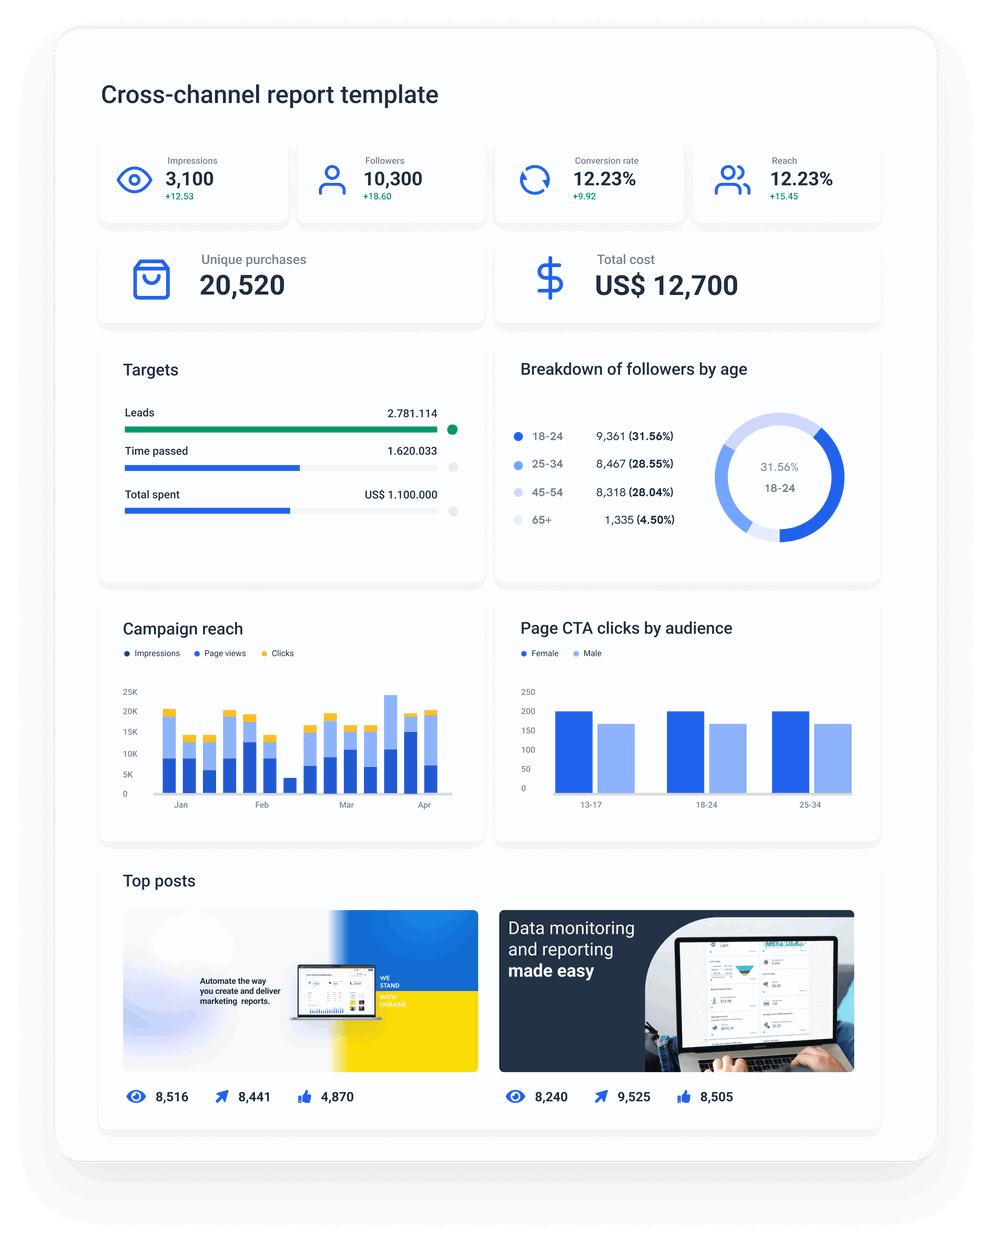
Cross-channel reports
Combining cross-channel data is intuitive and takes a few clicks. Create a single client report for all channels instead of one report for each.
Full report automation
Schedule your reports at desired intervals or share a live link to a report so your clients can check for updates at any moment.
White-label reports
Customize colors and logos in each report to align it with your agency’s or clients’ branding and style.
Powerful Facebook Ads reporting with Whatagraph
Choose from 300+ metrics to easily report on your Facebook Ads performance. Combine metrics from multiple integrations and create cross-channel reports.
What is a Facebook Ads report template?
A Facebook Ads report template is a preset document that allows marketing agencies to quickly and accurately connect data from their clients’ Facebook Ads accounts, visualize the critical KPIs and metrics, and enable easy sharing. In the case of Whatagraph’s templates, apart from Facebook Ads accounts, you can enrich the report with data from any 45+ integrated sources and save any customization as a new user template.
Why should you use our Facebook Ads report template?
Our Facebook Ads report template transforms the torrent of data from Facebook Ads Manager into clear visualizations and actionable information by displaying metrics that matter and highlighting your agency’s expertise. Metrics are updated automatically, so you will never waste another minute on manual reporting. Save time, impress clients, and deliver the digital marketing results they dream of.
This way, your time is spent creating new campaigns and winning more business instead of exporting performance metrics from Facebook Ads Manager data into Excel or Google Data Studio to build reports manually.
This Facebook ad campaign report template automatically tracks and reports on essential Facebook Ads data, including ads, ad sets, campaigns, and demographics data, in user-friendly reports designed to impress the end reader. You can easily present both top-level overviews and detailed insights into your client’s Facebook ad campaigns.
What can our Facebook Ads report template tell you?
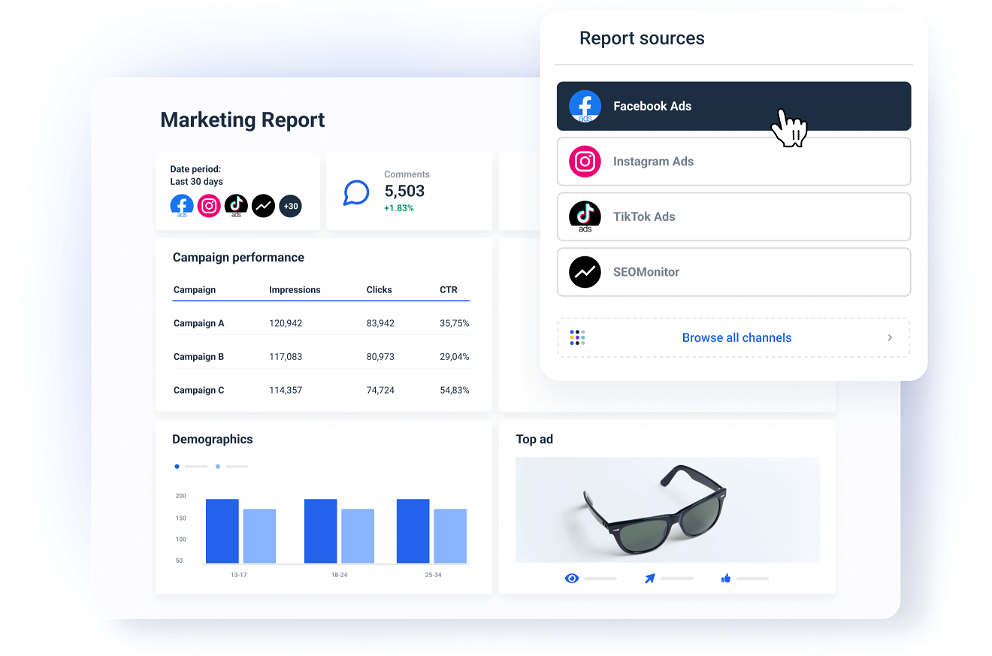
Monthly overview
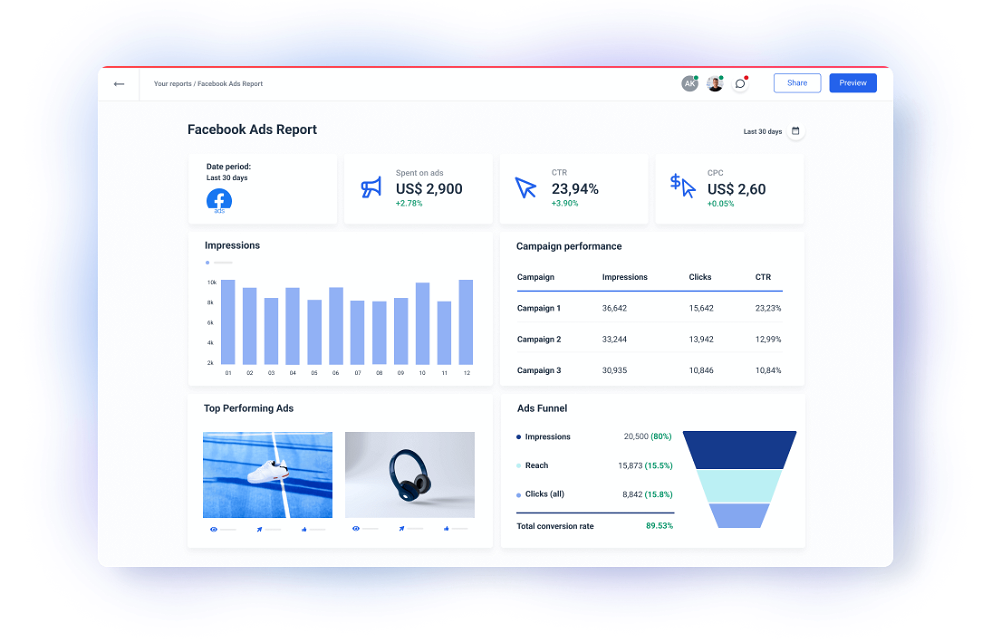
At the very top, your clients get a summary of the most important metrics and events for the previous month — or any other period, for that matter — together with your expert insights and comments. This section includes a brief overview of the monthly KPI goals and the most important metrics, such as total spend, cost-per-click (CPC), and click-through rate (CTR).

Thanks to our media widget, you can showcase the top-performing ad creative. Finally, you can use the text widget to offer insights, comments, and recommendations for your Facebook advertising strategy in the coming months. This is where you can explain any significant campaign events in plain English so your clients know the major changes.
Ads performance
A successful Facebook Ads campaign often involves running multiple ads simultaneously. The ads performance section of the Facebook campaign report template displays the creatives of the ads you are running along with important performance metrics such as the number of clicks on each ad, CTR, frequency, reach, and the total amount spent on that ad.

This section of a Facebook Ads audit template shows your clients which Facebook ad performs best so you can base your future ads on a similar creative and message. If you want to display cross-channel insights, you can easily connect other data sources to this template and compare ad performance from other social media.
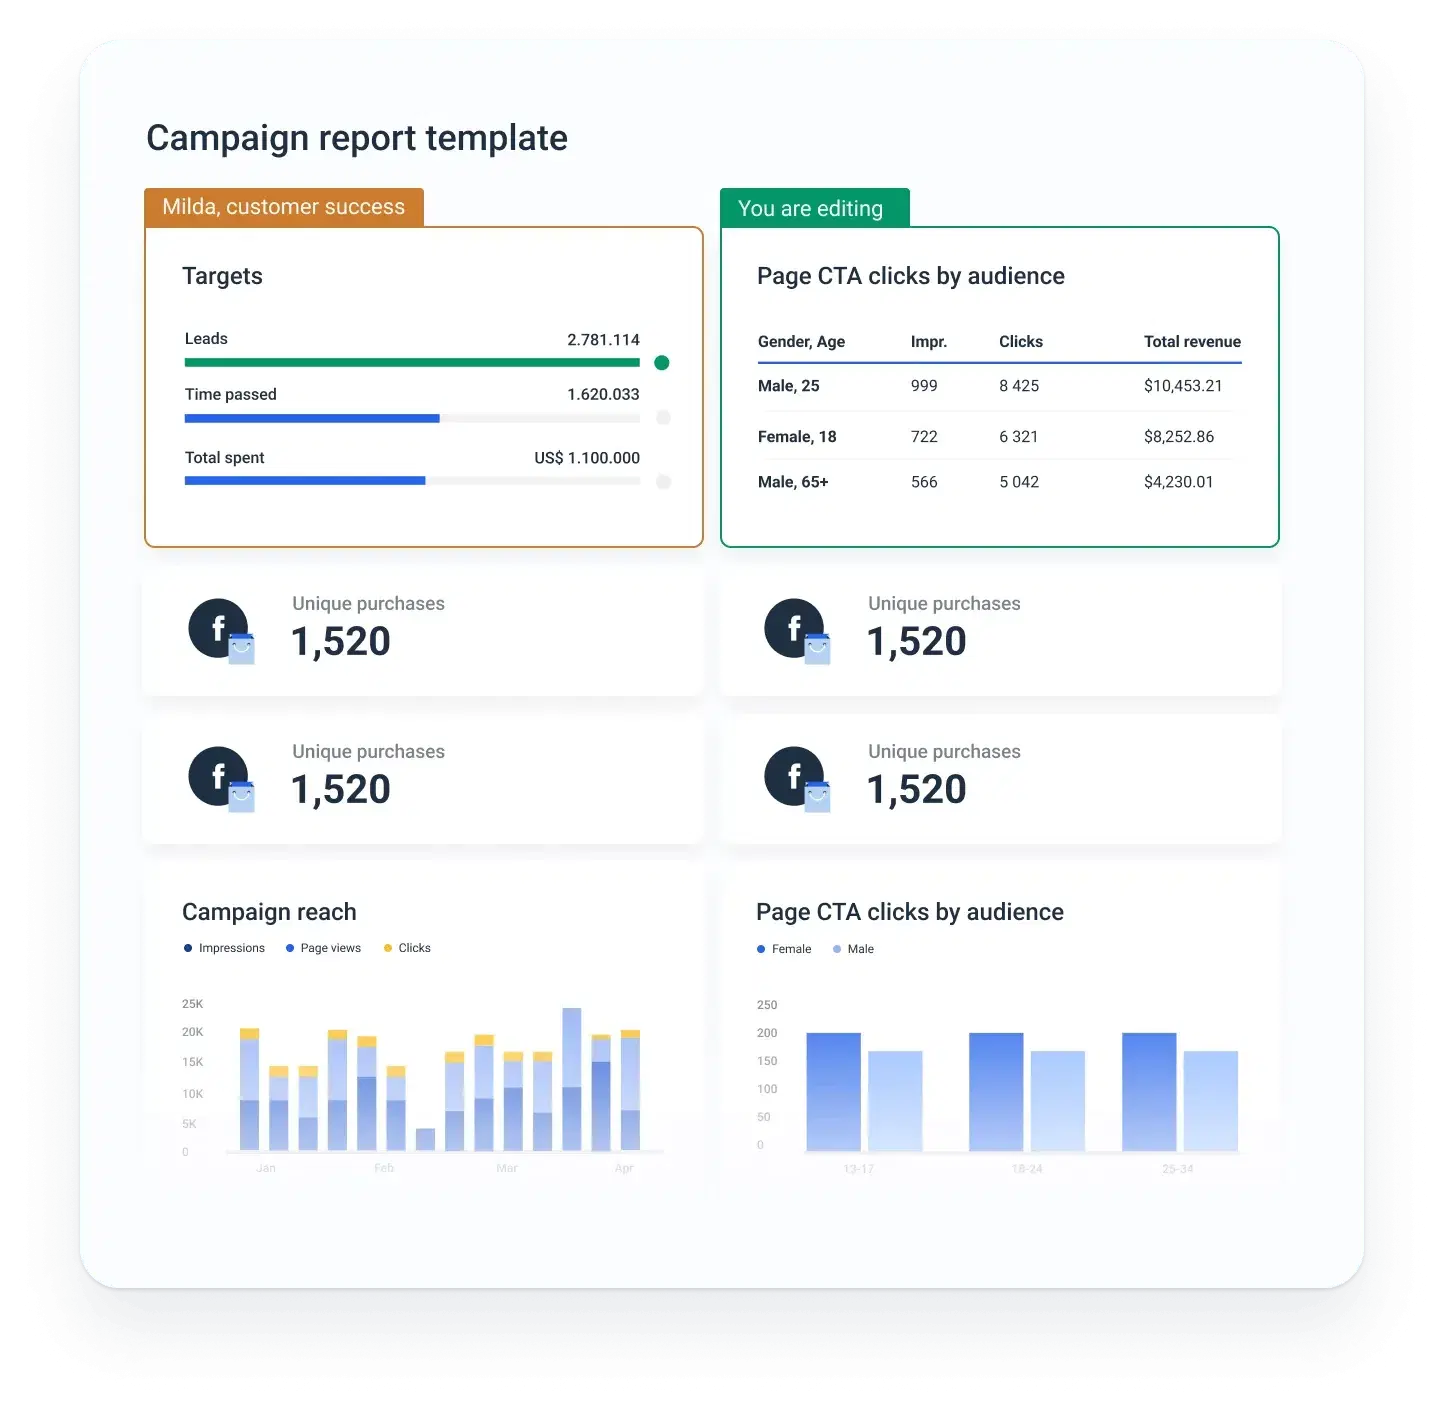
Conversions
As a rule, only the best Facebook ads convert. The higher the number of conversions, the better your campaign is performing. Our Facebook reporting template displays conversions in an easy-to-read funnel alongside the conversion rate and cost-per-conversion widgets. This way, your clients clearly know how much each conversion costs. Add an ad spend widget, and you can easily make the case that spending more money on a campaign increases the total ROI of the campaign.

Demographics
The audience insight section of our Facebook Ads report template contains valuable information you can use to optimize campaign performance. This data is a window into the audience structure — gender, age, and location, giving you the means to tailor your strategy more effectively and deliver winning results to your clients. This extra layer of information completes the picture of your campaign outcomes and plays a big role in the reach and impact of your paid media marketing efforts.

FAQs
All your questions answered. And if you can’t find it here, chat to our friendly team.
How do I create a report for Facebook ads?
The easiest way to create a report for Facebook ads is to use Whatagraph’s Facebook Ads report template. This template comes pre-loaded with useful visuals such as graphs and table widgets, and the only thing you need to do is connect your Facebook Ads account as a source. You can change and customize the existing template and save each version as your own.
How do I automate Facebook Ads reporting?
You can automate Facebook Ads reporting with a few clicks if you use our report template. When you connect your Facebook Ads account, the widgets come to life with new data. You are free to rearrange the order of widgets, add new or remove existing ones, organize data, apply filters, change metrics and dimensions, and more.
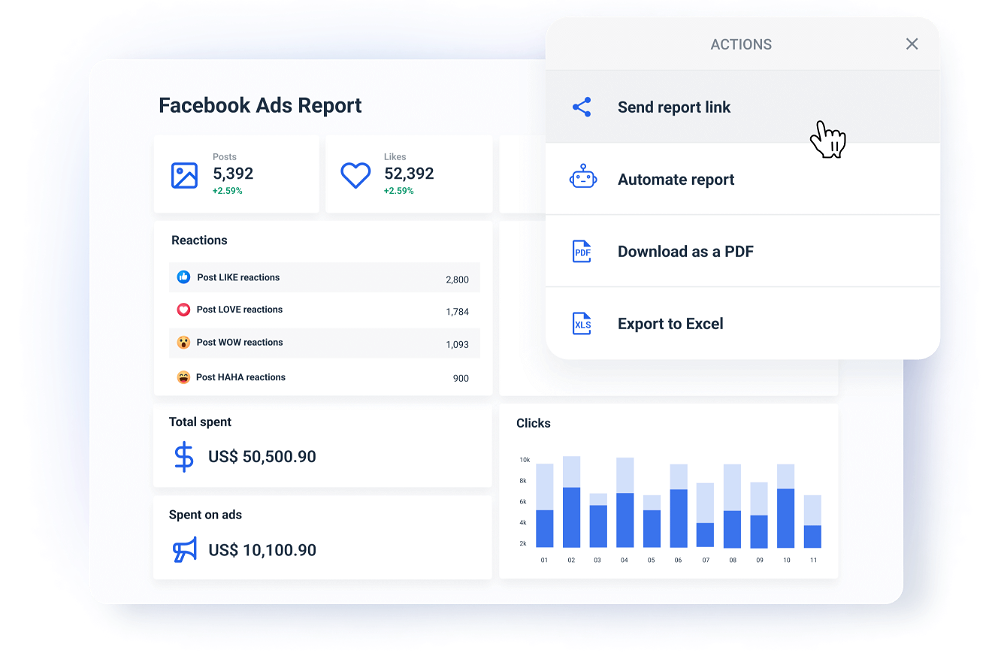
Once you’re happy with your report, click Automate report from the Actions menu, and you’ll get a pop-up window where you can enter the recipients, time of sending, frequency, and other automation details. When you automate the report, the recipients will receive a report with the latest data every time at the same time without missing a deadline.
How do I write a Facebook ad report?
You can create a Facebook ad report from a blank page or use our Facebook Ads report template and adapt it to your or your client's reporting needs.
If you’re going from scratch, start by organizing your report in sections like
1. Summary Overview
Here, you should include the reporting period, the monthly KPI goals widget, high-level metrics like total spend, CPC, and CTR, the top-performing post, and the most important insights for the reporting period.
2. Audience Section
In this section, you should present the audience distribution by gender, age, geography, and audience-related metrics such as page views and frequency — the average number of times each person saw your ads.
3. Ad Creatives Performance
Include your top-performing ad creatives via Whatagraph’s media widget, which displays key performance metrics such as link clicks, CTR, frequency, reach, and the total amount spent on that ad.
4. Conclusions and Next Steps
In this report section, you should share your thoughts on Facebook Ads performance and suggest the next steps according to your marketing strategy.
With slight adjustments, you can use this layout for any Facebook reports for clients.
What other marketing channels can I connect with Whatagraph?
Apart from Facebook Ads, you can connect all popular PPCs like LinkedIn Ads and Google Ads, social media such as LinkedIn, Instagram, and Twitter, e-commerce platforms like Shopify and WooCommerce, SEO tools like Ahrefs, Semrush, and Google Search Console, email marketing tools like Klaviyo and Mailchimp, Google Analytics 4, and CRMs like HubSpot and Salesforce.
If you can’t find the integration for your data source, connect it via a Custom API or export it to Google Sheets docs or BigQuery data warehouse and add it as a source.
Supplement your Facebook Ads report template with other useful templates
View All TemplatesNo credit card required


It’s good to be loved! Our clients are not shy about expressing it.
I made a switch from GDS and Sheets for reporting to Whatagraph, and I am saving literal hours each week on performance report creation. Our small firm actually managed to onboard 2 new clients as a result of all the time we saved on managing data and reporting. The customer service is also really helpful and easy to reach.

Capterra verified review by
Mindaugas S., Marketing Consultant
Having active customer support to help fix any issues was a big contributor, but we also really liked the ability to save templates and connect sources to multiple charts/widgets at once without having to edit them individually. And having the grid layout is much easier to stay consistent with than the free form setup that Data Studio has.

Capterra verified review by
Nico T., Media Planner
The system has standard templates that are easy and fast to use. Also you can build your own report with lightning speed. It is very easy to use, has a lot of integration, and let get started very fast.

Capterra verified review by
Rasmus Bernt K., External Senior Management Consultant
We love Whatagraph - we would definitely recommend and our account manager is great! I love how easy this tool is to use, everyone on the team finds it much more user-friendly than other dashboards. Integration was easy, we sent some example reports to the team who duplicated these for us. We literally had to log in and send it to our clients!

Capterra verified review by
Stephanie S., Digital Director
We are showing our clients the work that we're doing for them and this is incredibly important for our clients ROI. They want to see results and having a tool like Whatagraph that can show data from virtually every source we use is hugely important.

Capterra verified review by
John S., SEO Strategist
The tool is easy to use; you do not need to have development resources. Even my junior project managers are capable of making campaign reports in minutes. There are a lot of pre-made templates you can use as well as many pre-made widgets.

Capterra verified review by
Erman E., Marketing Specialist
Really easy to connect data sources within the tool. The library of report templates has been helpful. The customer support team has been responsive to all of our needs. Our team enjoys the simplicity of setting up the reports and how the data is presented.

Capterra verified review by
Brent N., Director of Operations
Easy to create really beautiful graphs and reports which can help other team members to understand the most important takeaways. I especially like the automated report function, so I don't have to check on the same thing repeatedly.

Capterra verified review by
Orsolya S., Online Marketing Manager
Need more help with getting started?
We can set up your report campaign for you!
Ready for insights?
It's time to focus your time on the tasks that really matter, and let us worry about your marketing analytics. Start your free 7-day trial.
- Free for 7 days
- No credit card required
- Live chat support
- Cancel anytime
No credit card required