Facebook Dashboard Template
Use this Facebook dashboard template to visualize your key Facebook Page metrics in one place with a few clicks. Whatagraph’s ready-to-use dashboard template comes with the essential Facebook marketing metrics, while the data populates automatically with the latest values. Connect your client’s Facebook account for fast and accurate takeaways and present the campaign performance results according to your client’s needs. Share the Facebook dashboard via live links for real-time on-demand view.


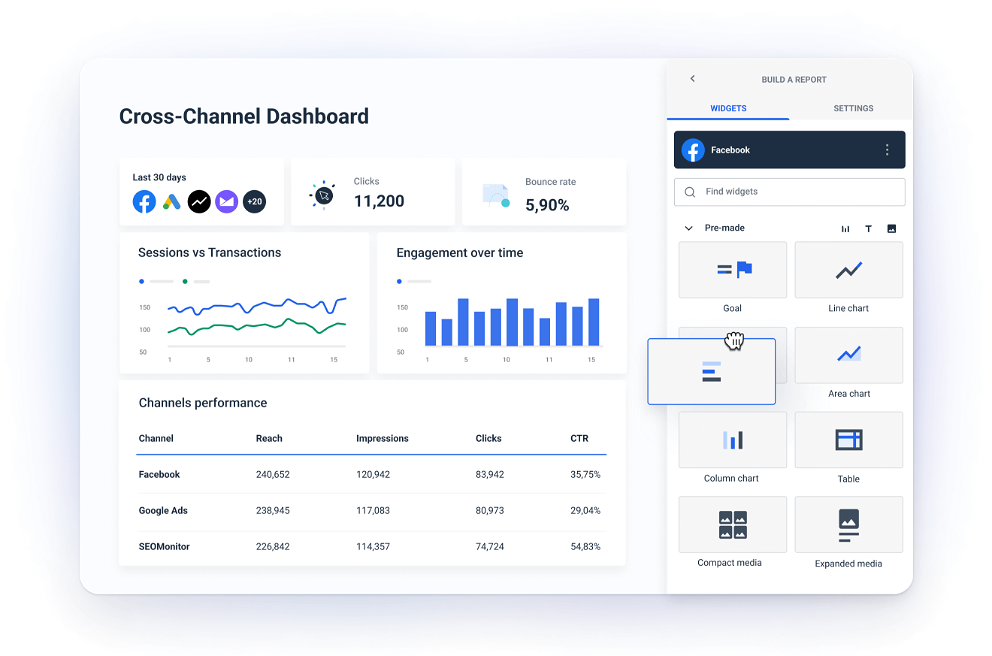
Pre-built Facebook analytics dashboard to monitor and share all your organic performance
Track Facebook engagement across multiple accounts
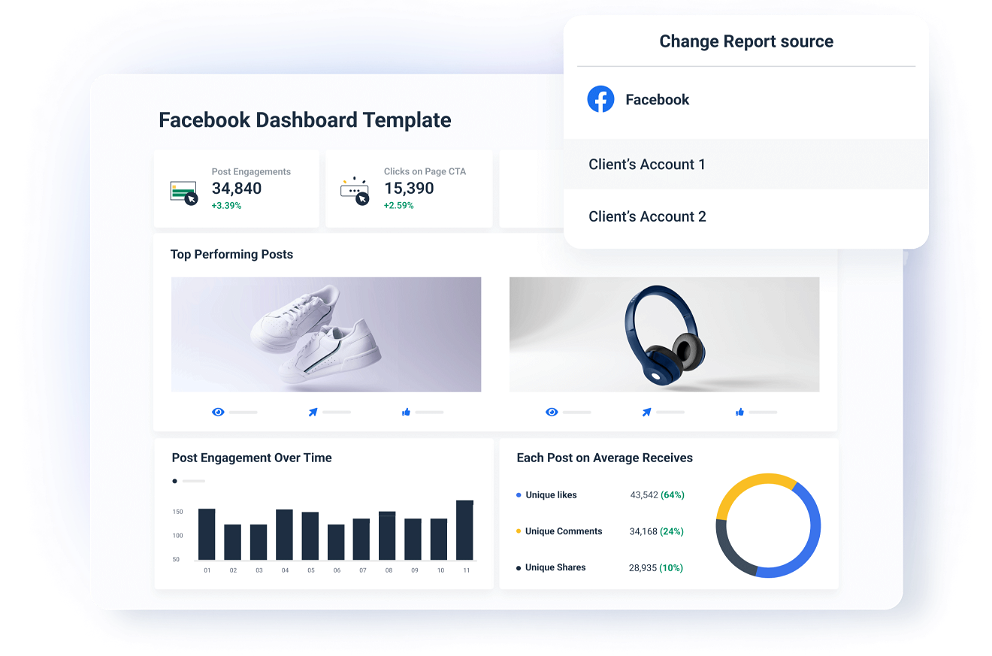
Whether you use Whatagraph for your business needs or inform your clients, our Facebook insights dashboard has everything you need to share Facebook performance results. Connect your or your client’s account and Facebook data is pulled automatically in your template — no need to code or set up the connector. Track your page and post engagement in the same place. Make decisions on content based on the actions of your audience. See the share of unique interactions with your page. Evaluate the effectiveness of your calls to action. Monitor multiple Facebook accounts or campaigns in one tab using the Overview feature.

All Facebook KPIs and metrics in one dashboard
Want to know how your Facebook account is performing? Try Whatagraph and analyze all Facebook campaign performance metrics in a single dashboard. Highlight your campaign results in our Facebook Page insights dashboard to quickly identify the effectiveness of your social content. Measure real-time performance data to recognize key trends and customer behavior patterns. Get a quick grasp on your demographics. Learn who your target audience is, how many visitors reach you organically, what interests them, and what they click on your page.
Save hours with cross-channel insights
Look at the metrics of your top-performing posts without logging into your Facebook page analytics. Learn what content drives your page and make quick improvements. Our actionable Facebook analytics dashboard comes pre-loaded with drag-and-drop widgets that you are free to rearrange, remove, and add new ones. Choose a metric and dimension for every table, graph, and chart, and apply filters to present the data you need. Bring together metrics from other social media channels for quick and easy cross-channel insights and a complete view of your social marketing strategy. Save every dashboard or widget you create as a new template. Link multiple templates and edit them all in bulk.
All dashboard features your agency needs
45+ data sources
Create a true cross-channel digital marketing dashboard in Whatagraph. Over 45 integrations for your cross-channel marketing campaigns.
White-label dashboards
Customize colors and logos in each dashboard to align it with your agency’s or clients’ branding and style.
Live dashboards
Securely share interactive access to your dashboard at any time from anywhere.
Cross-channel insights
Include data from different sources into the same widgets or dashboards with a few clicks. Provide a full picture of your campaigns’ success.
Powerful Facebook Page dashboards with Whatagraph
Choose from 90+ metrics to easily track your Facebook Page performance. Combine metrics from multiple integrations and create cross-channel dashboards.
What is a Facebook dashboard template?
A Facebook dashboard template is a dynamic display that allows marketing agencies to quickly and accurately connect data from their clients’ Facebook Page accounts, visualize the critical KPIs and metrics, and enable easy sharing via live links. In the case of Whatagraph’s templates, apart from Facebook Page accounts, you can enrich the dashboard with data from any 45+ integrated sources and save any customization as a new user template.
Why do you need a Facebook dashboard?
One of the biggest pain points for marketing agencies today is that they spend a lot of time collecting data and creating dashboards manually or using inadequate tools. Another problem is that native Facebook analytics produces an overwhelming volume of data. This data overload through Facebook Insights makes it hard for marketers to focus on problematic areas and spot opportunities for improvement.
However, in our experience, having a lot of data is an advantage — if you have a powerful Facebook dashboard template that you can use to measure the performance of your social media strategy in specific areas. Our Facebook dashboard automatically updates with the latest real-time metrics from all connected sources. You don’t have to log in and out of multiple accounts. Share it with your clients, and they can always check their page performance without fuss, calls, or email requests.
What can our Facebook dashboard tell you?
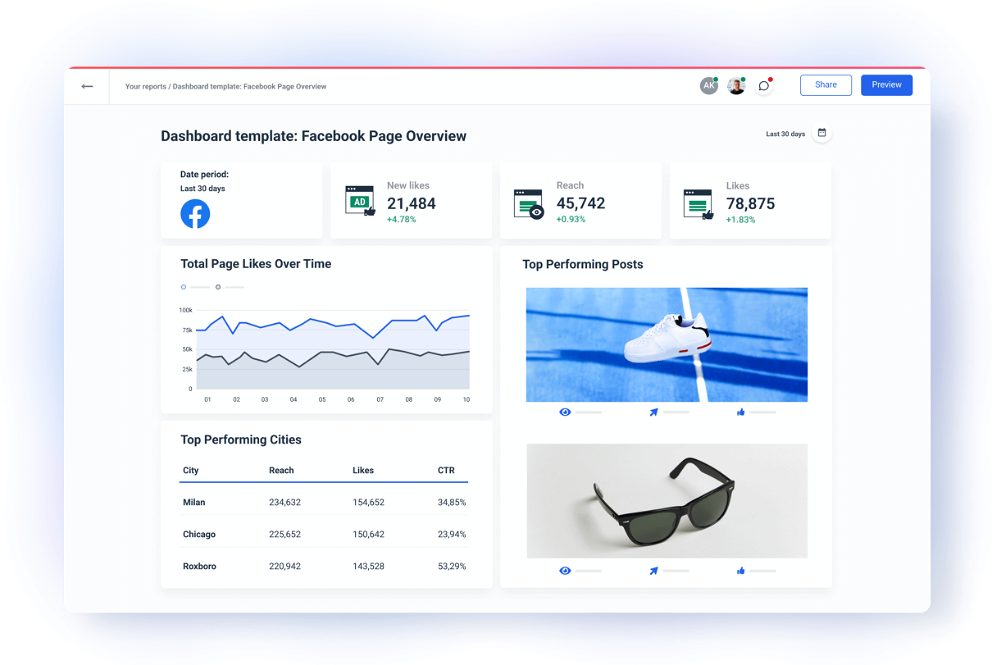
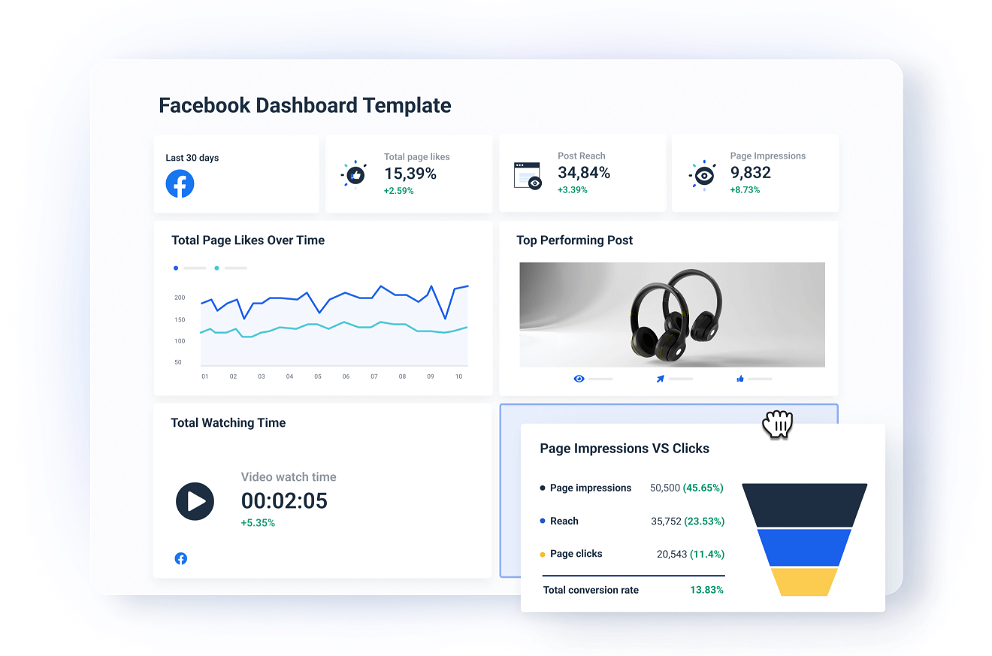
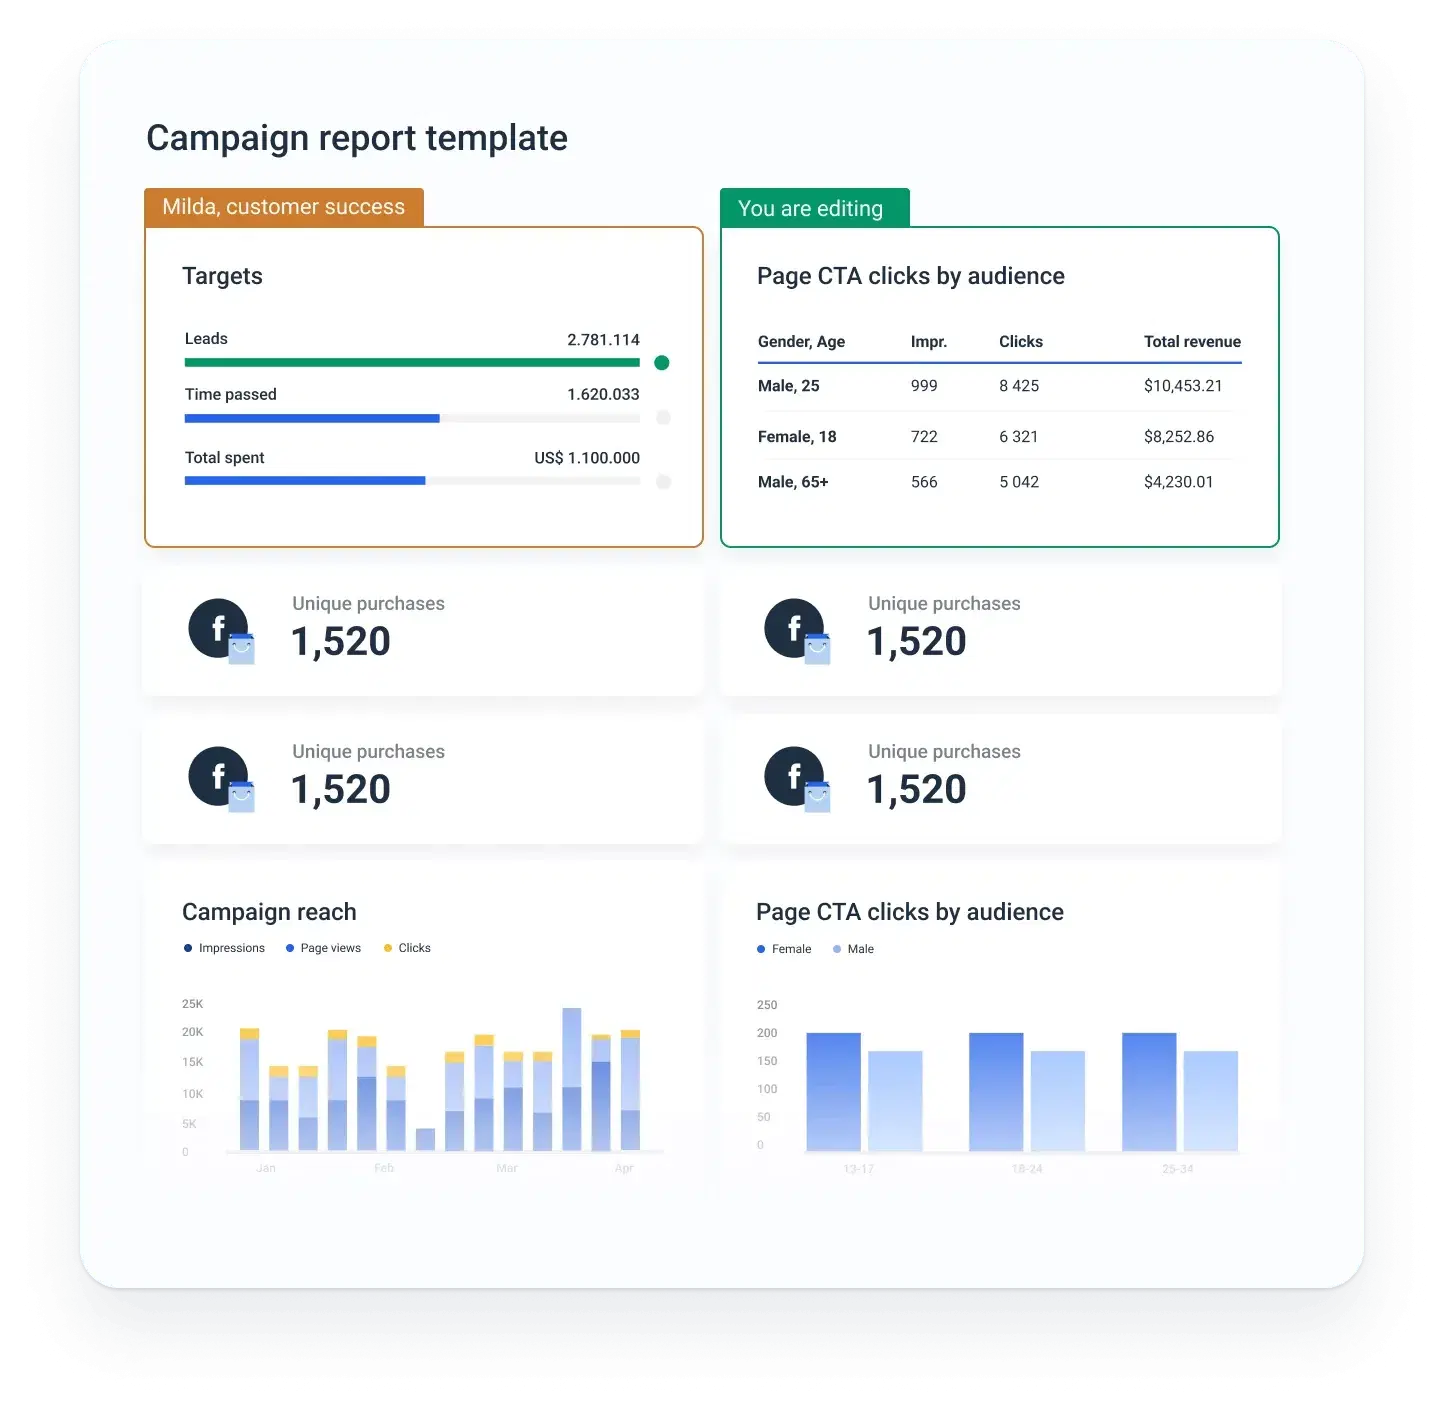
Impressions and reach
Reach on Facebook tells you how many unique visitors saw any type of content on your Facebook page. This is not to be confused with impressions, which also include multiple views from the same person. Analyzing total reach can reveal what sort of online presence your strategy is driving, and reach also includes the client’s brand awareness. The organic reach is based on hundreds of factors, but the most important ones used by Facebook include a user’s previous interaction with your page, the date of your posts, previous negative feedback, and the interaction of visitors with your content. This is why organic reach can identify poor or quality interactions with your page content.

Post engagement
Measure the effectiveness of your content through shares, reactions, comments, and clicks on images, posts, videos, and links. This Facebook dashboard template allows you to compare and analyze engagement over time and see the number of interactions the page generates monthly, weekly, or daily. This information can tell you and your clients what content resonates with their target audience. If the visitors are not engaging with the page as expected, you need to adjust your content strategy to match their interests.

Video views
By analyzing the Facebook video metrics in this dashboard, you can see what videos on your client’s page get the most views and how long each video was watched. You can also see how many people have watched videos longer than 3, 10, or 30 seconds, which tells you which videos are most interesting to your target audience.
FAQs
All your questions answered. And if you can’t find it here, chat to our friendly team.
Does Facebook have a dashboard?
Yes, Facebook has a dashboard that is accessible through the Manage menu. The native Facebook dashboard has two parts: Progression — which you can use to track your progress as you take key steps to achieve your goals, and Performance — a summary of your Page performance over the last 90 days, including reach, engagement, net followers, and 3-second video views can use to view insights, manage your platform, and find resources.
How do I create a Facebook professional dashboard?
The easiest way to create a Facebook professional dashboard is with Whatagraph. Simply sign up for your free trial and pick the dashboard template from the folder. You can then connect your Facebook account and watch as the data gets populated right before your eyes. You can easily edit the dashboard by adding more widgets or replacing those you don’t need at the moment. Save the new dashboard as your own template.
What are the top Facebook insights metrics you need to track?
It depends on your campaign goals. However, we suggest tracking the following key metrics: engagement rate, follower growth, click-through rate (CTR), cost-per-click (CPC), cost-per-mille (CPM), cost-per-conversion (CPC), conversion rate, and others.
What other marketing channels can I connect with Whatagraph?
Apart from Facebook, you can connect to all popular social media, such as LinkedIn, Instagram, Twitter, PPCs like LinkedIn Ads and Google Ads, e-commerce platforms like Shopify and WooCommerce, SEO tools like Ahrefs and Semrush, email marketing tools like Klaviyo and Mailchimp, CRMs like HubSpot and Salesforce, and Google Analytics 4.
If you can’t find the integration for your data source, connect it via a Custom API or export it to Google Sheets docs or BigQuery data warehouse and add it as a source.
Supplement your Facebook dashboard template with other useful templates
View All TemplatesNo credit card required


It’s good to be loved! Our clients are not shy about expressing it.
I made a switch from GDS and Sheets for reporting to Whatagraph, and I am saving literal hours each week on performance report creation. Our small firm actually managed to onboard 2 new clients as a result of all the time we saved on managing data and reporting. The customer service is also really helpful and easy to reach.

Capterra verified review by
Mindaugas S., Marketing Consultant
Having active customer support to help fix any issues was a big contributor, but we also really liked the ability to save templates and connect sources to multiple charts/widgets at once without having to edit them individually. And having the grid layout is much easier to stay consistent with than the free form setup that Data Studio has.

Capterra verified review by
Nico T., Media Planner
The system has standard templates that are easy and fast to use. Also you can build your own report with lightning speed. It is very easy to use, has a lot of integration, and let get started very fast.

Capterra verified review by
Rasmus Bernt K., External Senior Management Consultant
We love Whatagraph - we would definitely recommend and our account manager is great! I love how easy this tool is to use, everyone on the team finds it much more user-friendly than other dashboards. Integration was easy, we sent some example reports to the team who duplicated these for us. We literally had to log in and send it to our clients!

Capterra verified review by
Stephanie S., Digital Director
We are showing our clients the work that we're doing for them and this is incredibly important for our clients ROI. They want to see results and having a tool like Whatagraph that can show data from virtually every source we use is hugely important.

Capterra verified review by
John S., SEO Strategist
The tool is easy to use; you do not need to have development resources. Even my junior project managers are capable of making campaign reports in minutes. There are a lot of pre-made templates you can use as well as many pre-made widgets.

Capterra verified review by
Erman E., Marketing Specialist
Really easy to connect data sources within the tool. The library of report templates has been helpful. The customer support team has been responsive to all of our needs. Our team enjoys the simplicity of setting up the reports and how the data is presented.

Capterra verified review by
Brent N., Director of Operations
Easy to create really beautiful graphs and reports which can help other team members to understand the most important takeaways. I especially like the automated report function, so I don't have to check on the same thing repeatedly.

Capterra verified review by
Orsolya S., Online Marketing Manager
Need more help with getting started?
We can set up your report campaign for you!
Ready for insights?
It's time to focus your time on the tasks that really matter, and let us worry about your marketing analytics. Start your free 7-day trial.
- Free for 7 days
- No credit card required
- Live chat support
- Cancel anytime
No credit card required