Want to hear what Whatagraph is all about? It’ll definitely take much more than one blog post. But for starters, here are 10 Whatagraph features that make our marketing data platform stand out.
Want to hear what Whatagraph is all about? It’ll definitely take much more than one blog post. But for starters, here are 10 Whatagraph features that make our marketing data platform stand out.

Nov 03 2023 ● 9 min read
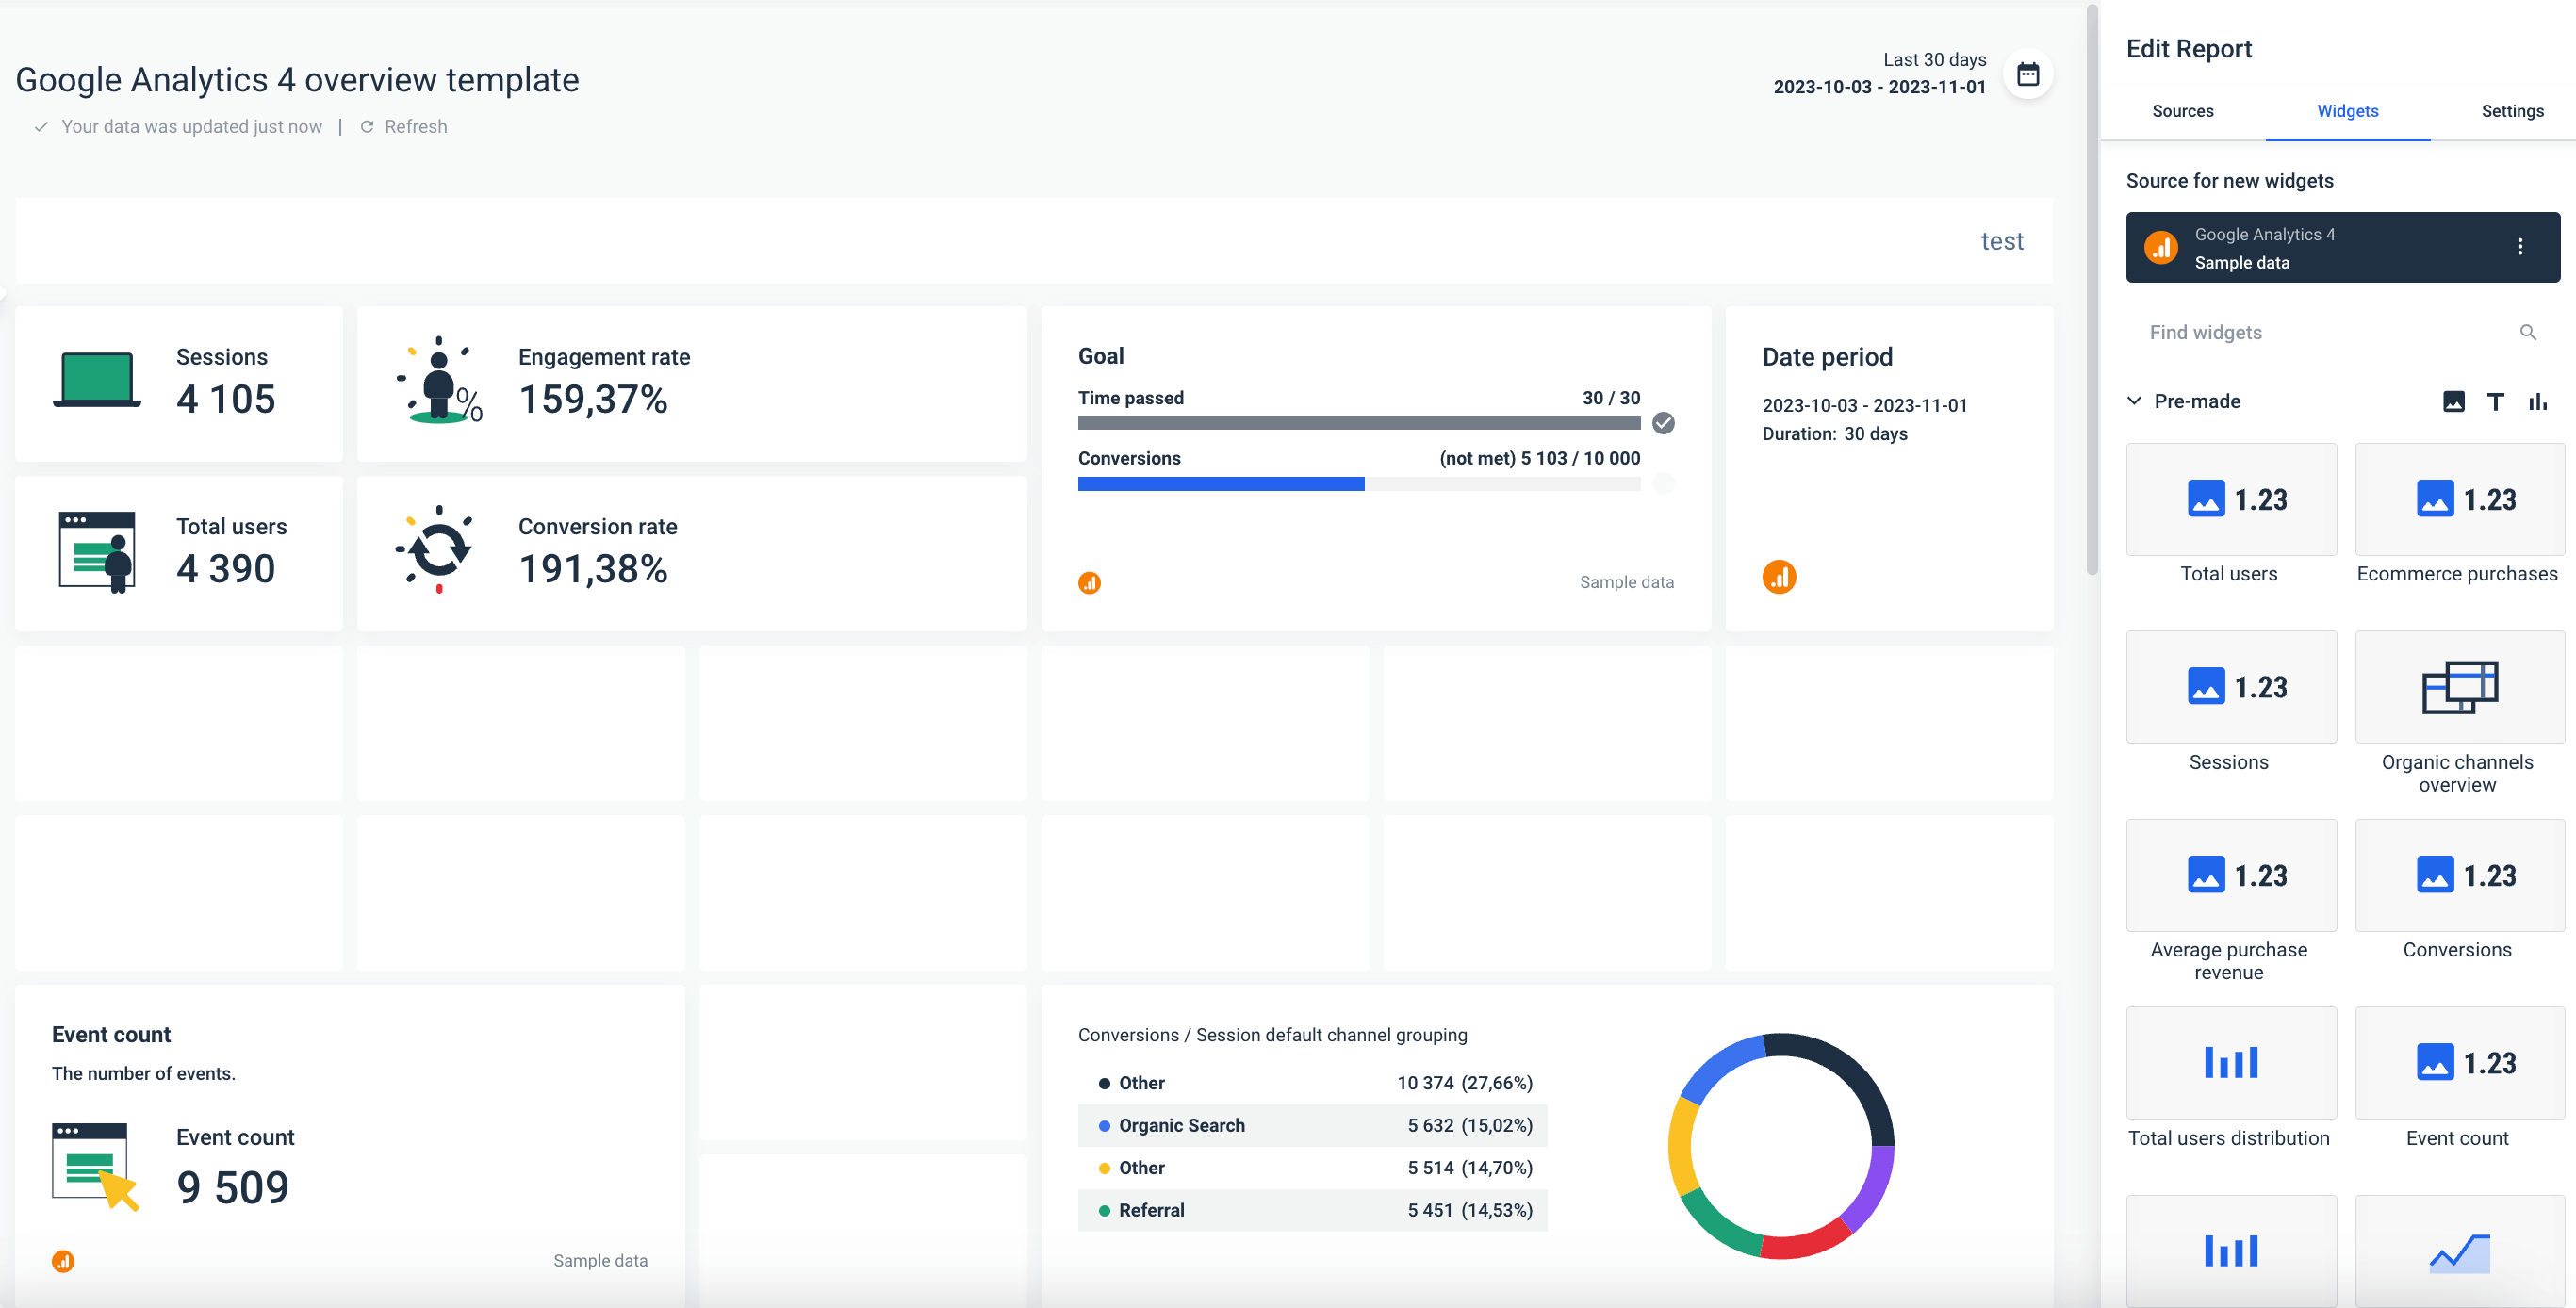
If you like building things on your own, you’ve come to the right place. Our blank report page is a marketer’s playground, allowing you to create any kind of report with your data using building blocks. As soon as you add your sources, you get a choice of widgets for different metrics.
These include single-value widgets, goal widgets, all sorts of graphs and charts, textual widgets, and tables. But apart from these pre-made widgets, you can easily build your own: Just choose the visualization type and set the source, metrics, and filters.
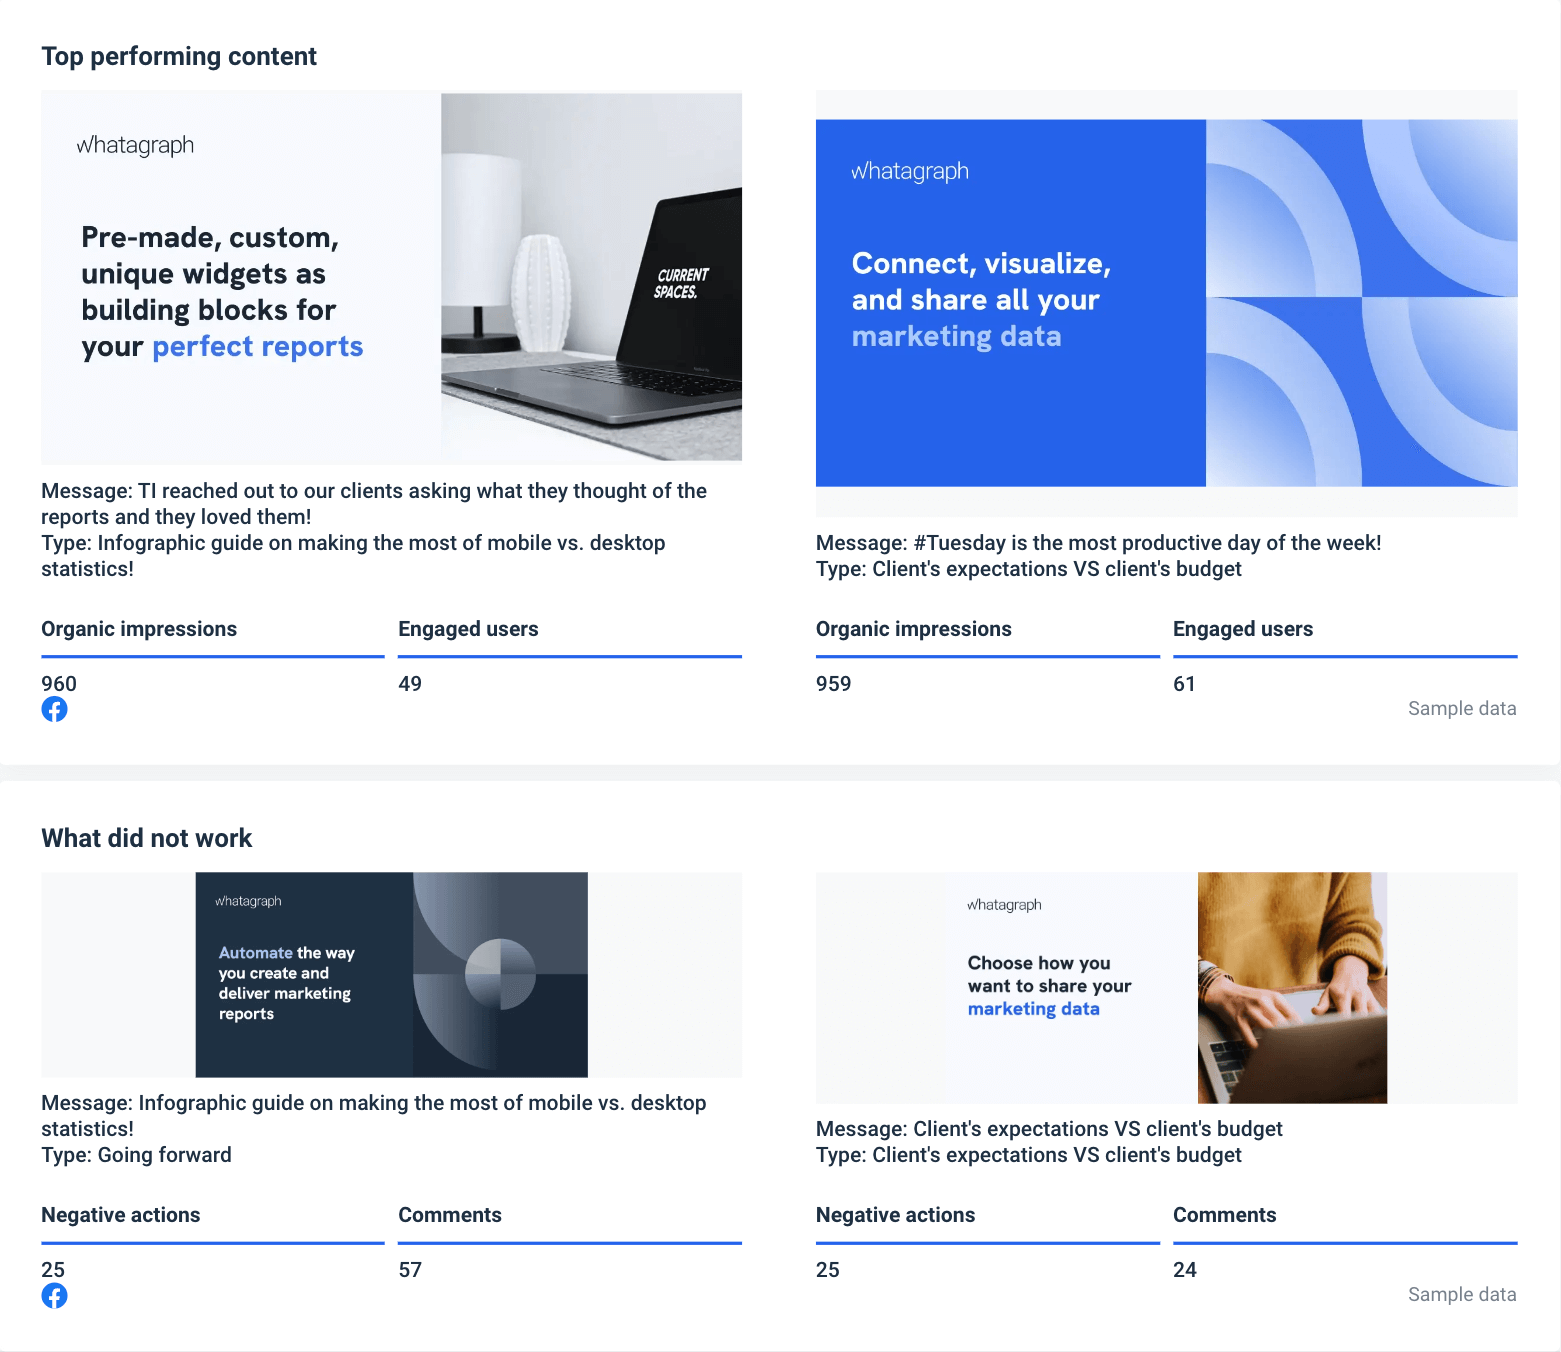
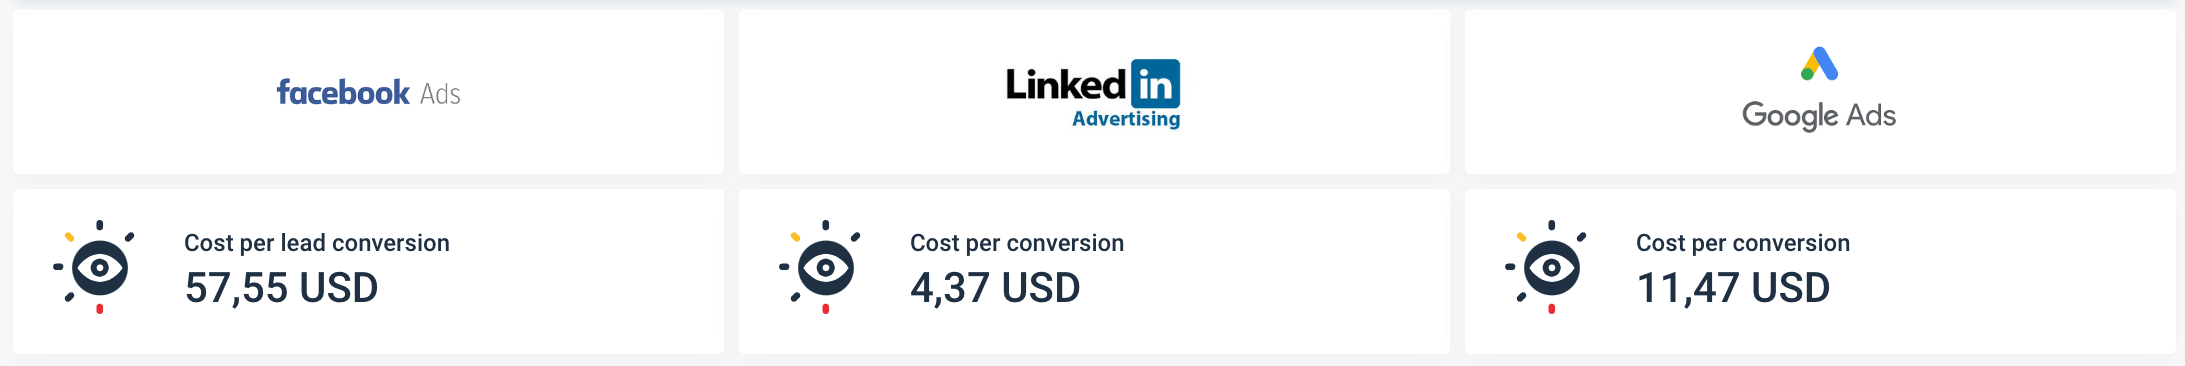
We have one more widget that is unique to us — media widgets that pull social media posts or ad visuals and display them alongside the metrics of choice. These image widgets can really add character to your reports and showcase the extra value that you put in for your clients.
Okay, there are building blocks, and you drag and drop widgets onto the report page. Nothing we haven’t seen already.
Yes, but you have to test other similar tools to tell the difference.
The difference is that we purposefully created Whatagraph to be intuitive and simple to use. As you drag and drop widgets onto the blank report, you can also click and resize them to fit among other widgets you’ve already placed. The blocks stick conveniently to the grid, so you end up with a neat and organized report. If needed, you can always add extra rows or delete the empty ones once you finish adding widgets.
If you wish to rearrange the widgets differently later on, just drag them around and resize if needed.
To make your report organized and easier to follow, you can insert a heading or cover image before each section.
This feature is a lifesaver for agencies that send multiple reports to the same clients, as Whatagraph allows you to make bulk edits to templates. To do this, first, you need to choose a report that will act as a master template.
Any report you create from that template will be linked to it, which means that any changes that you make to the master template also take effect in the linked reports. This way, you can bulk edit marketing channels, textual widgets, images, and company logos for multiple reports instead of doing it manually in each report.
With Whatagraph, there’s no limit to the cross-channel insights you can get. For starters, add any marketing channel to your report and pick widgets to compare the performance of different channels.
And when we say to add any marketing channel, we mean “get it done in a few clicks”. Whether you take a report template or create a report from scratch, add a new source, drag and drop the widgets you need, and there you have a cross-channel report.
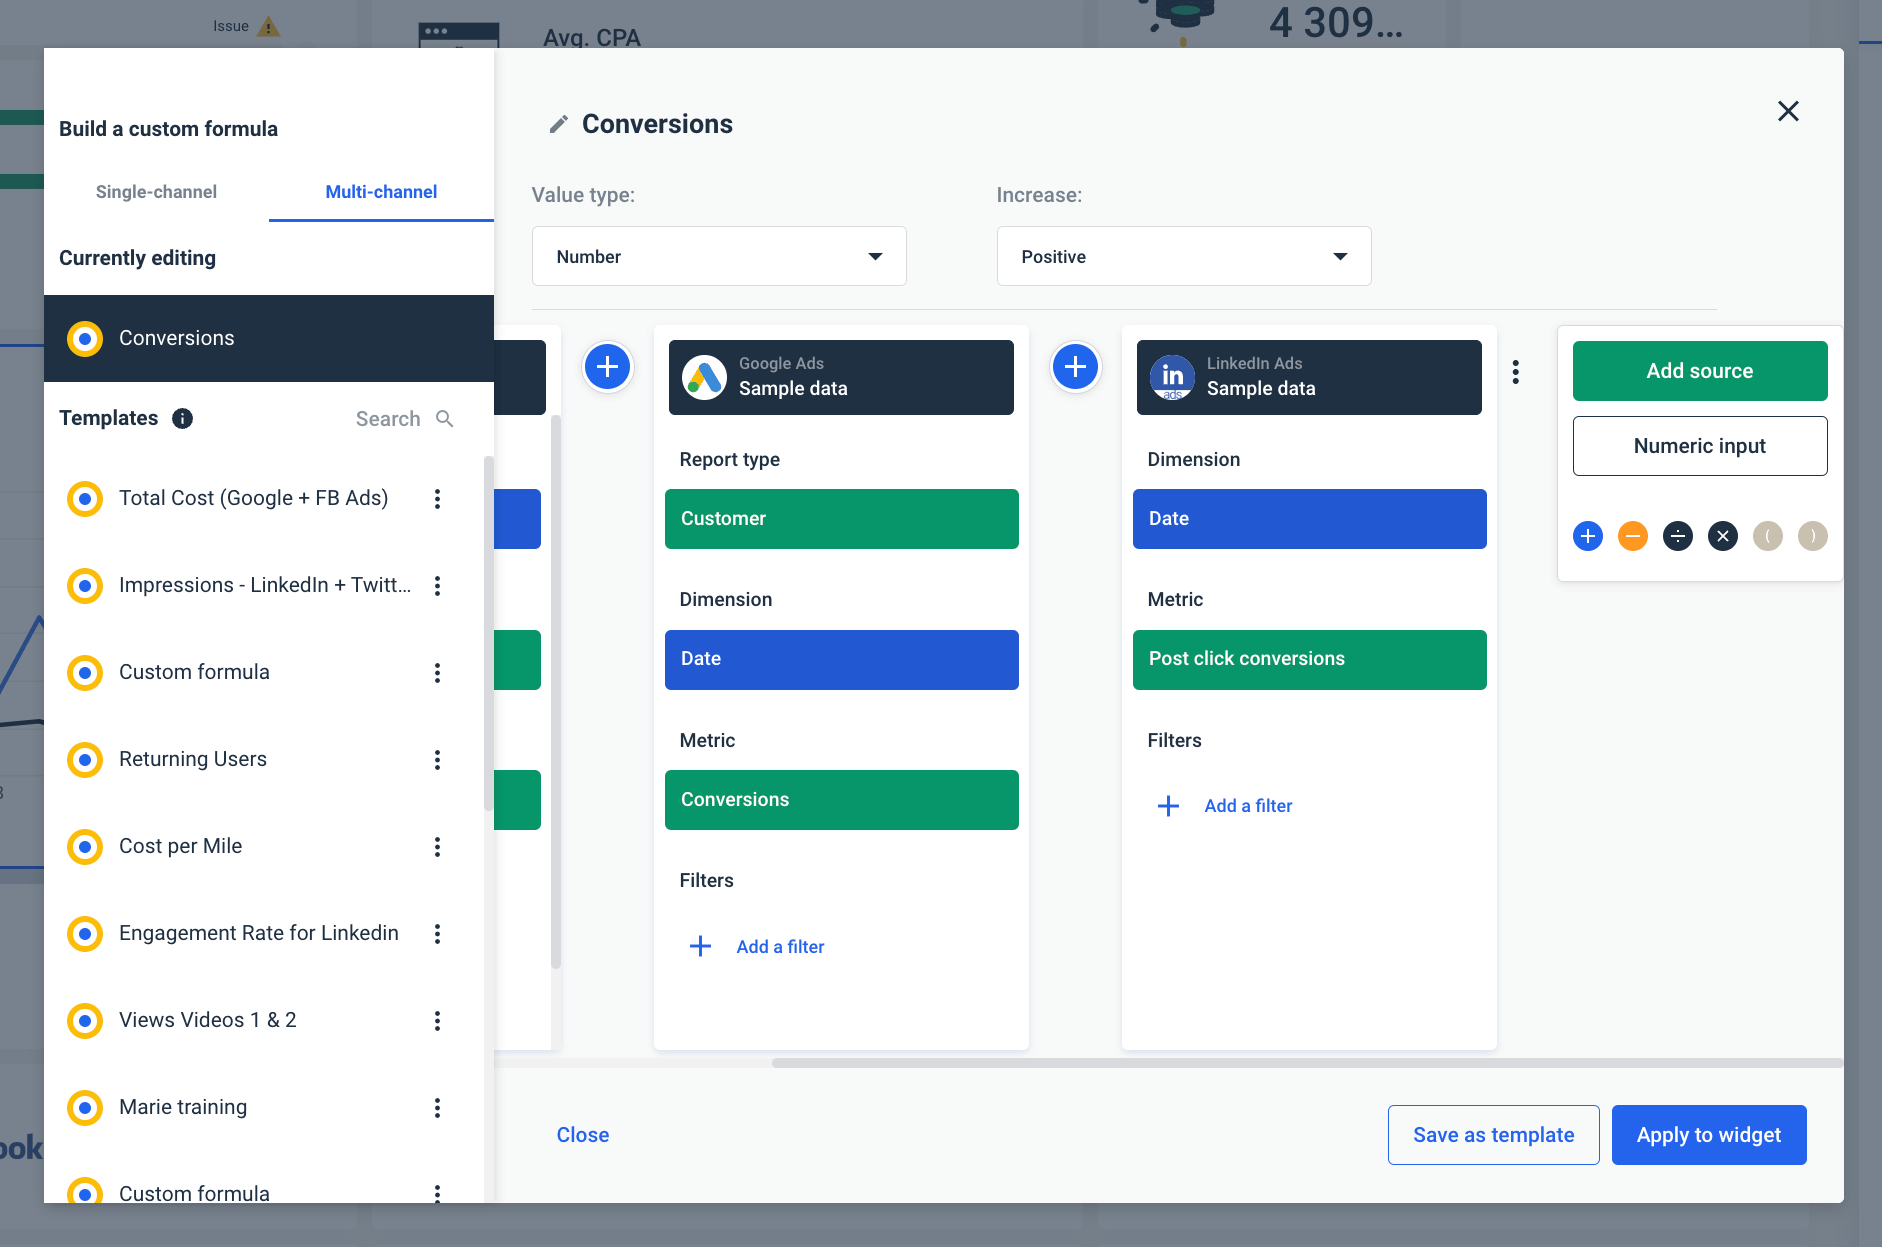
Whatagraph also allows you to easily blend data and combine metrics from multiple sources. Pick any metrics from the connected sources and use custom formulas to add, divide, multiply, and take parts of it in brackets.
But there’s more to custom formulas than data blending. You can also add agency markup for ad spend on individual platforms. For example, if an agency charges a 7% margin for PPC, a custom formula allows them to present spending and cost metrics with final numbers.
You can also easily calculate total spending for different channels. For example, combine LinkedIn Ads Spend in multiple accounts in one metrics:
LinkedIn Ads account Germany + LinkedIn Ads account Denmark + … = Total LinkedIn Ads Spend Europe
Using custom formulas, you can also build new metrics the source platform’s API doesn’t provide. For example, divide the number of likes by total impressions to get a new metric for your report.
And the best thing is that you don’t need a data analyst or developer to do it. Anyone can do it using simple mathematics, as shown here:
Another cross-channel feature that helps you present cross-channel insights is the multi-source table. It’s a pre-made widget to add to any Whatagraph report to compare related metrics from different sources.
As with all other widgets, you can use a custom formula to add filters or edit metadata for each metric in the table.
We strive to make marketers’ lives easier at every step of their data processes. Make them more efficient. The idea is not to shove random features in one interface for quantity. We are thoroughly picking the most important aspects to save time, help teams scale, bring all their cross-channel data together, and turn the “necessary evil” of repetitive data tasks into something fun, comprehensive, and easy to use. Where you focus on the story and proving your value, not the setbacks of clunky, slow, and overly complex tools.
Ivan Kostyuchenko, Product Marketing Manager at Whatagraph
Whatagraph allows you to automate a considerable part of your reporting workflow while still having complete control of the reports’ content and the send-out process.
There are three stages of automation with Whatagraph reports:
Data gathering: After you connect one or more sources, marketing data populates the pre-made report with the most recent numbers. Goal widgets and graphs come to life, and top-performing media posts appear. If you turn the comparison on, the progress over the previous period is highlighted. The non-automation part is when you add textual insights and provide recommendations based on the data.
Review: Once the report is generated, you can decide if you want to add a review step to double-check the report's content before sending it out. But this is not just about giving the green or red light. Even in this stage, you can manually input numbers into offline widgets, delete or add new widgets, change metrics, adjust formulas, and even add text comments or change media images.
Delivery: In any report’s Actions menu, there’s the Automate option. There you can:
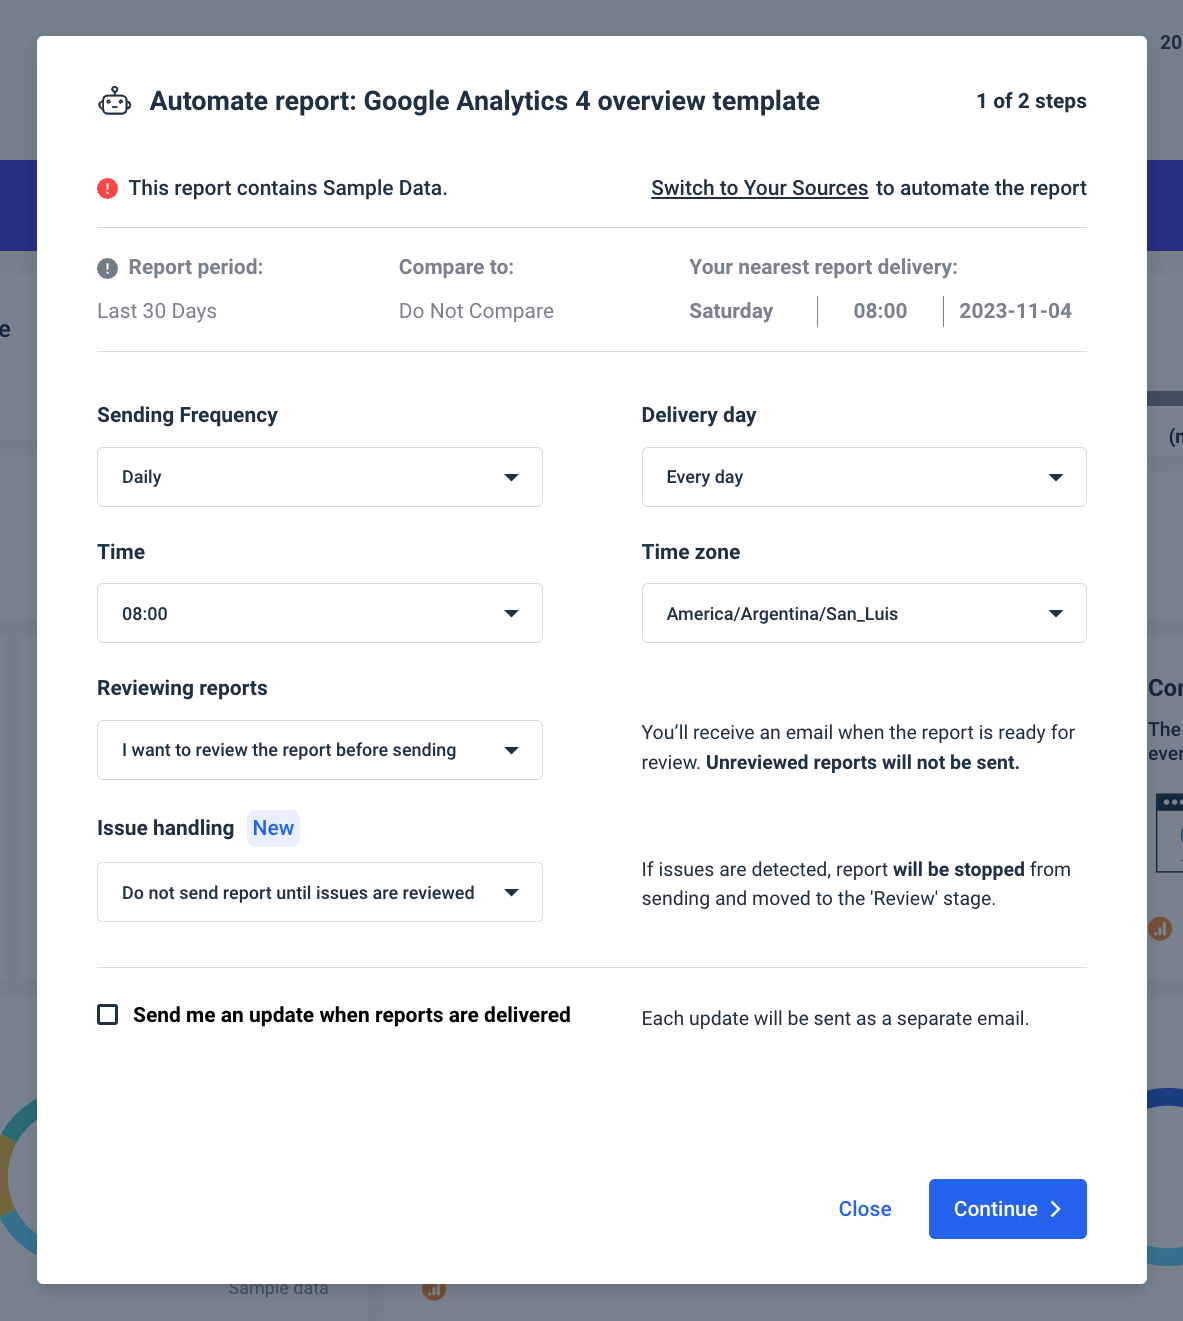
When you approve the send-out, previously crafted emails go out without manual input. The cycle restarts automatically from the data-gathering phase to the send-out, effectively putting the whole reporting process on autopilot.
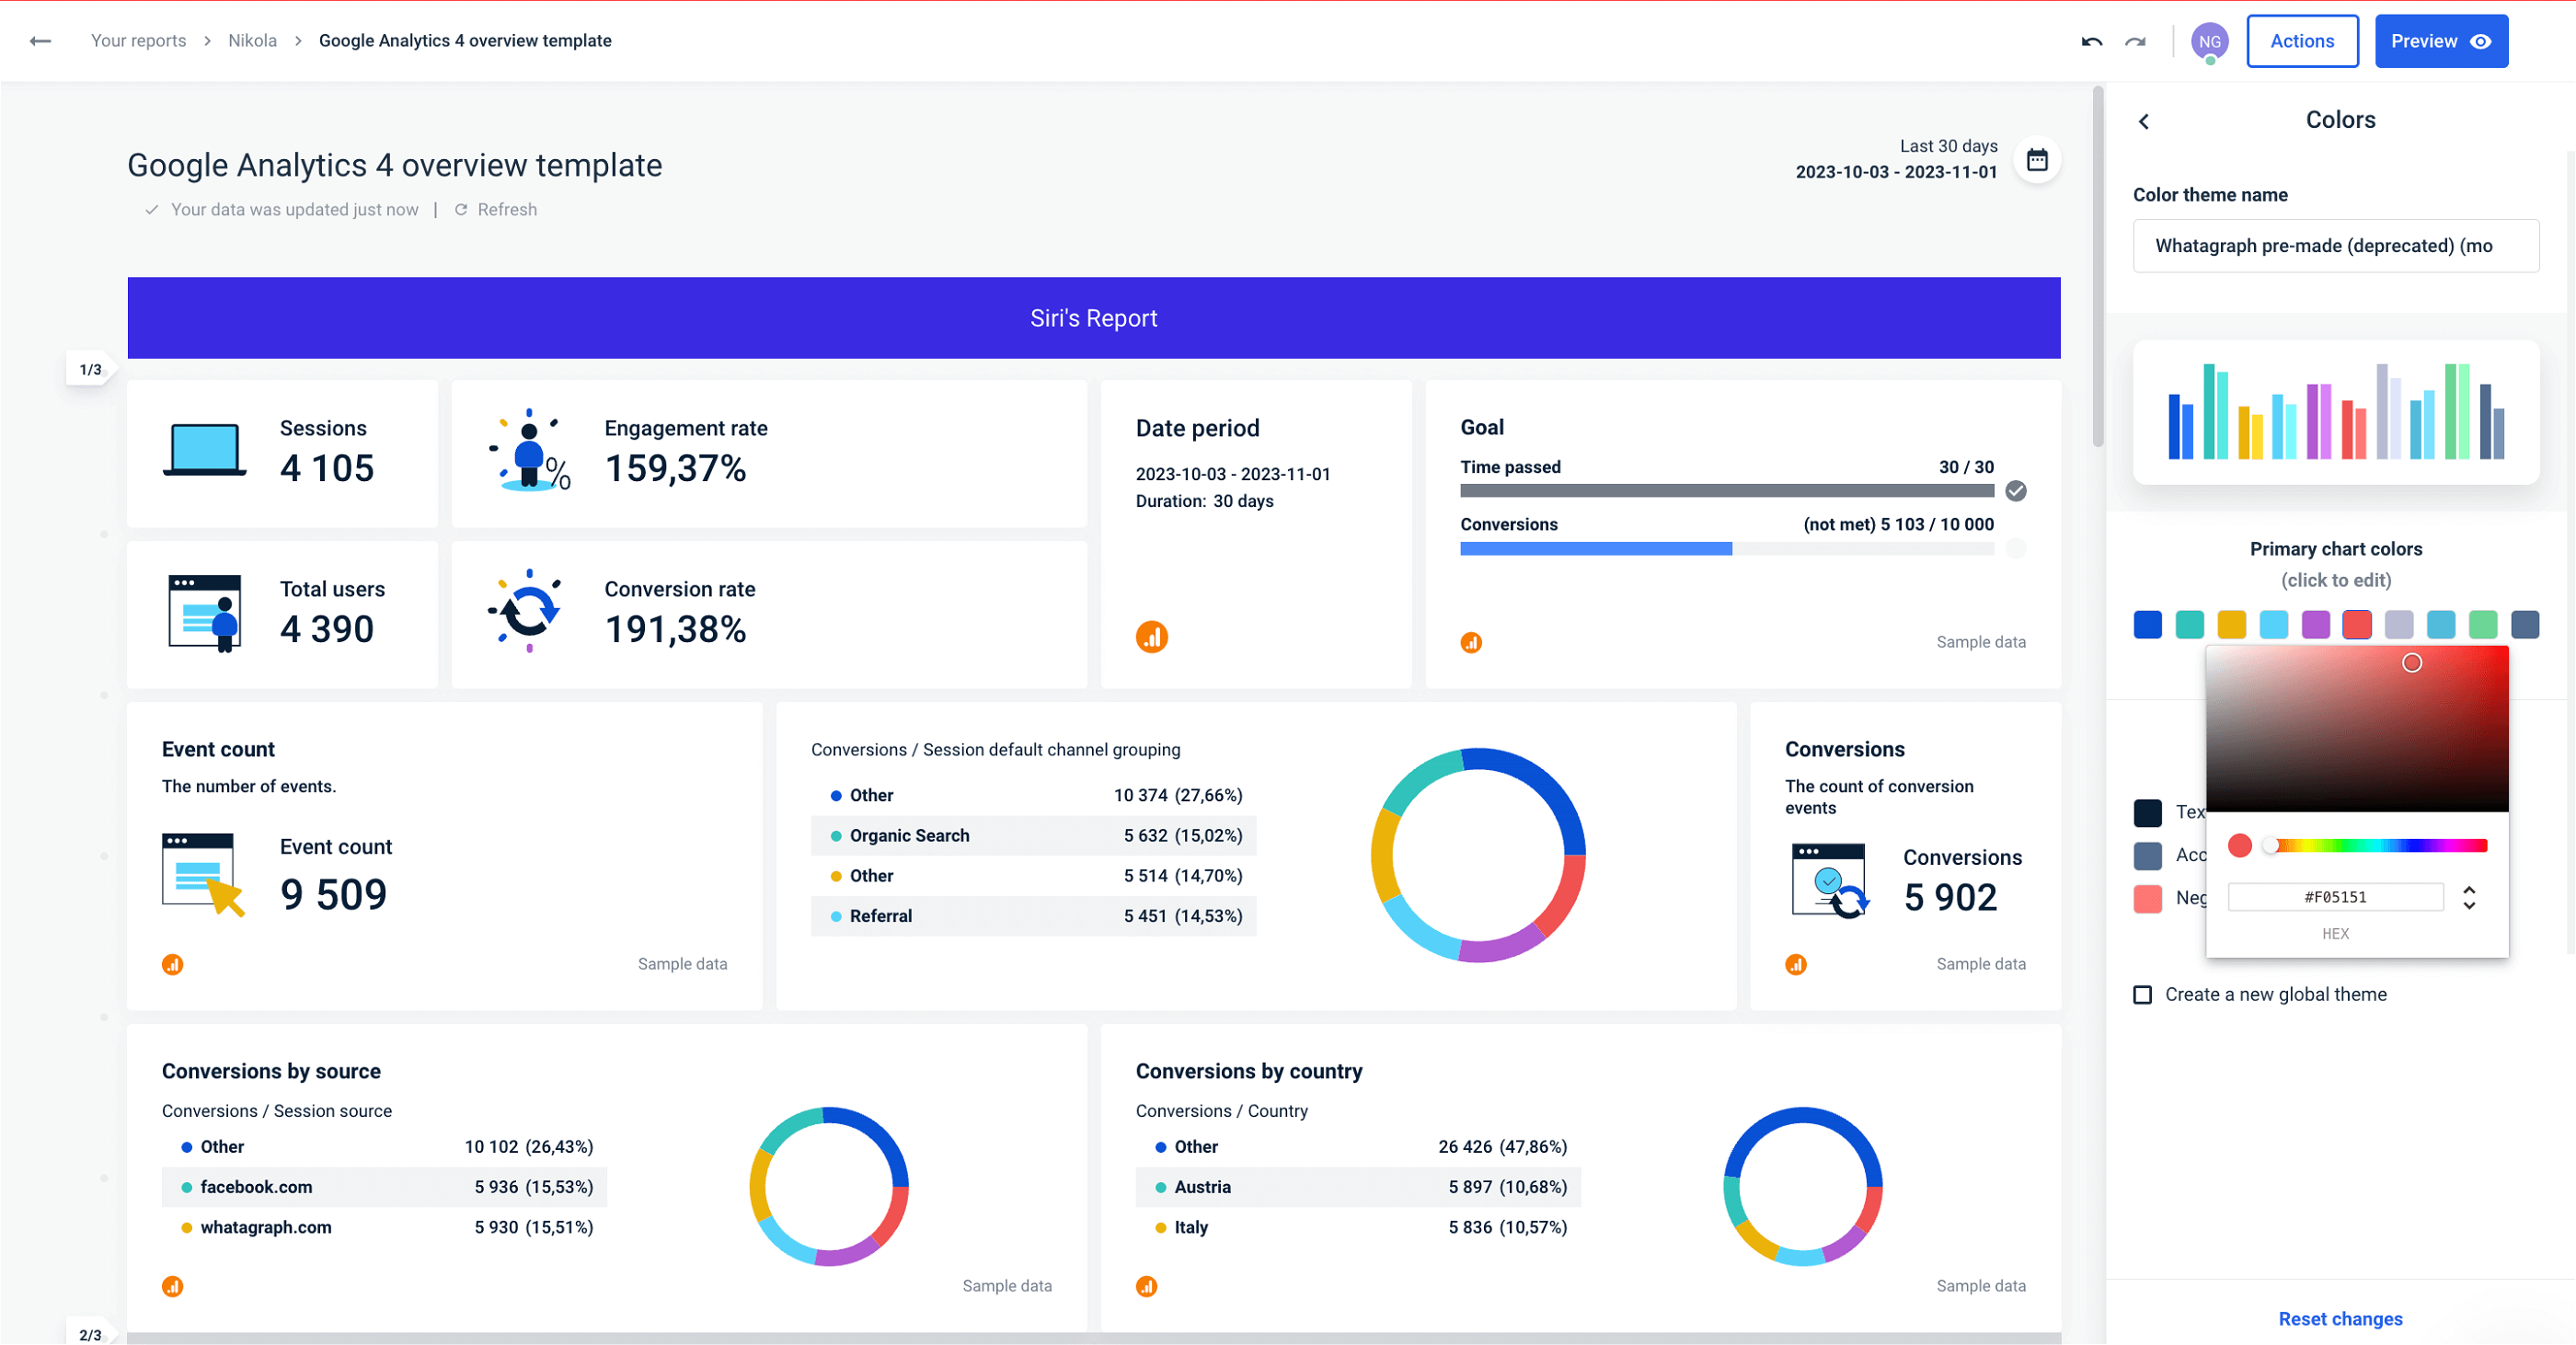
We understand that you already love Whatagraph reports and dashboards, but did you know you can make them truly yours?
Change the default design and change the entire theme and branding of any report to match your or your client’s branding:
This effectively means an agency can customize reports for each of their clients.
In the report automation feature, we explained how you can save time by leveraging reporting automation. However, automated emails with .pdf attachments are not an ideal way of reporting for all users.
Sure, they give more control over data being shown to clients, but then again, emails can get lost in the spam folder, and people make errors, such as picking the wrong date range.
That’s why we have another option — to share a live link to the report. Direct and real-time access to marketing reports removes all intermediaries between clients and their data:
However, at the end of the day, there’s nothing wrong with having both options. Automated send-out ensures the report reaches all recipients promptly, while a live link allows recipients to access the report on demand at any time.
Apart from client-facing reports and dashboards, Whatagraph offers another feature called the Overview. As a single source of truth, it can improve internal agency reporting when monitoring multiple accounts or campaigns.
The Overview presents multiple data points from different campaigns, locations, channels, etc., in one tab.
Let’s explain briefly how the Overview works.
The basic building block for any Overview is a folder. A folder is a future row in a single dashboard. The metrics you see in those rows come from sources, widgets, and templates inside that folder.
There’s no limit to using folders as categories. You can create them for regions, team members, channels, multiple websites, campaigns, etc.
Instead of creating one enormous spreadsheet or dashboard, you can create multiple Overviews and switch between them in seconds. You can have internal dashboards for different teams, switch between campaign-related or location-related views, etc.
Here is how you can use Overview:
It doesn’t matter if you track 20 different metrics from several sources daily or just a few “North Star” type numbers to check out occasionally. The Overview lets you set targets and limits and track those in one place.
Instead of multiple targets and limits, focus your Overview on marketing campaigns and ongoing insights. This is ideal for agencies that run campaigns across social media for multiple clients. With cross-channel reports already in client folders, the Overview lets you track all those campaigns’ KPIs in one place.
Set your team members’ folders as rows in the Overview and create a dashboard where each account manager can see their current performance. This can trigger more internal conversations about specific campaigns, wins, and flops. Also, management can instantly see where more attention is needed.
Whatagraph has an intuitive, no-code workflow to transfer data from multiple marketing platforms to Google BigQuery data warehouse.
This gives agencies complete ownership of the marketing data they collect. Different platforms have their policies as to how long they keep customer data. Some platforms discontinue their services, and some get transformed into a different product, not to mention changing data policies.
So, instead of having data in different locations, use data transfer to copy it all to a managed data warehouse.
Another reason is the API limitations. Certain platforms, like Google Analytics 4, have API quota limits. This means that there’s a limit on querying large volumes of data on a daily basis. There are no such limits with BigQuery. The data you transfer regularly is yours to use and query any way you want.
Also, working with warehouse data prevents your data from being sampled. Again, platforms like GA4 tend to “sample” data when you reach back to the past. This means the data is not accurate to the specific number. Fetching metrics daily and copying them to Google BigQuery ensures you always use accurate historical data.
However, the most important thing to remember is that with Whatagraph, setting up a date transfer takes just a few clicks.
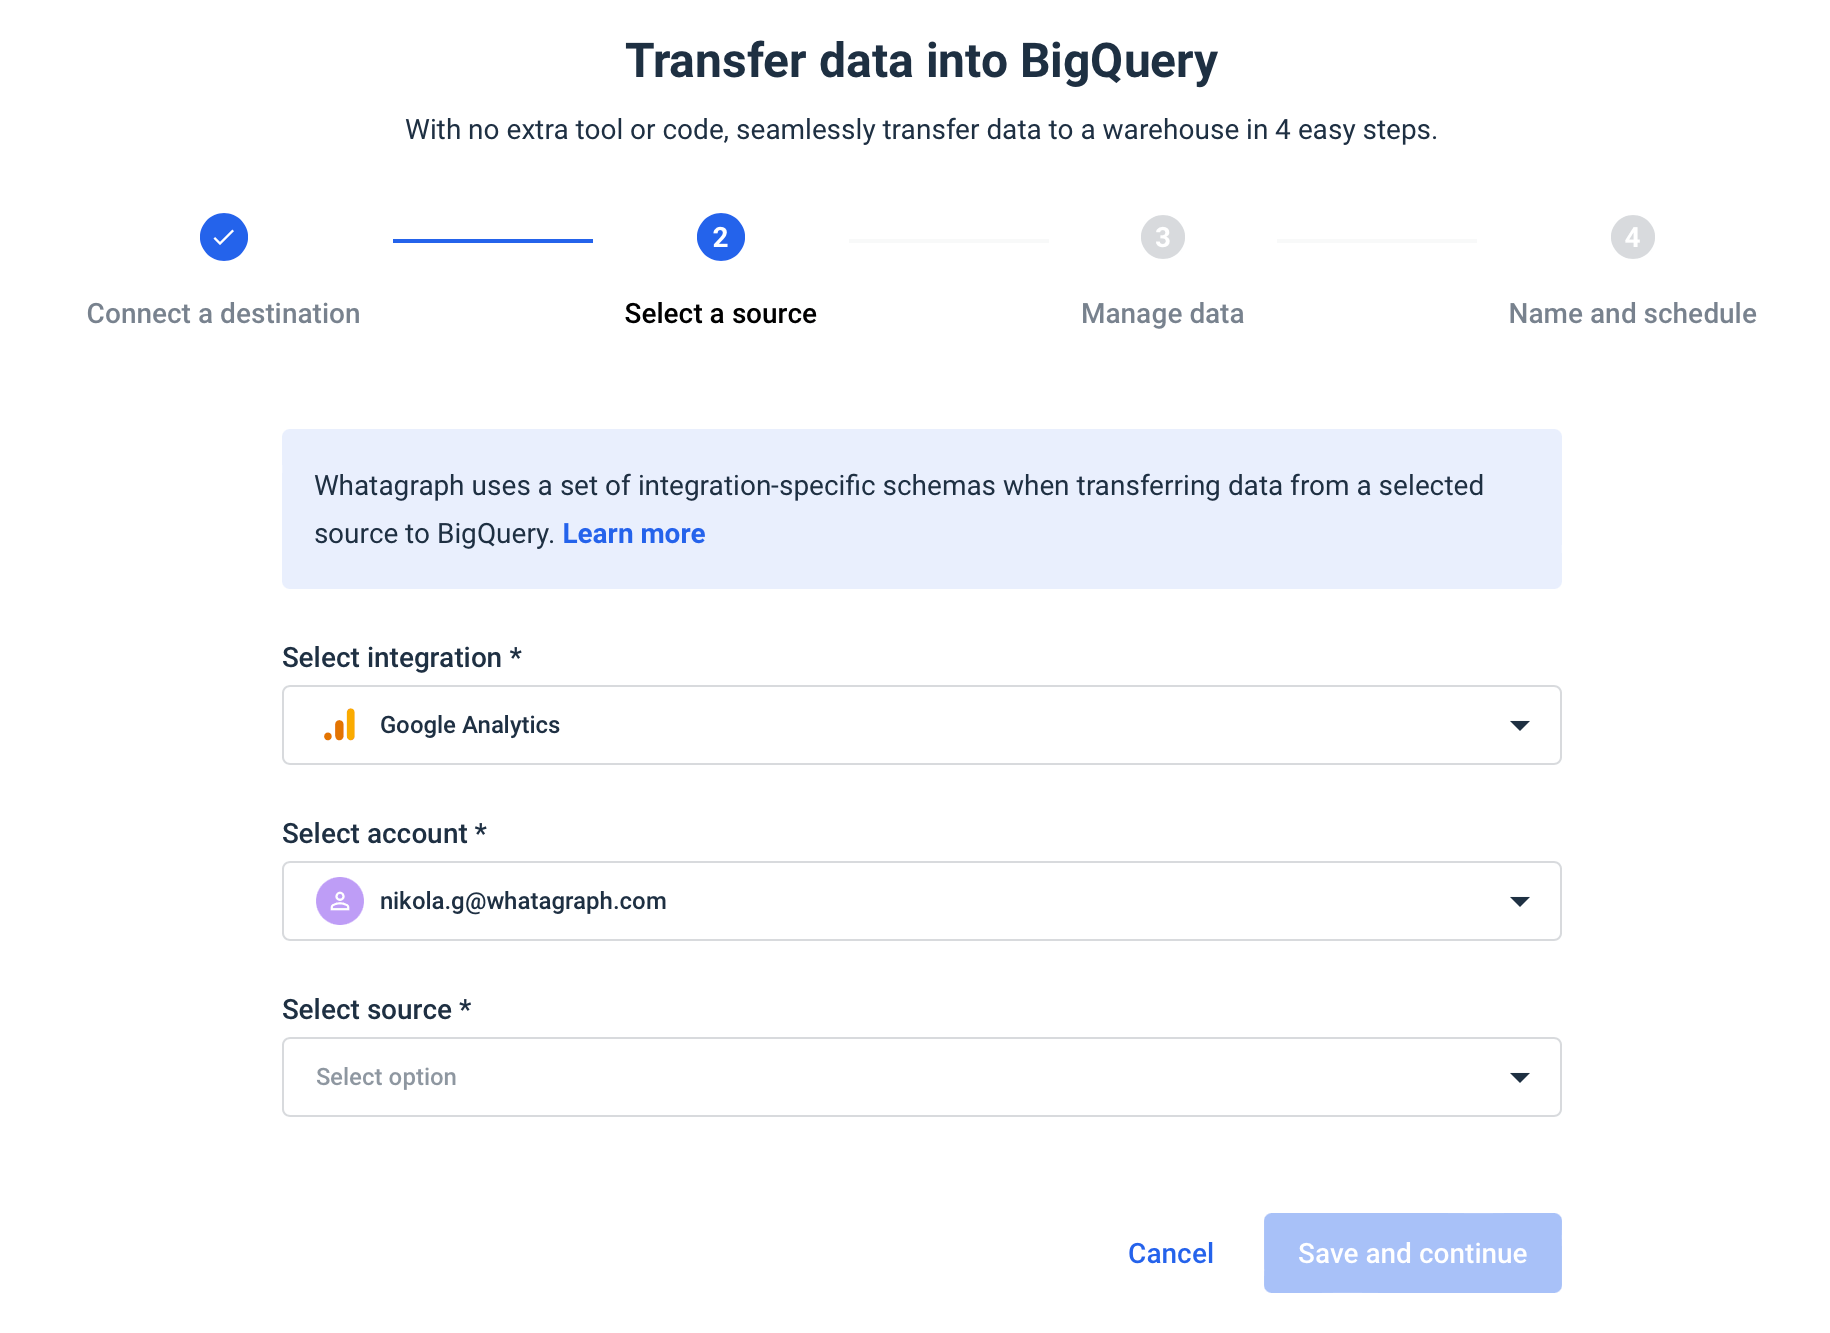
No extra training or technical expertise is required. Data transfers are available as an add-on to standard Whatagraph pricing plans or as a standalone feature.
Although speed is not a feature, it’d be wrong not to mention that after a recent infrastructure upgrade to Google Kubernetes Engine, Whatagraph is faster than ever.
Our tests have shown that widget loading times have increased from 30% to a whopping 5 times.
Before the upgrades, for example, a heavyweight widget with 180 configurations would take a minute to load, and now it takes less than 10 seconds.
Speed upgrades have accelerated the whole platform, including the report builder, the template gallery, and the team users’ loading times, which have dropped from 20 seconds to 1 second in some cases.
Now that you know more about these features, we hope you’ll start using them with your Whatagraph account. If you have any trouble implementing these, customer support is just a click away.
On the other hand, if you are considering Whatagraph for your agency and want to see any of these features in action, book a demo call today.
Published on Jul 25 2017
WRITTEN BY
Nikola GemesNikola is a content marketer at Whatagraph with extensive writing experience in SaaS and tech niches. With a background in content management apps and composable architectures, it's his job to educate readers about the latest developments in the world of marketing data, data warehousing, headless architectures, and federated content platforms.

By submitting this form, you agree to our privacy policy