Top 7 Google BigQuery Data Visualization Tools for Data-Driven Businesses in 2024
Data visualization and reporting are the core of today’s data-driven enterprises. By implementing data visualization tools, organizations can make big data more accessible to their internal teams, clients, and decision-makers. Serverless data warehouses such as Google BigQuery are an essential component of this system. Luckily, there are plenty of Google BigQuery visualization tools to choose from. Take your pick.
Digital businesses generate a huge amount of data every day, a volume that’s hard to manage in any organization. This is why for the data-driven mode to work, businesses turn to data visualization and reporting.
Data visualization tools make your collected information easy to understand by generating tables, graphs, widgets, and other visual formats.
The days of stitching together Google Sheets are gone.
These interactive visual dashboards help with not only real-time business decisions but also with strategic planning, drawing from vast datasets accumulated in BigQuery.
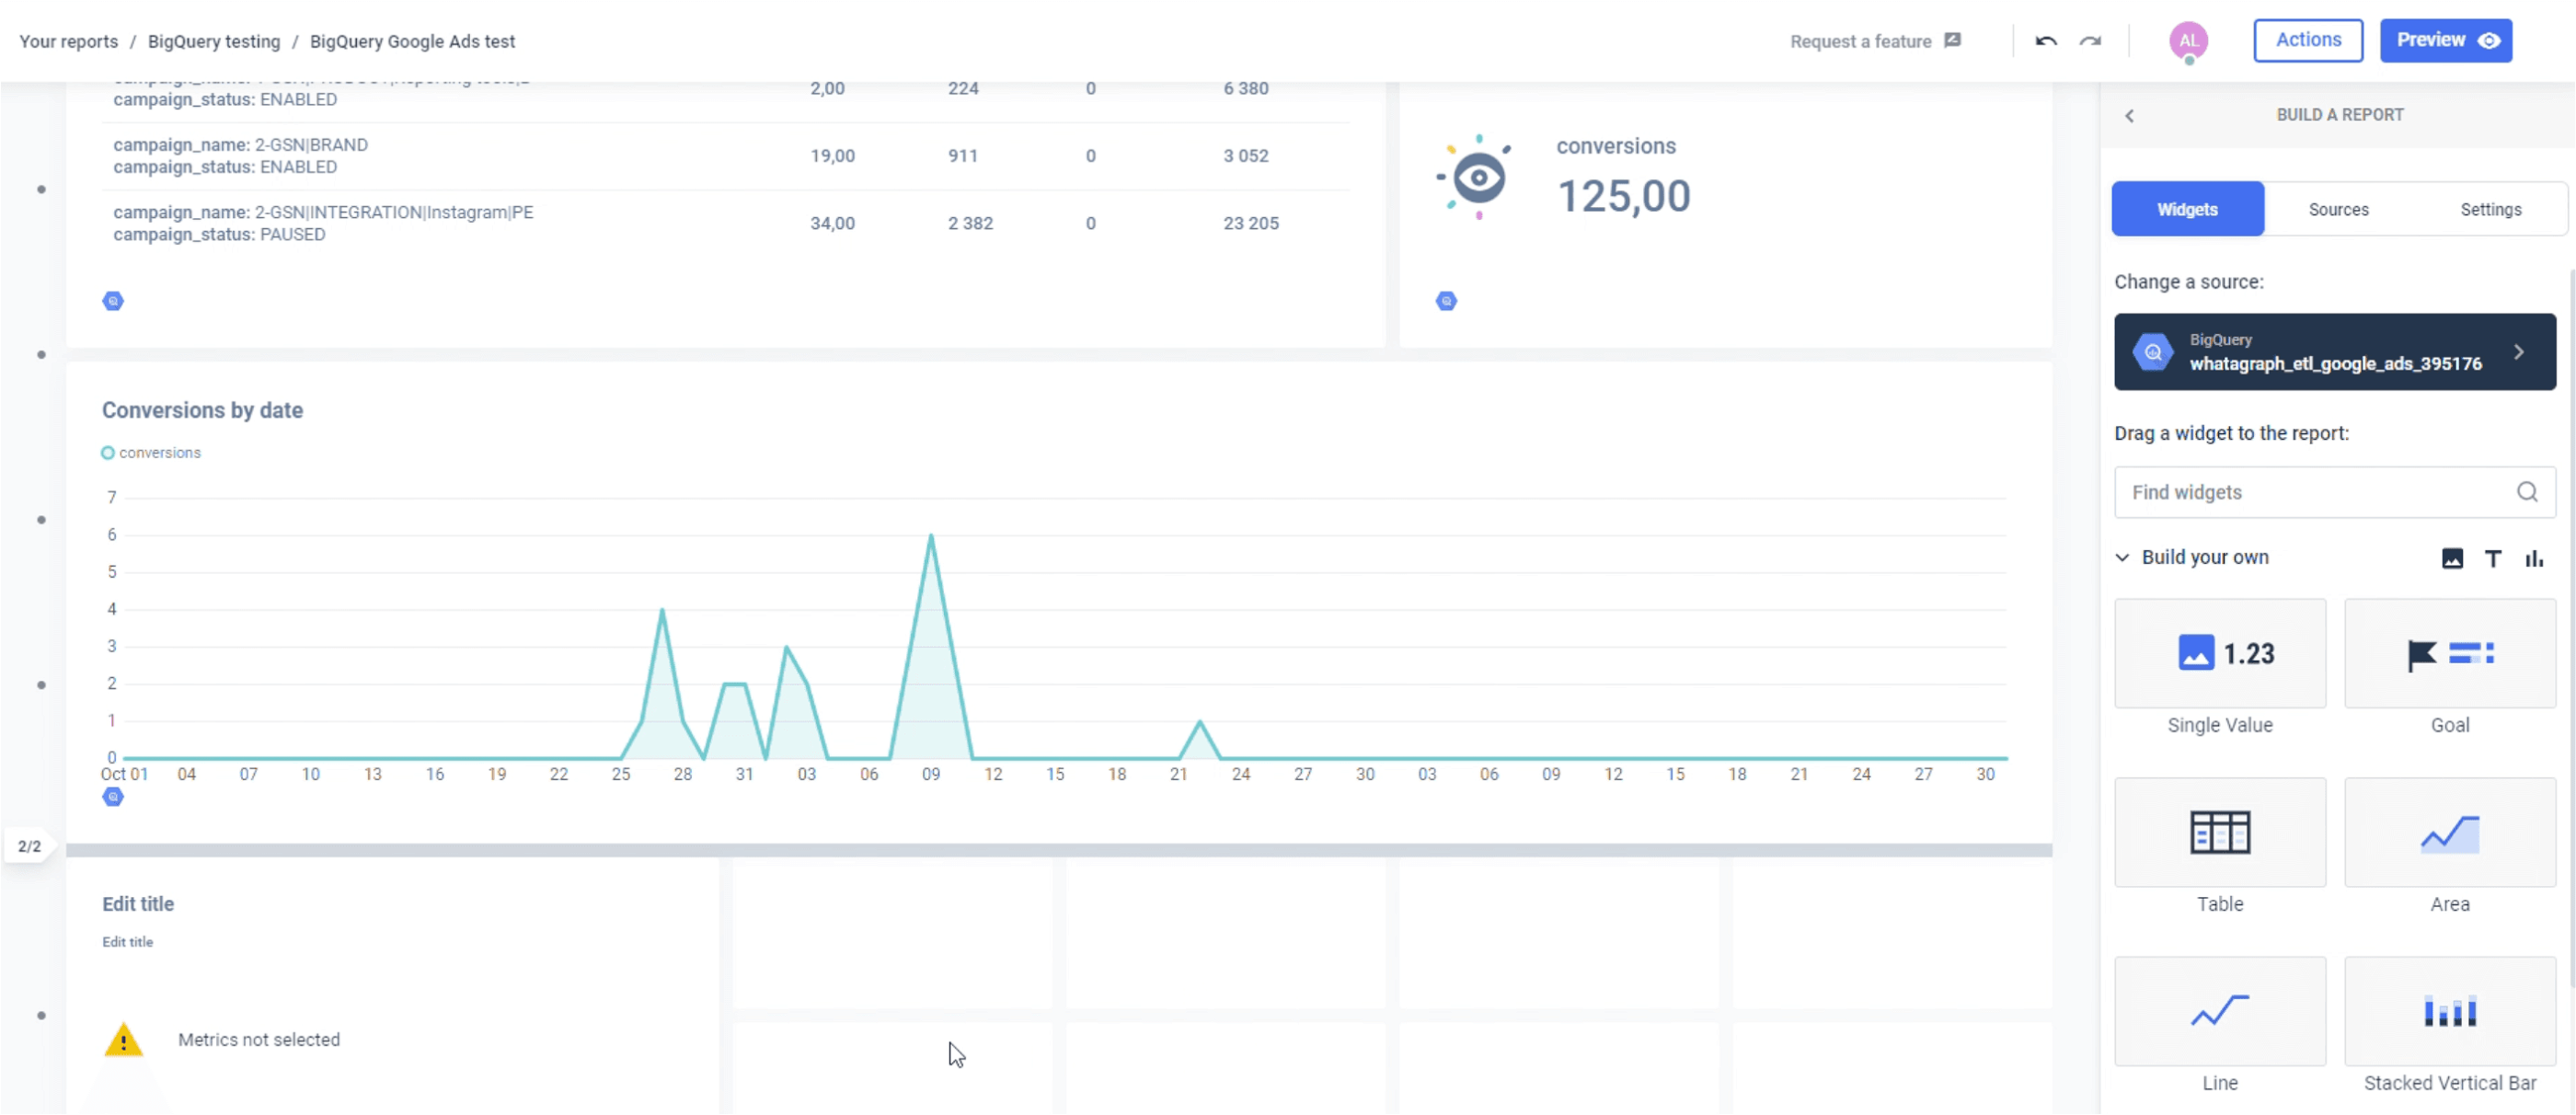
2. Connect your sources — Google Analytics, Google Ads, Facebook Ads, and many more.
3. Drag and drop the metrics and dimensions you want to see.
Once you create your report, you can change the details like the arrangement of widgets, the colors of the design elements, the logos, even white-label the report, and remove the Whatagraph branding for a more professional look.
You can use Whatagraph to visualize any data available in your BigQuery account. This not only includes the data created by the Whatagraph transfer function but any other data sources you may have, including public datasets.
Whatagraph pricing: Three pricing plans are available based on the number of users and data sources. Data transfers to BigQuery charge a flexible fee per transfer per month.
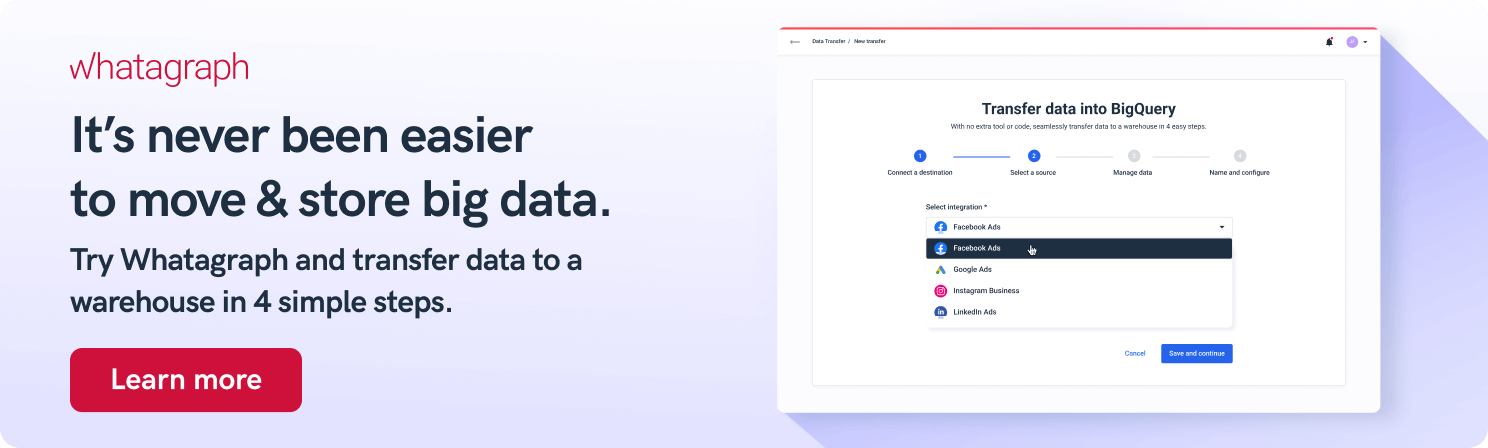
If you’re looking for an easy-to-use solution to connect data from various marketing sources, keep your marketing data safe, or want to visualize your BigQuery data, book a demo call and find out how Whatagraph can help.
2. Looker Studio
Formerly known as Google Data Studio, this is one of the most popular business intelligence (BI) tools that companies use for actionable reports. Looker Studio’s integration to BigQuery takes mere seconds to set up.
Looker Studio supports a number of data connectors and is good at scripting languages like Python, but it has a few technical drawbacks. It’s not the best choice for data infrastructure or complex data analytics that involves SQL acrobatics.
The other drawback is that you need Excel knowledge to combine data and create graphs and tables.
Other than that, Looker Studio also supports drag-and-drop features and has a user-friendly interface.
Looker Studio pricing: Request a quote to find out. Not transparent.
3. Tableau
With its many advanced features, Tableau has won many accolades in the past. It’s highly compatible with almost any database and is one of the top choices for data visualization.
Tableau comes with a highly-interactive dashboard, metadata support, a visual library, different user-level permissions, and the popular drag & drop and easy-to-use features.
The tool has a handy notification feature that signals if a data connection fails.
The only drawback is the lack of some functionalities, such as the ability to select dates – you can only drag the date range filter.
Tableau pricing: $70 a month for the Creator tier.
4. Hevo Data
Hevo Data is a no-code pipeline that helps teams load data from any data source, from Google Drive and others based on Google Cloud Platform (GCP) to MySQL, Cloud Storage, and machine learning apps.
Hevo can load the data into BigQuery and transform Google BigQuery data into an analysis-ready form using a high-speed streaming API.
Hevo Data has become an essential tool for teams that depend on BI workflows.
The data pipeline is completely automated, which means data can be delivered in real time without any loss from source to destination. This feature significantly simplifies the ETL process.
Hevo Data pricing: The basic plan is free. The Starter package is $239 a month.
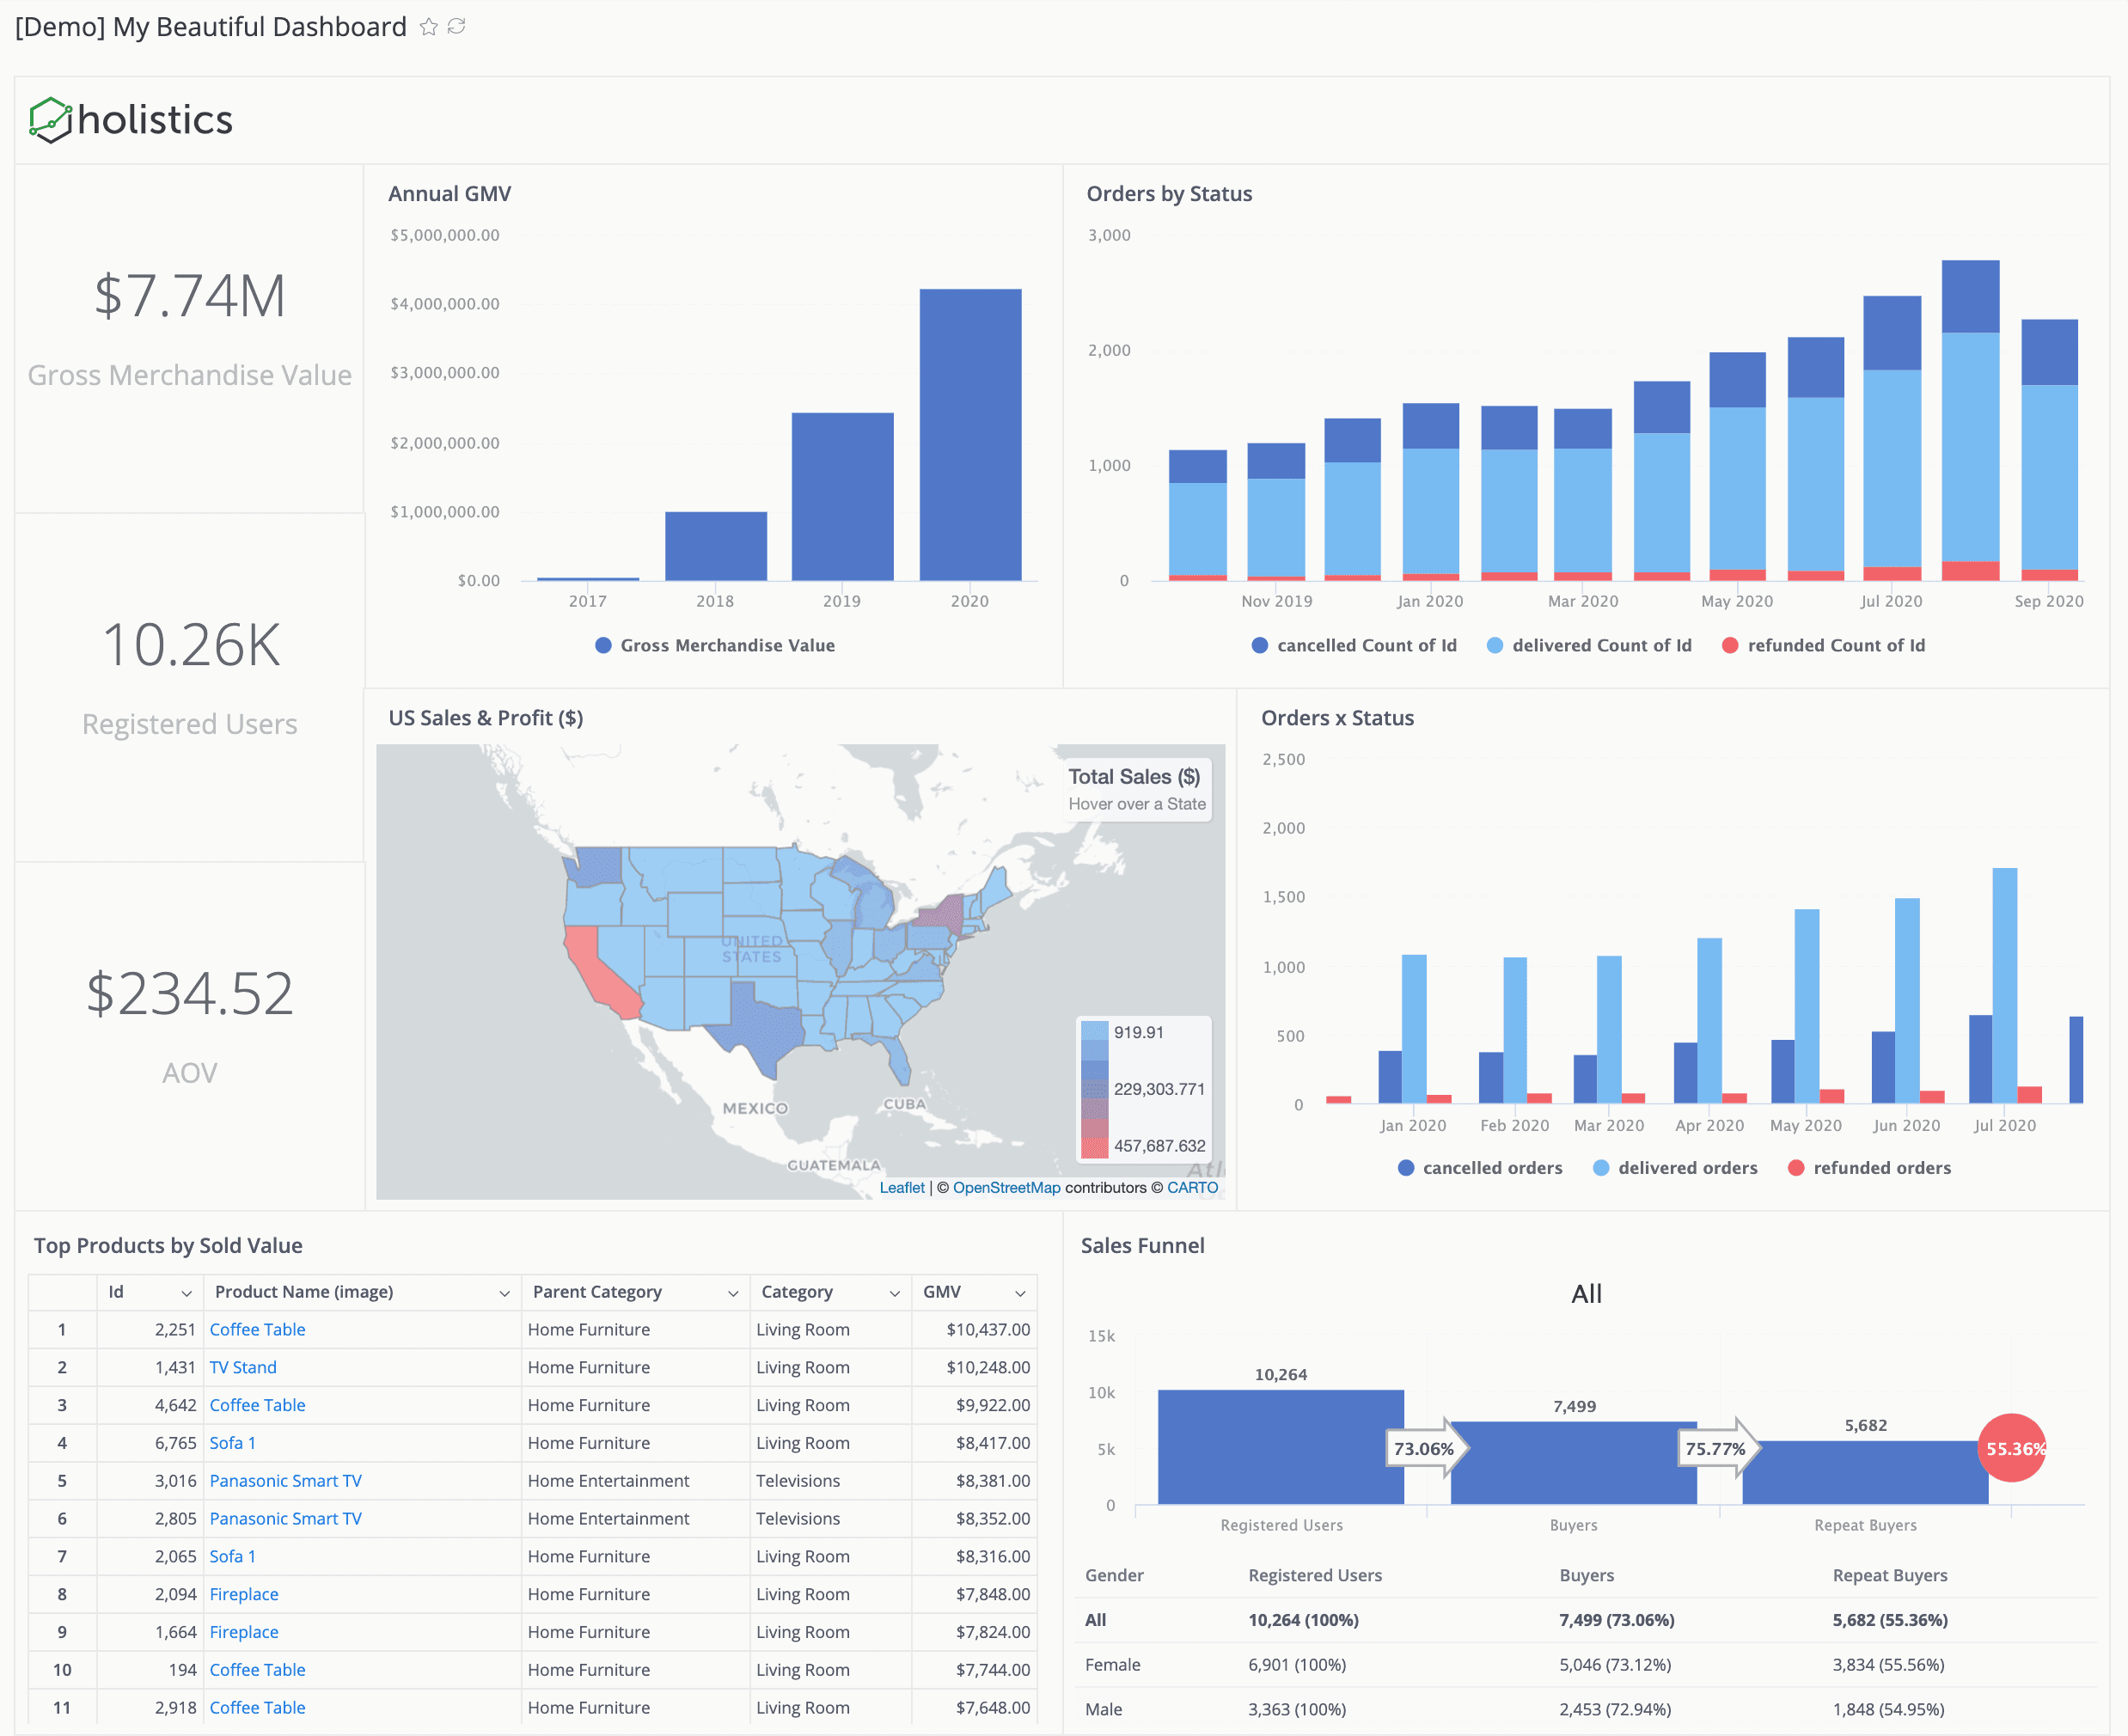
5. Holistics
Holistic is a relatively new self-service BI tool that offers a formidable visualization layer for non-tech users and different use cases. With Holistics, you don’t have to enlist help from a technical team to visualize the results of SQL queries.
No one in your marketing team needs to have any knowledge of SQL — just select the relevant metrics and use them to build quick reports using a drag-and-drop feature. Holistics’ data modeling layer allows users to share essential data in BigQuery and other data warehouses.
As a bonus, it can store the materialized query views in BigQuery for visualization and reporting.
Holistics pricing: The Entry tier costs $150 a month.
6. PowerBI
An immensely popular business intelligence tool developed by Microsoft, PowerBI provides interactive data visualizations through a user-friendly interface. This BigQuery data visualization tool helps businesses keep their data at one location and optimize a data-driven culture using a variety of smart tools.
PowerBI also features a powerful self-service analytics option at an enterprise scale. The main drawback is that the BI tool supports data modeling only with a Windows Desktop.
PowerBi pricing: £15.10 per user a month.
7. QlikView
Simple and intuitive to use, QlikView is a popular solution for data integration, transforming raw data to the knowledge base, and analysis. This platform enables fast integration, collaboration, and consistent reporting while maintaining automatic Data Association.
QlikView is a window-only dashboard with a memory-resident app. This makes it highly-cost effective for businesses that need a scalable solution for quick decision-making.
QlikView pricing: $39 per user a month for the basic Business tier.
Conclusion
These are the seven top-of-the-line Google BigQuery data visualization tools used by marketing teams who prepare their reports using rich data.
All of these tools have free trials, which you can compare to see which one meets your day-to-day demands, as well as what you get for your money.
Published on Jan 27 2023
WRITTEN BY
Nikola Gemes
Nikola is a content marketer at Whatagraph with extensive writing experience in SaaS and tech niches. With a background in content management apps and composable architectures, it's his job to educate readers about the latest developments in the world of marketing data, data warehousing, headless architectures, and federated content platforms.