The Ultimate Marketing Reporting Software for All of Your Agency Needs

Your marketing reporting software that automatically pulls data from various marketing channels. Share automated reports that took you minutes to build. Say goodbye to spreadsheets, clunky or complex visualization tools, and say hello to intuitive reporting and automation!
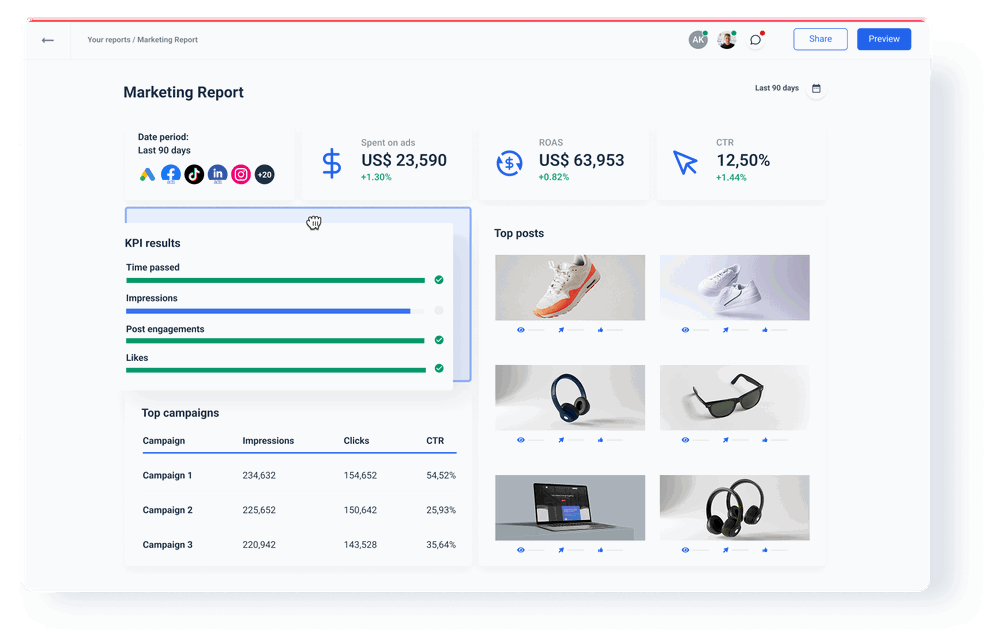
Ultimate Marketing Reporting Software for Agencies
You are in good company with 1,000+ marketing agencies and in-house teams worldwide
Dentsu
mc cann logo
Whatagraph image
Whatagraph image
Whatagraph image
Ogilvy logo
havas logo
n365 logo

Replace Multiple Tools for Marketing Reporting with All-In-One Software

From Google Analytics 4 to LinkedIn Ads, Ahrefs to HubSpot… connect data from all the major marketing reporting platforms and replace tens of reporting workflows by one. If you need metrics from a different source, integrate your custom data via Google Sheets, BigQuery data warehouse, or a custom API.

45+ direct Integrations with all of your digital marketing sources

Social media, SEO, eCommerce, PPC, and email marketing are just some of the many marketing channels you can report on with Whatagraph. More than 45 different integrations allow you to create custom reports for your clients’ marketing campaigns. Start with a report template or create your own custom report from scratch.
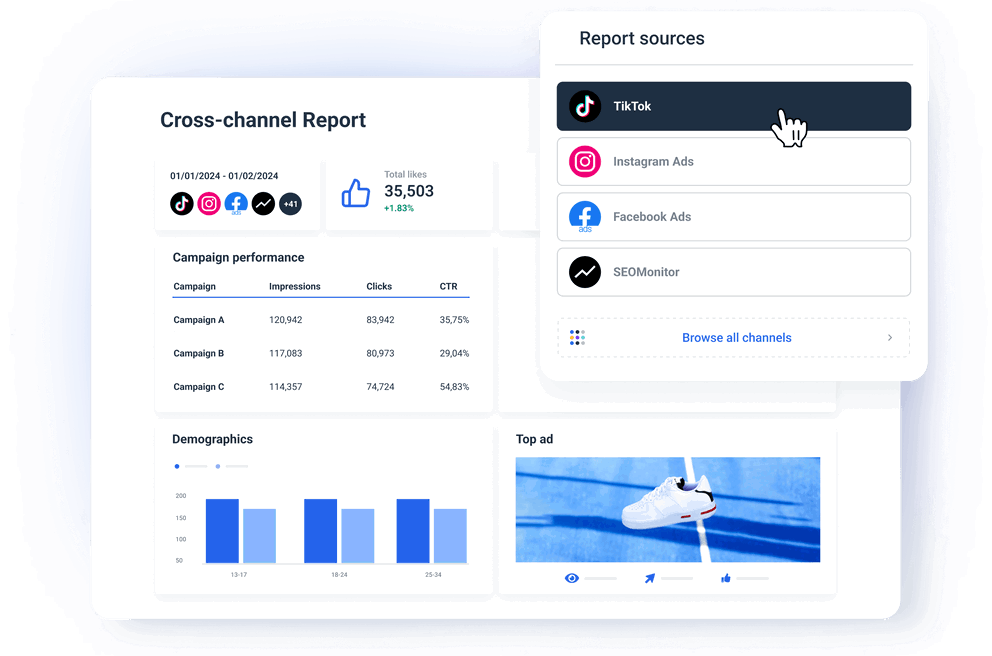
45+ direct Integrations with all of your digital marketing sources

Visualize data and create reports in minutes

Turn marketing data into appealing, detailed, cross-channel reports fast, without any training or background. Pick your widgets and drag and drop them on the page to instantly create charts and tables. The widgets stick conveniently to the grid, giving you a neat and organized report. Add more rows and insert a cover image or heading to introduce a new section. 

Visualize data and create reports in minutes

Intuitive report builder

Build your perfect marketing report from a blank page using elements like building blocks: single-value widgets, graphs, charts, tables, and text. Even build your own visualization widgets from the available elements. Boost the engagement of your reports with media widgets that pull social media posts or ad visuals and display them along the metrics of choice. 
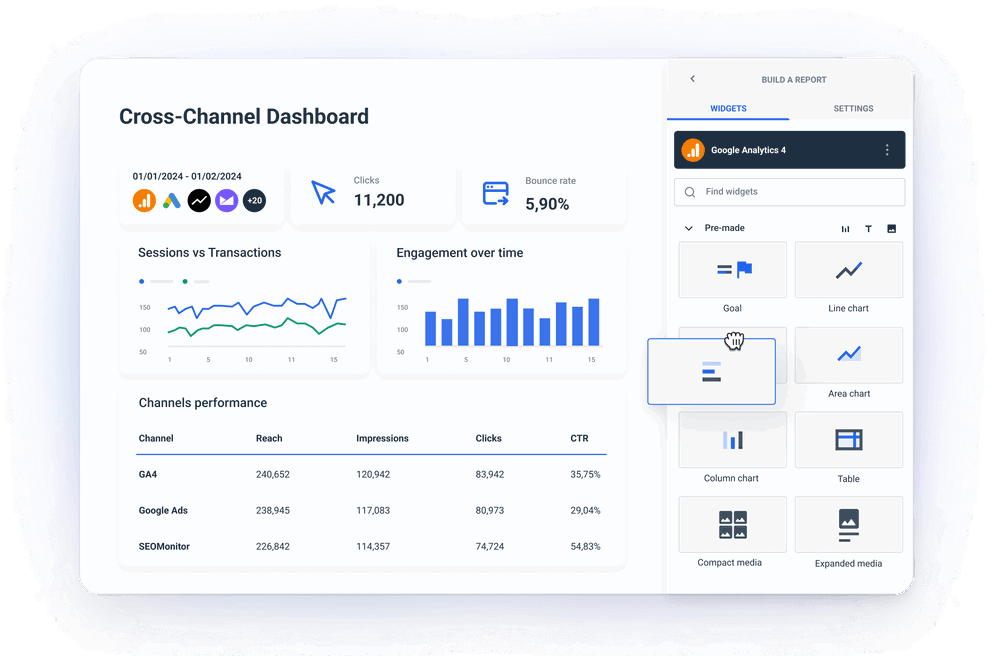
Intuitive report builder

Build any marketing report in three steps

Connect data sources icon

Connect sources

Automatically pull data from 45+ native integrations. Log in to connect a source and get live data into your report with swift automated updates.

Create marketing reports icon

Create a report

Pick a template from our gallery with all essential visual types and widgets already inside, or use our drag-and-drop builder.

Automate data reports sharing icon

Automate sharing

Pick the recipients, frequency, and delivery time, and automate emails with attached PDF reports.

Save anything as a template

Save any calculation, filter, widget, or whole report as a team template and use it again. Build custom widgets and rearrange the layout of graphs and charts. Easily adjust the scale by selecting min and max values. Add custom titles and descriptions for more context. 
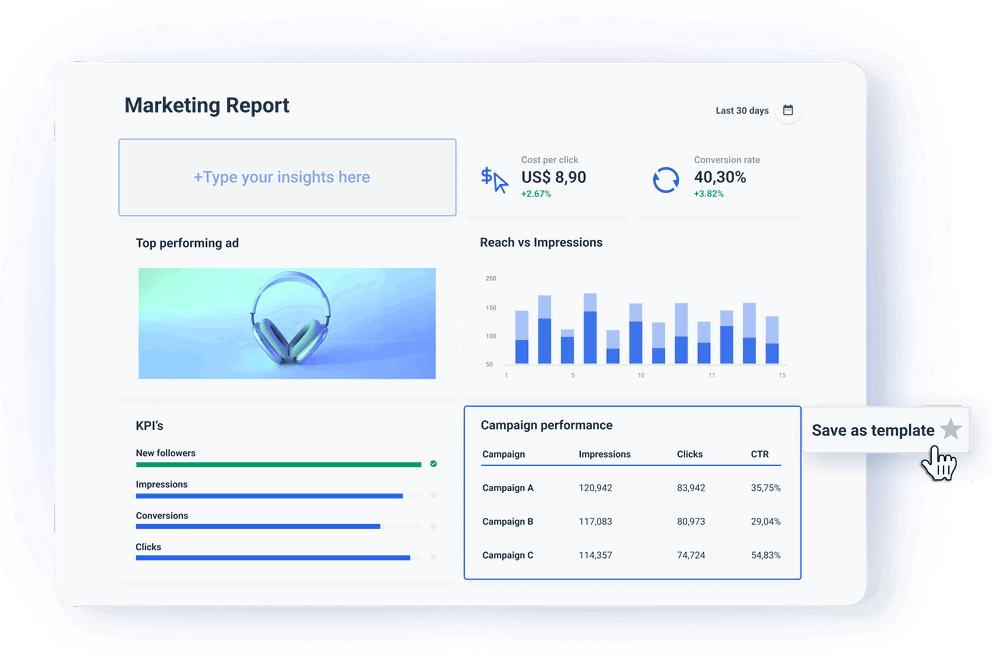


Save anything as a template

Personalized & white-label reporting

Remove Whatagraph’s branding from all reports and use your agency’s instead. Use your or your client’s domains, logos, and colors. Send marketing reports that match your or your client’s branding. 


Personalized & white-label reporting

Cross-channel reporting

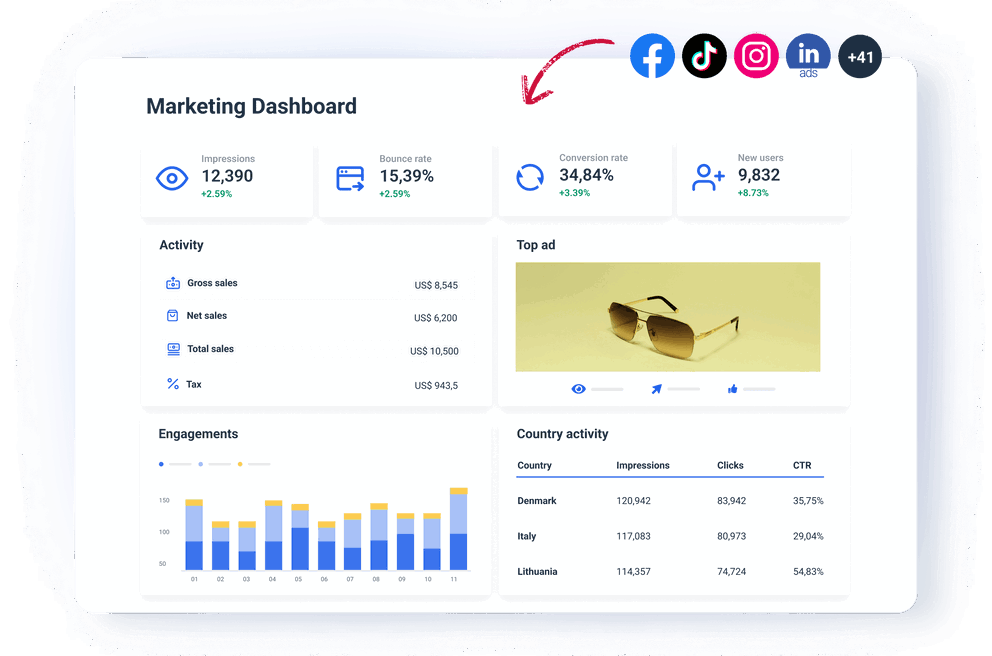
Effortless cross-channel insights at your reach. Add any marketing channel to your report and pick the widgets to visualize the data you want. Compare the results from multiple paid ads or social media platforms or blend related metrics from multiple sources for a total count from different channels.  
Cross-channel reporting

Stay on Track With Marketing Goals

Show your clients how close you are to hitting success with every report you send. Our Goals widget features a visual progress bar highlighting how your marketing efforts come up against set objectives. Create goals on any metrics to break up the monthly performance targets into day-to-day action items. 

Stay on track with your marketing goals

Custom calculations

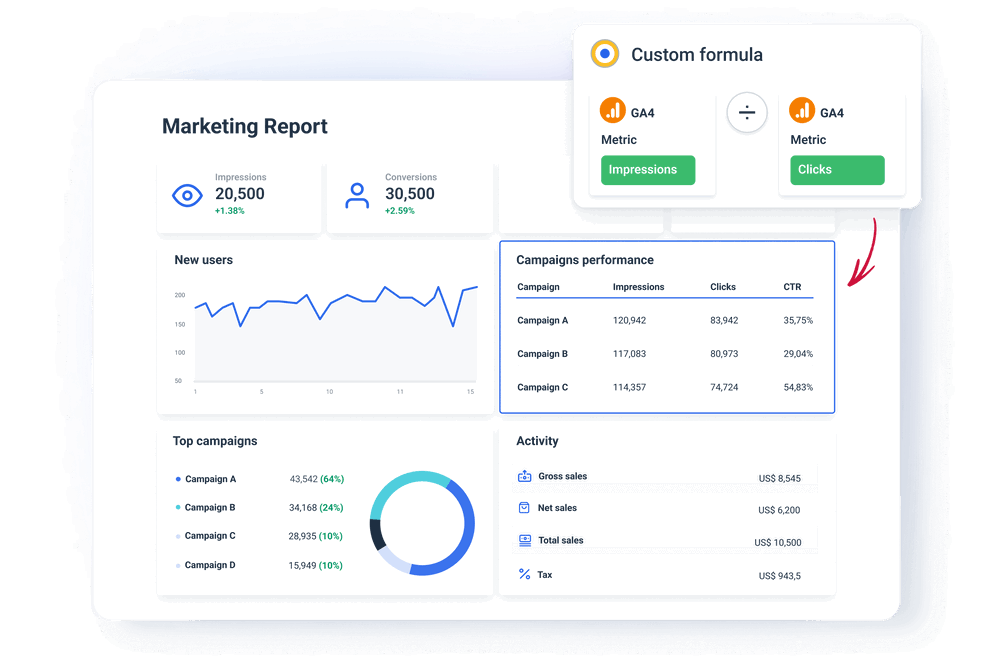
Apply custom formulas for any metric in your reports. Create new or combine existing metrics or change their names so your clients don’t get confused about what’s what. Add agency markup for ad spend on individual platforms. Build new metrics that the source platform’s API doesn’t provide using simple mathematics. 
Custom calculations

Overview – cross-campaign reporting

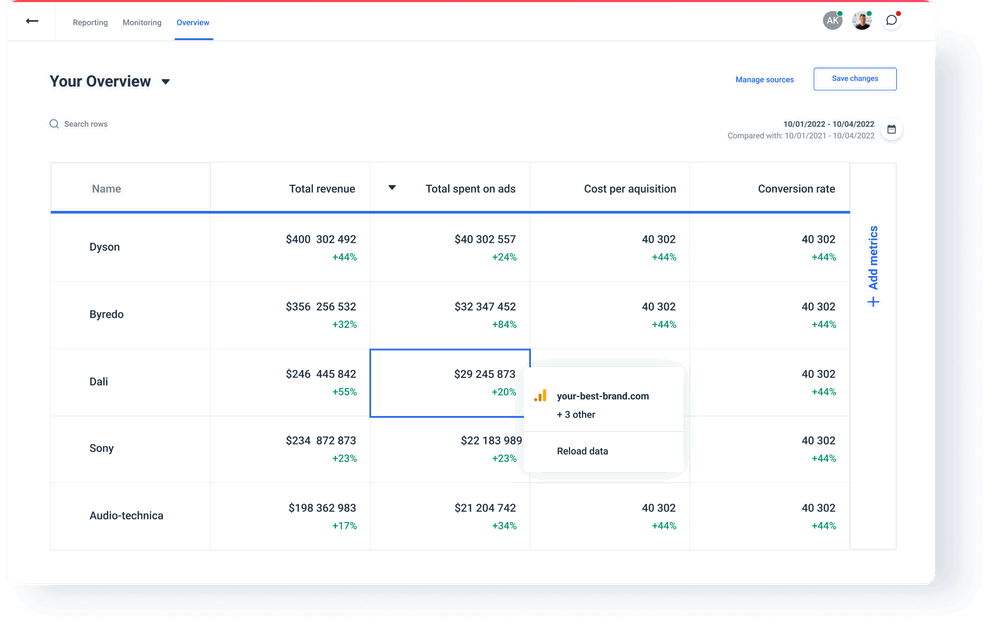
Use the Overview feature as a single source of truth to improve internal agency reporting when monitoring multiple campaigns or accounts. Gather multiple data points from different locations, channels, or campaigns in one tab. Track targets and limits for multiple clients or optimize ongoing campaigns across multiple social media. 
Overview feature in Whatagraph reports

Fully automated marketing reporting at your fingertips

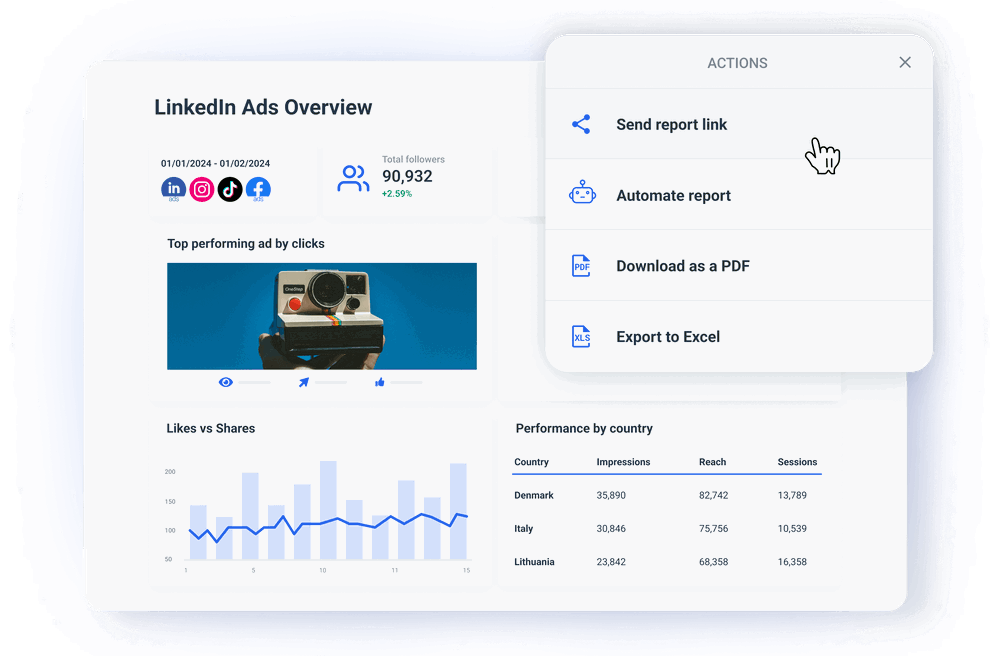
Report automation 101: pick a cadence, and never worry about the send-out. If needed, add a review step before sending to inspect the report and make final edits and comments. Share live reports to build additional trust and transparency with on-demand reporting accessible from anywhere, anytime.  
Fully automated marketing reporting at your fingertips

What is marketing reporting software?

Marketing reporting software allows marketers to quickly generate reports that summarize key metrics such as website traffic, leads generated, and conversion rate. This data can be used to measure campaigns’s success, identify areas of improvement, and make data-driven decisions that lead to growth.  

The manual way of reporting is to visit each marketing platform, export data to spreadsheets or PDFs, and then manually join, clean, and normalize the data, only to paste the visualizations and comments into a format suitable for sharing with clients. This approach to reporting is highly prone to errors, while the lack of accuracy inevitably slows down decision-making.

Automated reporting software solves those problems by automating much of the marketing reporting process. Marketing reporting tools collect data from various marketing channels and provide insights into campaigns’ performance, helping marketers identify which initiatives are working and which need improvement. 

Marketing reporting software typically has dashboard reporting abilities, data visualization, and automated data collection and sendout. 

Marketing reporting software

How to choose the best marketing reporting software for your agency?

In one sentence, we would say — choose the marketing reporting software that solves all your agency reporting pain points, from connecting scattered data sources to providing feedback to clients. 

Broken down, these are the features you must expect from advanced marketing agency reporting software:

Easy to connect any source

You should be able to connect a majority of your sources natively, with no third-party connectors or other tools needed. Third–party connectors are not as reliable as native integrations, as they are prone to breaking off or subject to individual vendors’ policies. Whatagraph lets you connect 45+ sources directly with a few clicks and start reporting. 

Super intuitive and time-saving report building

Good marketing agency reporting software should let your team start reporting with previous experience or training needed. After a brief onboarding, even non-technical staff should be able to create a marketing report from a template or select any of the pre-made reporting widgets and drag and drop it on the page. For different marketing reporting cases, we created more than 50 pre-built templates. You can link multiple reports to one template and save time by editing them all at once. 

Report sharing automation

Your marketing agency reporting tool should also automate the way you share reports. Instead of attaching the report on two dozen of individual emails or using another tool, you should simply be able to set up an automated reporting cadence. The software automatically refreshes the data and sends a PDF export to a list of email addresses at the recurring pre-set time. In addition to automated emails, Whatagraph also has a live sharing option, where you share a link to a live report so the recipients can check for updates whenever they want and even apply different date ranges. 

Easy to set up data transfers and data export

In the case of reporting, storing your marketing data in a data warehouse helps you avoid the API call limits and changing rules of individual platforms. 

select a source of your data transfer

Whatagraph has a no-code data transfer to Google BigQuery that you can complete in a few simple steps. Should you need to report on your stored historical data, connect your BigQuery account as a source and start reporting. If you need to analyze data aggregated by Whatagraph in another BI tool, you can easily export any report dataset as an Excel or CSV file. 

Create an unlimited number of reports and dashboards

There are marketing reporting tools like Cyfe and Metrics Watch that price their packages by the number of dashboards users can create. Others, like Whatagraph, shape the pricing plans by the number of sources and user accounts while allowing you to create as many reports as you want. All of our pricing plans include an unlimited number of dashboards. Create, edit, and send as many as needed. Use our drag-and-drop dashboard tool to create client reporting dashboards in minutes and speed up client reporting. Add and remove widgets or create your own using data from multiple channels.

Easy cross-channel reporting

There are many marketing analytics and reporting tools that have cross-channel functionalities, but not all of them are user-friendly. Collecting data from multiple marketing platforms shouldn’t be different from connecting a single marketing data source. With Whatagraph, you can easily turn any report into a cross-channel report by simply connecting more sources and dropping the visualizations you need. This feature is a lifesaver when comparing different channels' performance or your overall digital marketing performance.  

Amazing support and customer experience

Always go for a digital marketing reporting tool with a live chat where you can talk to the customer support team like you would with your friends. Whatagraph is a simple but highly capable tool and if you ever get stuck, you can contact our CS specialists, get a reply in under 1 minute, and get help with anything you need. 

FAQs

All your questions answered. And if you can’t find it here, chat to our friendly team.

Is Whatagraph a good marketing reporting platform for businesses?

Yes, Whatagraph is a good marketing reporting platform for businesses. It is an ideal choice for companies that want more granular insights into the performance of individual departments and venues. Our data platform helps them connect all business metrics and KPIs into a single dashboard.


But marketing dashboards and reporting is just one part of what Whatagraph does. Businesses can use Whatagraph to connect data from different sources and optimize the metrics through a powerful data transformation functionality. This way, decision-makers, and stakeholders can have a single source of truth with valuable data pouring in from different campaigns, projects, or regions of business.


And then, Whatagraph allows teams to send live dashboard links or schedule automated report sending to stakeholders, so they are always in the loop.


Whatagraph might have started as an online marketing reporting software, but today it’s an all-in-one marketing data platform for connecting, visualizing, and sharing marketing data.

How many marketing channels can I use in a single Whatagraph report?

Easy answer - as many as you see fit! 

What is marketing data software?

Not all marketing reporting software solutions are built the same. Some reporting tools only present already integrated and structured data in dashboards and reports. Others, like Whatagraph, cover the entire data journey, from integrating scattered sources to reporting. In this sense, Whatagraph is a true marketing data software that allows you to connect scattered data, organize, visualize, and share it with stakeholders in a single platform. 

What kind of sources can I report on?

Whatagraph supports a wide range of marketing data sources, including Google Analytics, social media like Instagram and LinkedIn, search engine optimization tools like Google Search Console and Semrush, paid ads platforms like Google Ads (former Adwords), Bing Ads, and Facebook Ads, emailing automation tools like Mailchimp, and CRMs like HubSpot and Salesforce. 


We add new integrations constantly, but if you can’t find a direct integration for your source, you can connect it using our custom API. Alternatively, you can export your source data into Google Sheets or Google BigQuery first and then connect them as a source.

How can enterprises benefit from Whatagraph?

Enterprises can use Whatagraph to connect scattered data across the organization’s marketing stack into actionable reports and high-level overviews that help them evaluate the marketing strategy.. The linked reports option is especially useful for enterprise users that create a large number of reports. It allows teams to edit all reports linked to a master template at once, saving a lot of time for the task. 


Using the Overview dashboard, in-house teams can use the insights to optimize websites, campaigns, and even location performance. For example, Rekom Group, a nightlife leader with multiple brands in Europe, used Whatagraph to monitor marketing data from a country level down to a single venue. 


Enterprises can also benefit from our BigQuery data warehouse integration both as a source and destination for data transfers. This means two things: 


  • Enterprise users can connect any data source to Whatagraph by exporting it to a data warehouse first.


  • They can use Whatagraph’s no-code data transfer to store their business data for safekeeping. 

How can digital marketing reporting software help with your landing page ranking?

Digital marketing reporting software can help with page ranking by connecting data from different SEO apps and giving you a unified view of your pages’ keyword rankings, active backlinks, branded and non-branded search terms, organic CTR, and other SEO-related KPIs.

It’s good to be loved! Our clients are not shy about expressing it.

I made a switch from GDS and Sheets for reporting to Whatagraph, and I am saving literal hours each week on performance report creation. Our small firm actually managed to onboard 2 new clients as a result of all the time we saved on managing data and reporting. The customer service is also really helpful and easy to reach.

Mindaugas S., Marketing Consultant Capterra logo for Whatagraph review

Capterra verified review by

Mindaugas S., Marketing Consultant

Having active customer support to help fix any issues was a big contributor, but we also really liked the ability to save templates and connect sources to multiple charts/widgets at once without having to edit them individually. And having the grid layout is much easier to stay consistent with than the free form setup that Data Studio has.

Nico T., Media Planner Capterra logo for Whatagraph review

Capterra verified review by

Nico T., Media Planner

The system has standard templates that are easy and fast to use. Also you can build your own report with lightning speed. It is very easy to use, has a lot of integration, and let get started very fast.

Rasmus Bernt K., External Senior Management Consultant Capterra logo for Whatagraph review

Capterra verified review by

Rasmus Bernt K., External Senior Management Consultant

We love Whatagraph - we would definitely recommend and our account manager is great! I love how easy this tool is to use, everyone on the team finds it much more user-friendly than other dashboards. Integration was easy, we sent some example reports to the team who duplicated these for us. We literally had to log in and send it to our clients!

Stephanie S., Digital Director Capterra logo for Whatagraph review

Capterra verified review by

Stephanie S., Digital Director

We are showing our clients the work that we're doing for them and this is incredibly important for our clients ROI. They want to see results and having a tool like Whatagraph that can show data from virtually every source we use is hugely important.

John S., SEO Strategist Capterra logo for Whatagraph review

Capterra verified review by

John S., SEO Strategist

The tool is easy to use; you do not need to have development resources. Even my junior project managers are capable of making campaign reports in minutes. There are a lot of pre-made templates you can use as well as many pre-made widgets.

Erman E., Marketing Specialist Capterra logo for Whatagraph review

Capterra verified review by

Erman E., Marketing Specialist

Really easy to connect data sources within the tool. The library of report templates has been helpful. The customer support team has been responsive to all of our needs. Our team enjoys the simplicity of setting up the reports and how the data is presented.

Brent N., Director of Operations Capterra logo for Whatagraph review

Capterra verified review by

Brent N., Director of Operations

Easy to create really beautiful graphs and reports which can help other team members to understand the most important takeaways. I especially like the automated report function, so I don't have to check on the same thing repeatedly.

Orsolya S., Online Marketing Manager Capterra logo for Whatagraph review

Capterra verified review by

Orsolya S., Online Marketing Manager

Need more help with getting started?

An image of the Whatagraph dashboard, with a custom reporting template

We can set up your report campaign for you!

If you need help with setting up Whatagraph - our team can create your campaign reports!

Ready for insights?

It's time to focus your time on the tasks that really matter, and let us worry about your marketing analytics. Start your free 7-day trial.

  • Free for 7 days
  • No credit card required
  • Live chat support
  • Cancel anytime
Start Reporting For Free

No credit card required

Cross channel reporting template with Whatagraph
G2 logo

Whatagraph is a fast and easy-to-use platform for monitoring and reporting on marketing performance. It enables marketing teams to consolidate their data from all channels, organize it, and turn it into dashboards and reports for internal use or external sharing.

2024 Marketing Data Platform | Whatagraph. All Rights Reserved, Whatagraph B.V. ©