AI-ready marketing
intelligence built for scale
One foundation for your cross-channel marketing data.
Define metrics once and trust them everywhere—in your
dashboards, client reports, and every AI tool you use.
Define metrics once and trust them everywhere—in your
dashboards, client reports, and every AI tool you use.
Trusted by 1,000+ forward-thinking marketing agencies and brands


Today, reporting is a chaotic stack your team needs to hold together.
Whatagraph holds all of that stack in a single product with one governed data foundation.
Stop chasing numbers across multiple tools
The same metrics in your report, your dashboard, and your AI chat, without anyone triple-checking.
Your numbers agree. Finally.
Set up each metric once—the same CAC, ROAS, and CPL show up in your reports, your dashboards, and your client decks. No more reconciling.
Data hubCustom metrics & dimensions
Source groups & blendsCurrency conversion
Data hubCustom metrics & dimensions
Source groups & blendsCurrency conversion
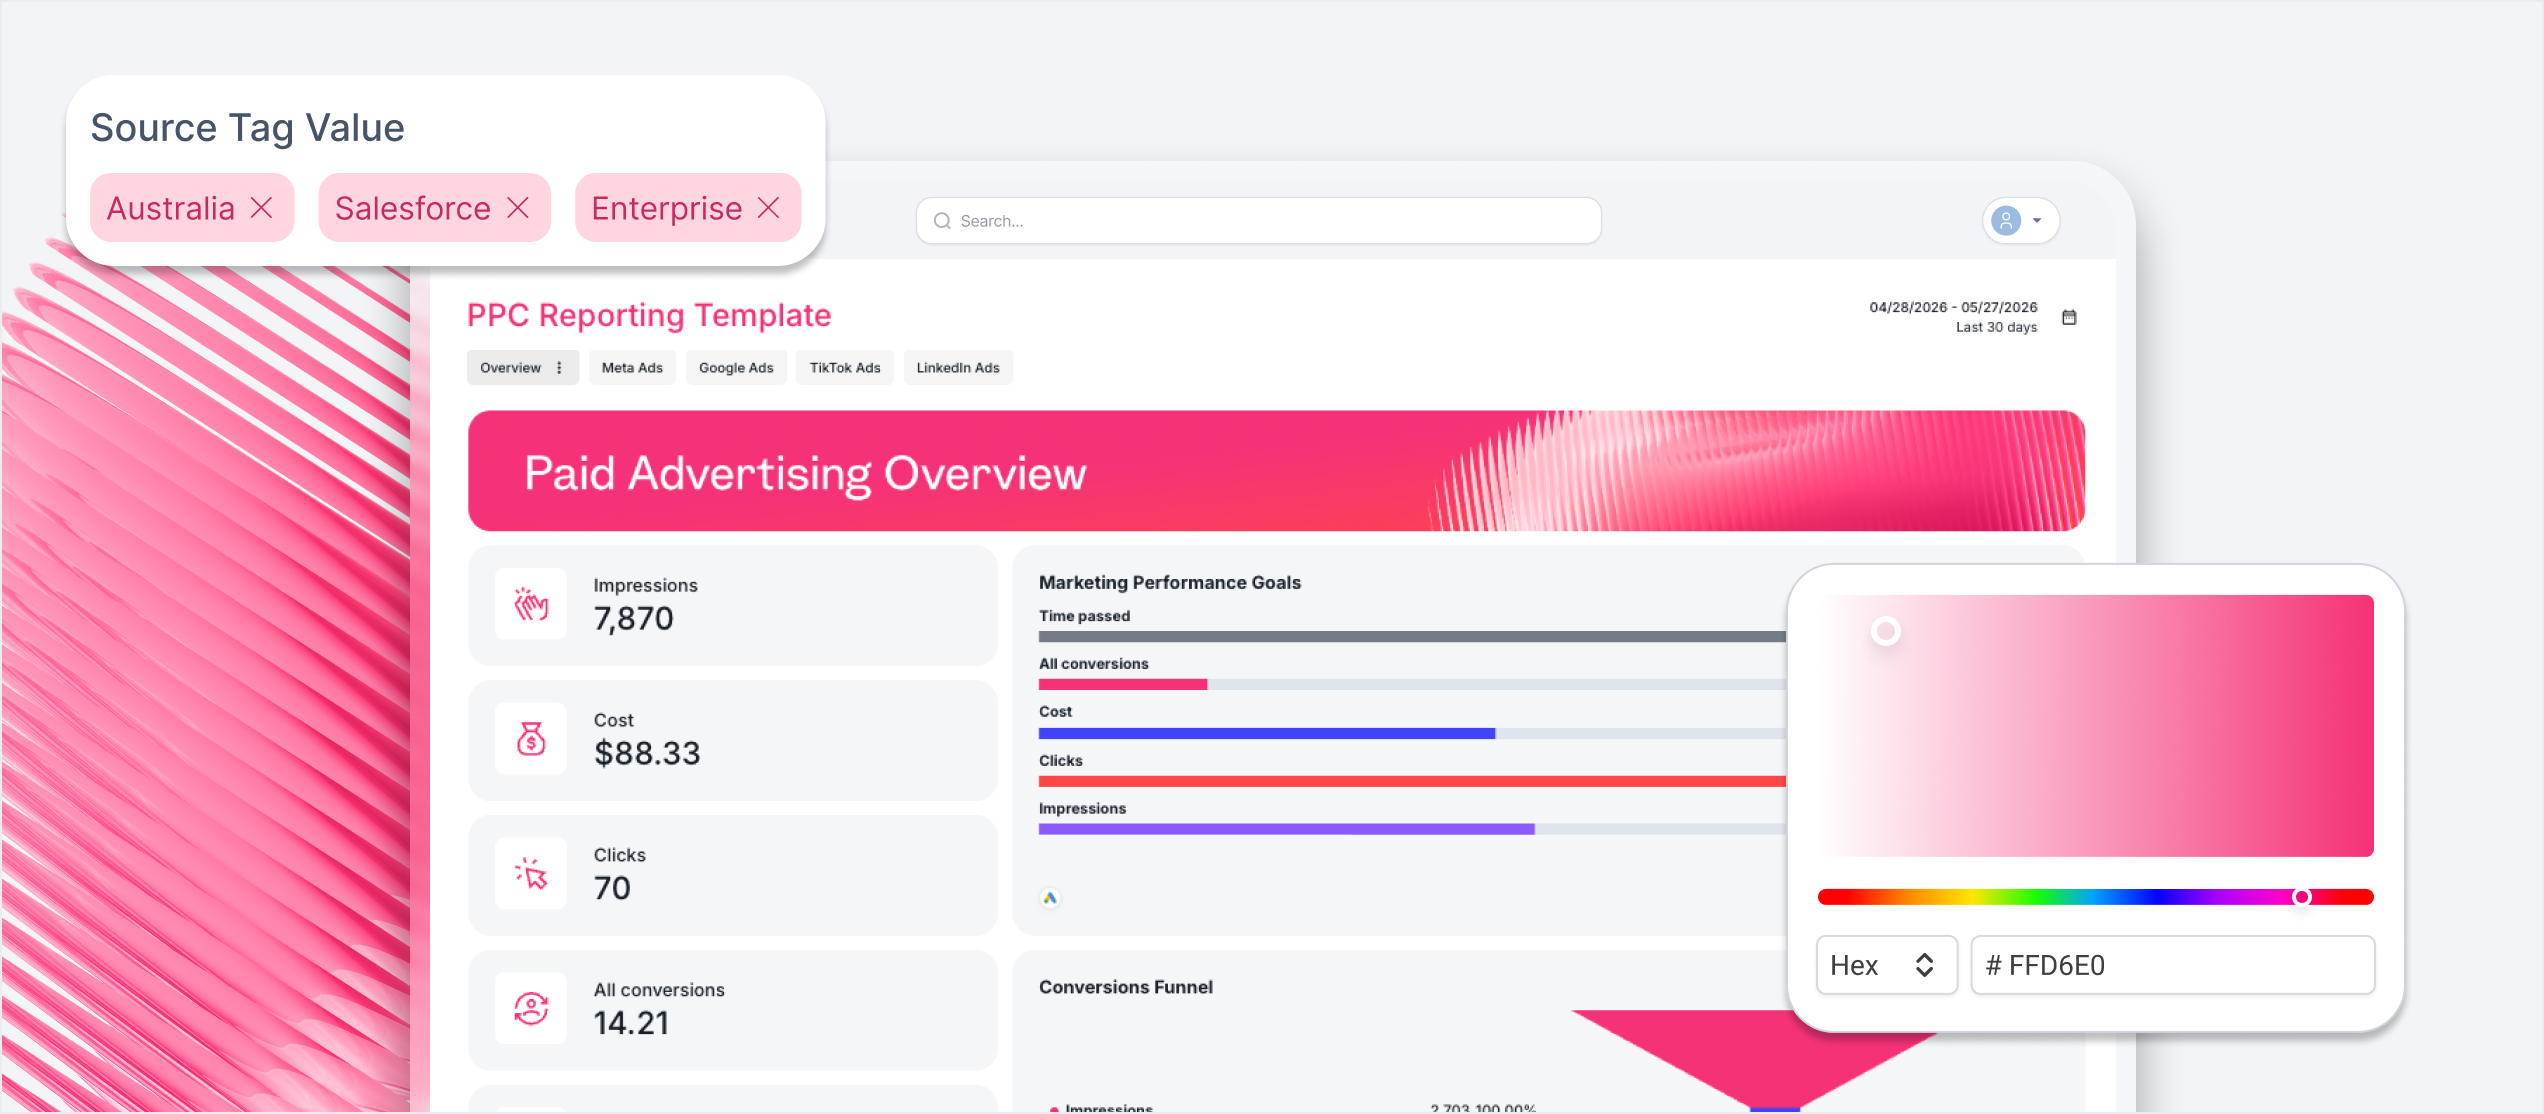
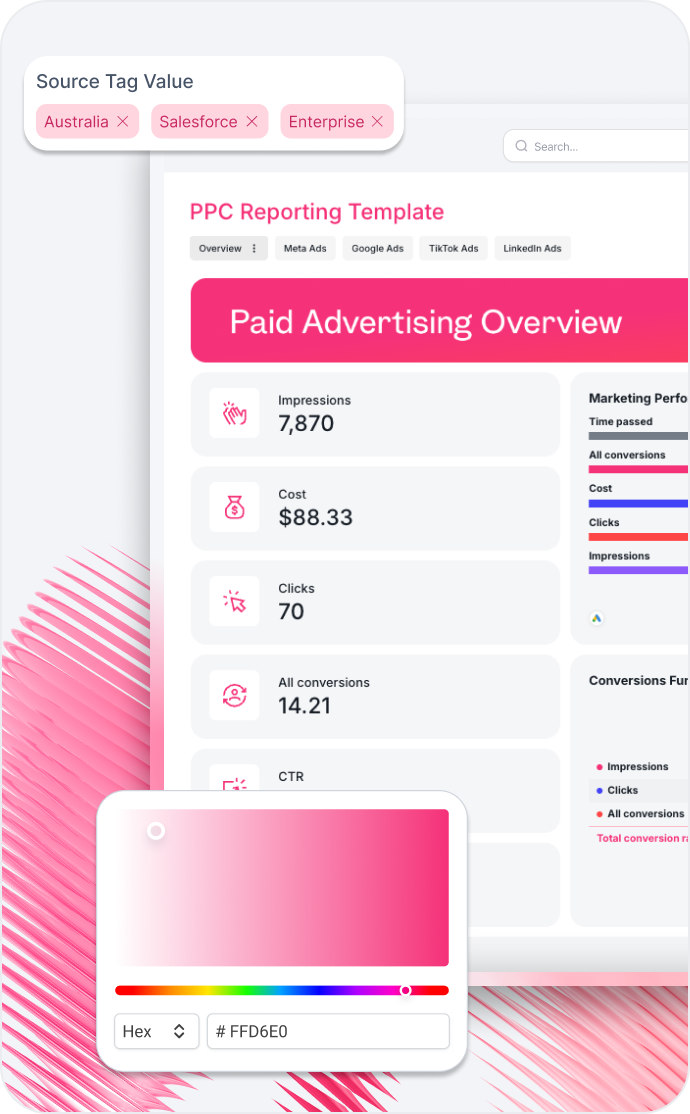
Build it once. Run it everywhere.
Add the tenth client, the fiftieth location, or a new market in one sitting, not a week of dashboard rebuilds. Templates do the setup work.
Linked reportsScalable themes
Source tagsWhite-label
Branded client folders
Linked reportsScalable themesSource tags
White-labelBranded client folders
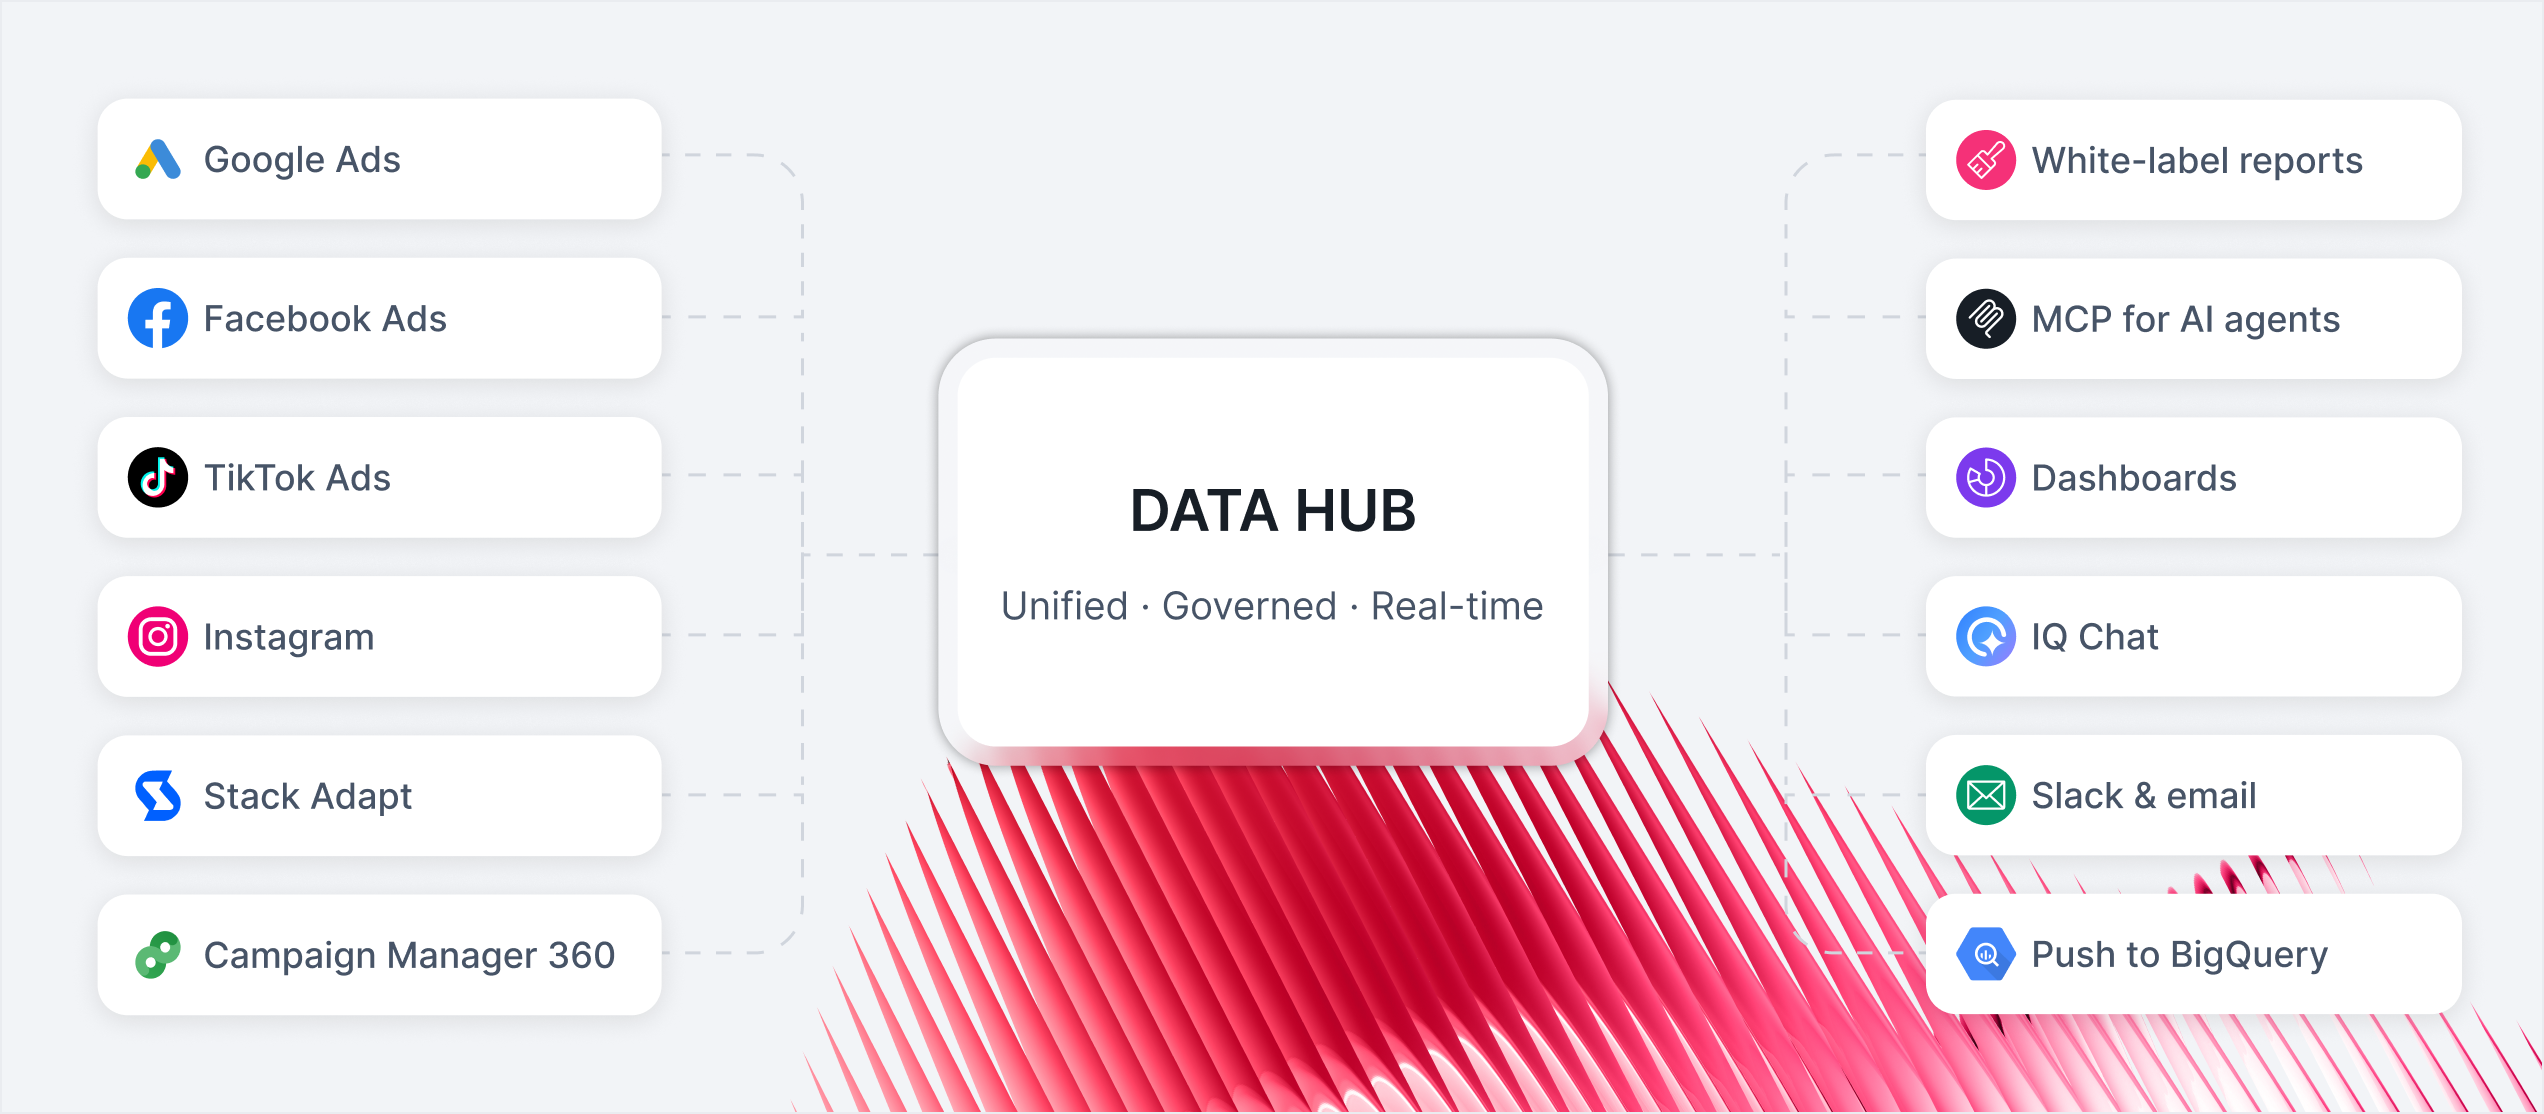
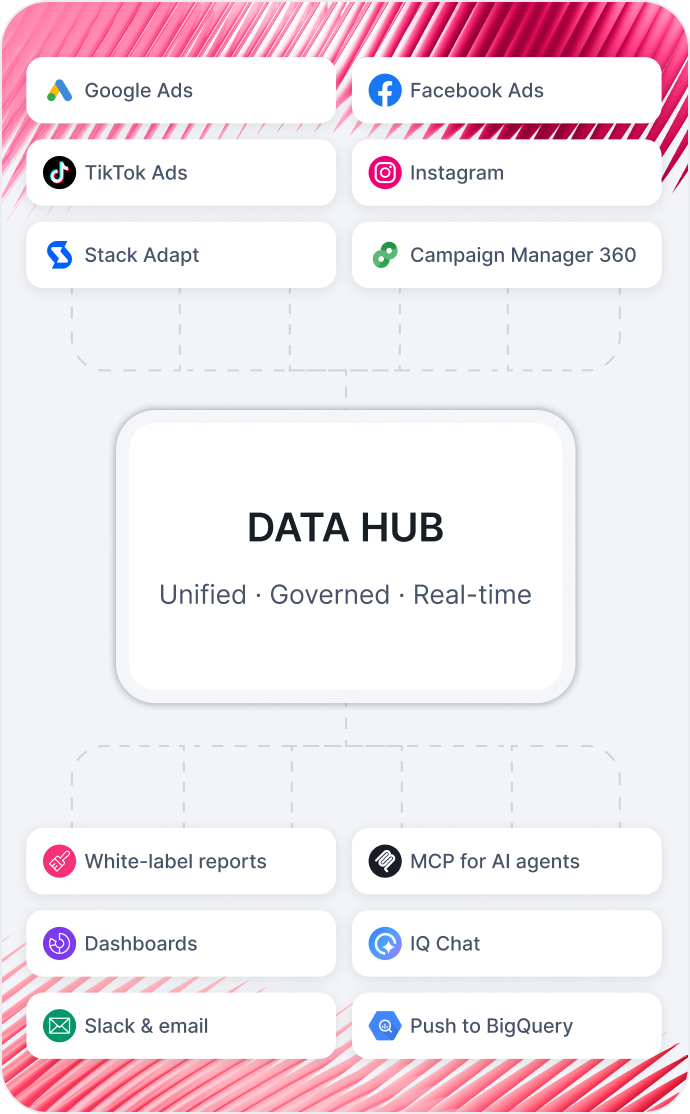
Reports or AI. You choose.
Reports for the client. Dashboards for the team. AI tools for the questions you used to ask the data person. Whichever direction reporting goes from here, you’re covered—all running on the same data foundation.
White-label reportsDashboards
MCPSlack & email
BigQueryIQ chat
White-label reportsDashboardsMCP
Slack & emailBigQueryIQ chat

One platform that replaces
your breaking reporting stack.
See how Whatagraph works and why MCP changes what's possible.
Built for teams reporting at scale
Whether you run 50 client accounts, 200 locations or 100 brands ecommerce—one governed data foundation handles it all.
Real numbers from teams that made the switch
Forward-thinking teams have already switched to AI-ready marketing intelligence.

Whatagraph has become an essential partner for scaling our reporting, and my teams love it because it saves so much time. We’d recommend it to any team looking to automate data reporting and use AI for insights.

Danielle Roberts
Director of Implementation & Support @ Rentable