Not Another Agency Reporting Tool.
A Data Foundation.
Client reports, internal dashboards, BigQuery, and AI tools: all running from one governed place, without a data team in the middle or manual work holding the seams together.
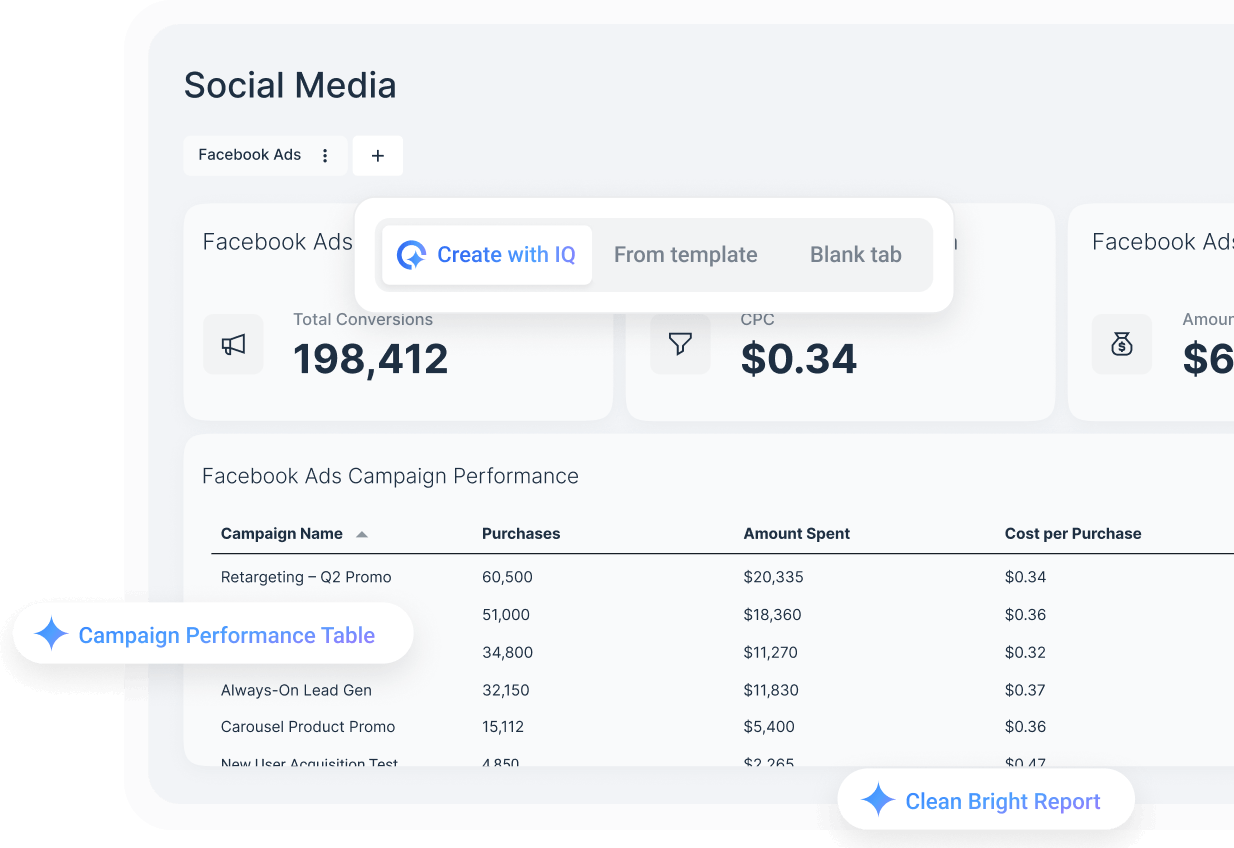












How to automate your agency reporting with Whatagraph
Connect your client data
Connect Google Ads, Meta Ads, LinkedIn, GA4, Ahrefs, Klaviyo, and 60+ other sources directly from the Whatagraph workspace.
Need a source that isn't natively supported? Bring it in via Google Sheets, BigQuery, or custom API. It all lands in the same place.
Organize and govern your data
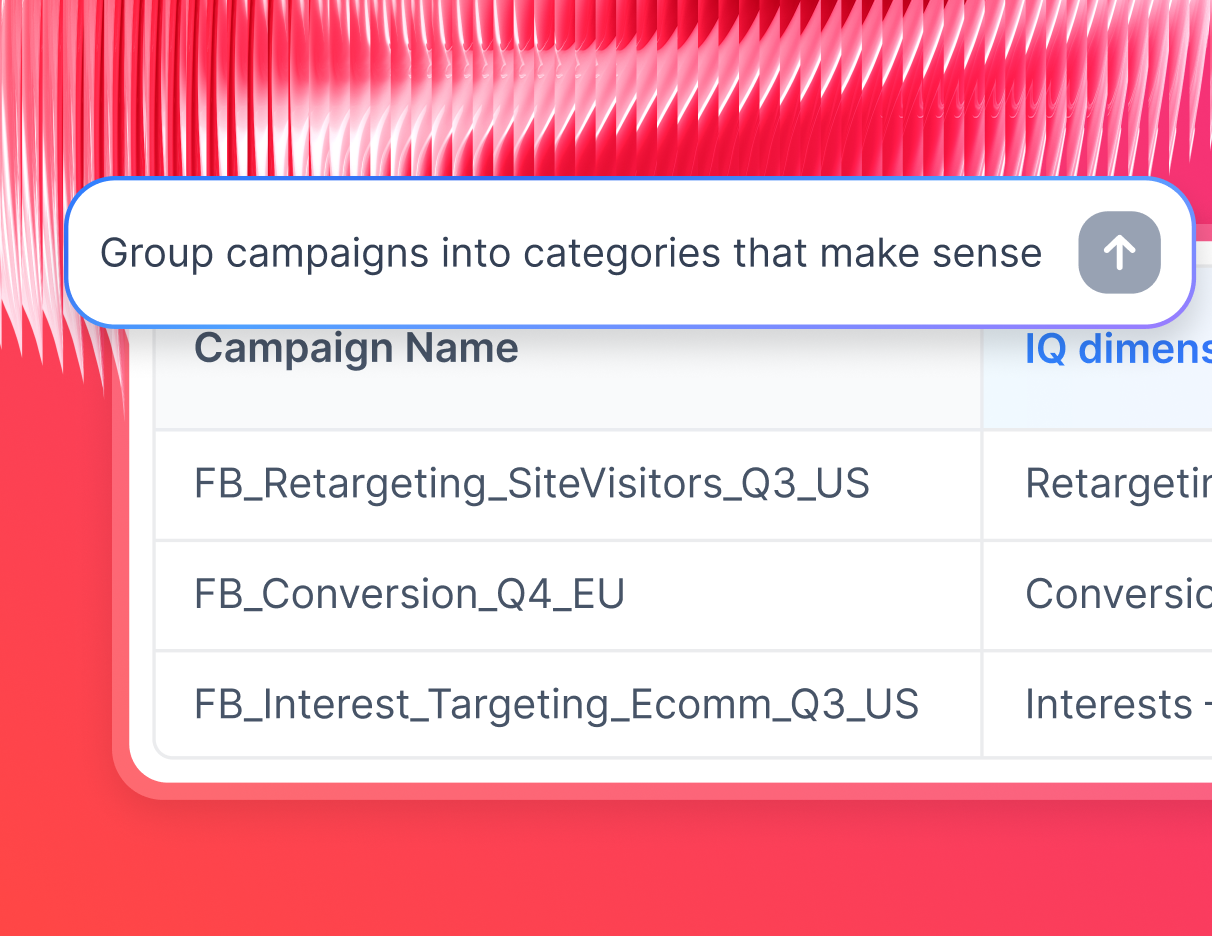
Group campaigns into categories that make sense for your agency. Unify metric names across channels. Build custom dimensions and blended metrics — ROAS across Google and Meta or blended CPL across channels — and define them once. Every report, every client, every dashboard uses the same definition going forward.
No more reconciling numbers the night before a client review.
Build reports your way (or let AI build them)
Prefer full control? A drag-and-drop canvas with custom formulas, adjustable layouts, and flexible visualizations give you complete ownership over every widget.
Working across 50+ clients? Build one master template and link every client report to it. Update the master once and every linked report updates automatically. One change. Every client covered.
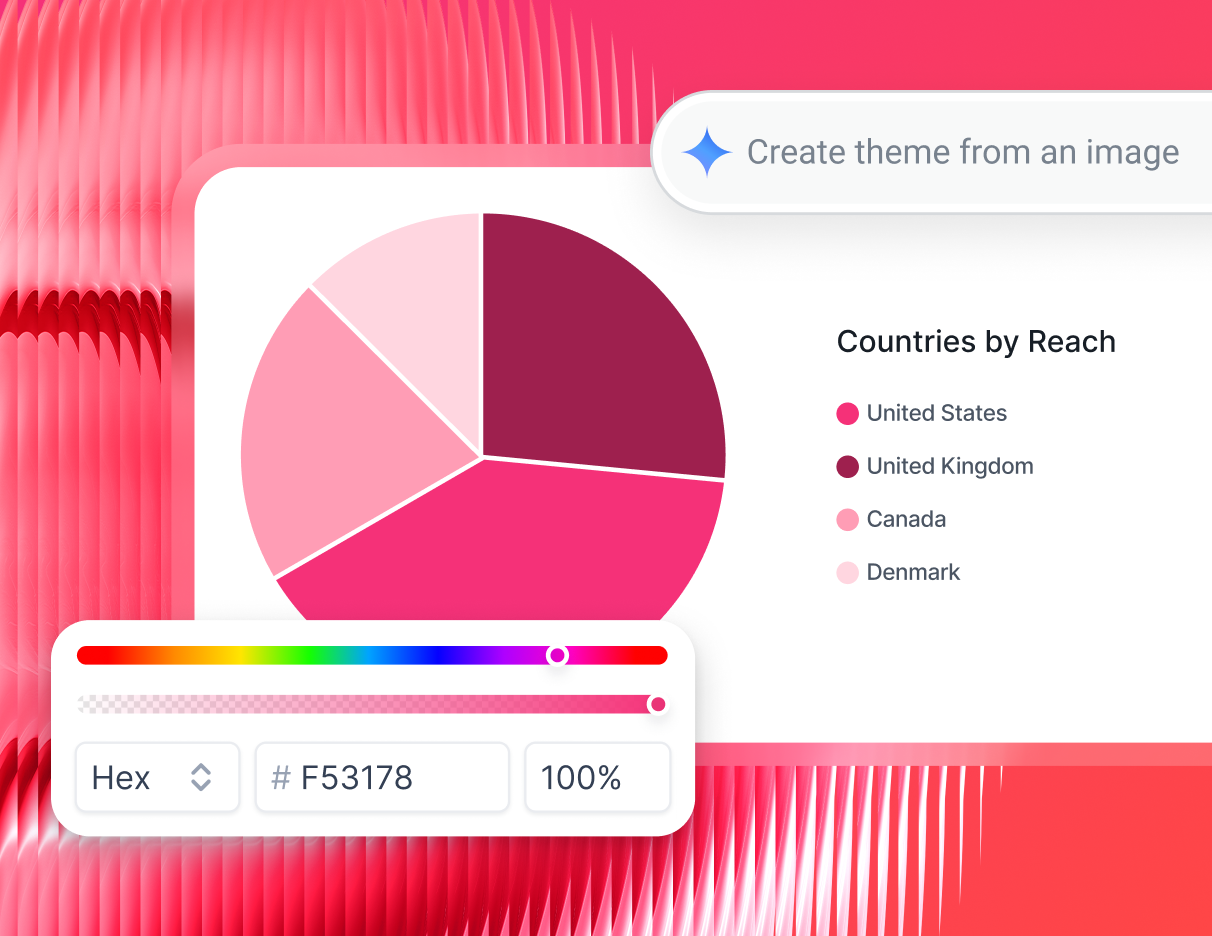
Analyze performance across all client accounts
Need a quick answer between reports? Type in a prompt like "Compare paid performance across all accounts this week" and get an accurate, plain-English answer pulled from your governed data. No pivot tables, no digging through platform dashboards.
Set goals and alerts so your team gets notified before the client notices a problem.
Filter everything by client, channel, campaign type, or account manager, however your agency is structured.
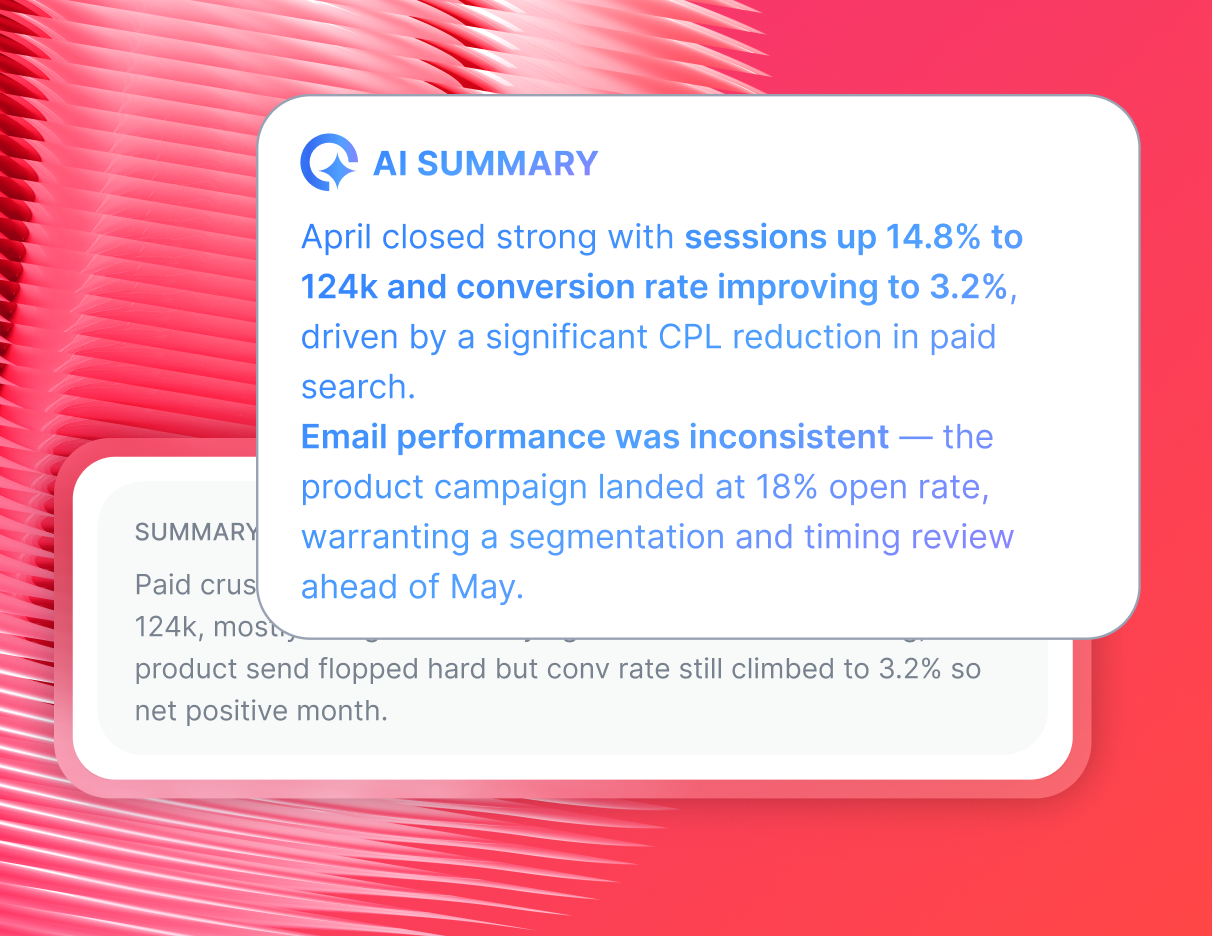
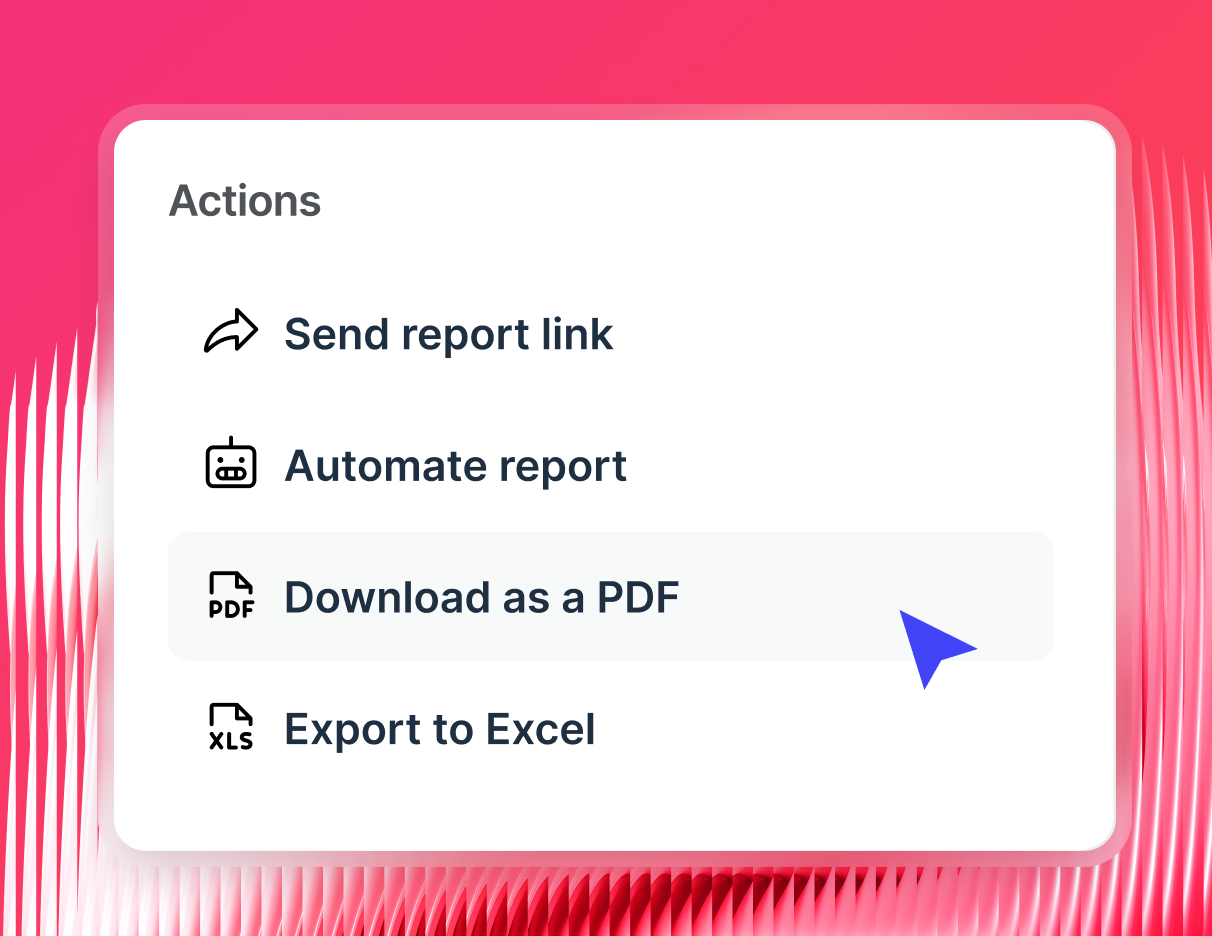
Automate and share client reports
For clients who want to explore their own numbers, turn on IQ Chat so they can ask questions directly from the report.
Ship your data to BigQuery for storage or Looker Studio, Claude, and ChatGPT for further visualization.
Why you've already outgrown the status quo
Looker Studio + Supermetrics
Works until it doesn't. Connectors break, blends collapse above a certain data volume, and you've added a stack-maintenance job to your week.
Spreadsheets and manual exports
Every new client adds another file, export, formula no one else knows how to touch. It's not a reporting workflow, it's a liability.
Simple marketing reporting tools
Built for the agency you were three years ago. For multiple clients running complex multi-channel campaigns, the data model, the blending capability, and the scalability aren't there.
Funnel + Looker
Funnel moves the data. Looker displays it, if a data team builds and maintains the connection. The seams between them are where the cost and the manual work live. It's two tools doing the job one platform should.
Channel APIs wired to Claude
Every question pulls raw data per source, per call: no aggregation, no normalization, no governance. Works for one client, one question. Structurally broken at agency scale.
Custom in-house builds
Gives full control at the real cost of a data team or contractors. Most agencies are not able to justify the headcount to maintain it.
Agencies are already seeing the difference
Whatagraph's AI is saving so much time and energy for our marketing specialists. We now have more time to focus on strategic things that help both our agency and our clients grow.

Lars Maat
Co-Founder @ Maatwerk Online

Whatagraph took us to the next level with our clients and within our team. Our relationships with clients have been amazing, and we’ve even been able to retain them longer.

Kim Strickland
Digital Marketing Specialist @ Peak Seven
The biggest reason we chose Whatagraph was its holistic approach. We can blend data from different channels and see in one view what needs to be changed.

Tanja Keglić
Performance Marketing Manager @ Achtzehn Grad
The biggest advantage of Whatagraph is having everything in one place. Funnel was two to three times more expensive than Whatagraph.

Linda van Baal
Online Marketing Consultant @ YourFellow
What your agency gets with Whatagraph
Stable integrations without connector breakage
Our fully managed data integrations ensure a seamless connection process and a consistent 30-min data refresh across all plans.
Transparent and scalable pricing
Whatagraph's source credits scale predictably with your plan, with no hidden fees per connectors, dashboards or clients, and no surprise bills mid-contract.
Priority live chat support on every plan
Every Whatagraph plan includes live chat support with a <4-minute response time. Dedicated CSMs are available on higher plans too.