All-in-one marketing platform that takes manual work and hassle away from the data workflow

Replace multiple slow and complex tools with one platform. Unlike others on the market, Whatagraph is easy to use, reliable, and makes working with data swift and simple for anyone in a team.

All Reporting and Data Features in One Place
Trusted by 1,000+ marketing agencies around the world
Whatagraph image
Whatagraph image
Whatagraph image
Whatagraph image
Whatagraph image
Whatagraph image
Whatagraph image
Whatagraph image
Whatagraph image
Whatagraph image
Whatagraph image
Whatagraph image

All your marketing data in one place. No third-parties in the middle

SVG image
Direct native integrations with your marketing sources

Direct native integrations with your marketing sources

50+ fully managed integrations with social, paid advertising, email, SEO, CRM, and other marketing sources to get all your data together. It takes a few clicks to connect and all those sources and channels are easy to manage in one neat hub.

SVG image
CustomAPI, Google Sheets, and GoogleBigQuery as sources

Custom API, Google Sheets, and GoogleBigQuery as sources

Connect unique or specific data from any source that is not in the integration list via spreadsheets, direct API connection, or a warehouse. Instantly available in your reports and dashboards.

Intuitively organize and manage your data without coding or tech knowledge

SVG image
Rename, unify, or translate data outputs across your reports and dashboards

Rename, unify, or translate data outputs across your reports and dashboards

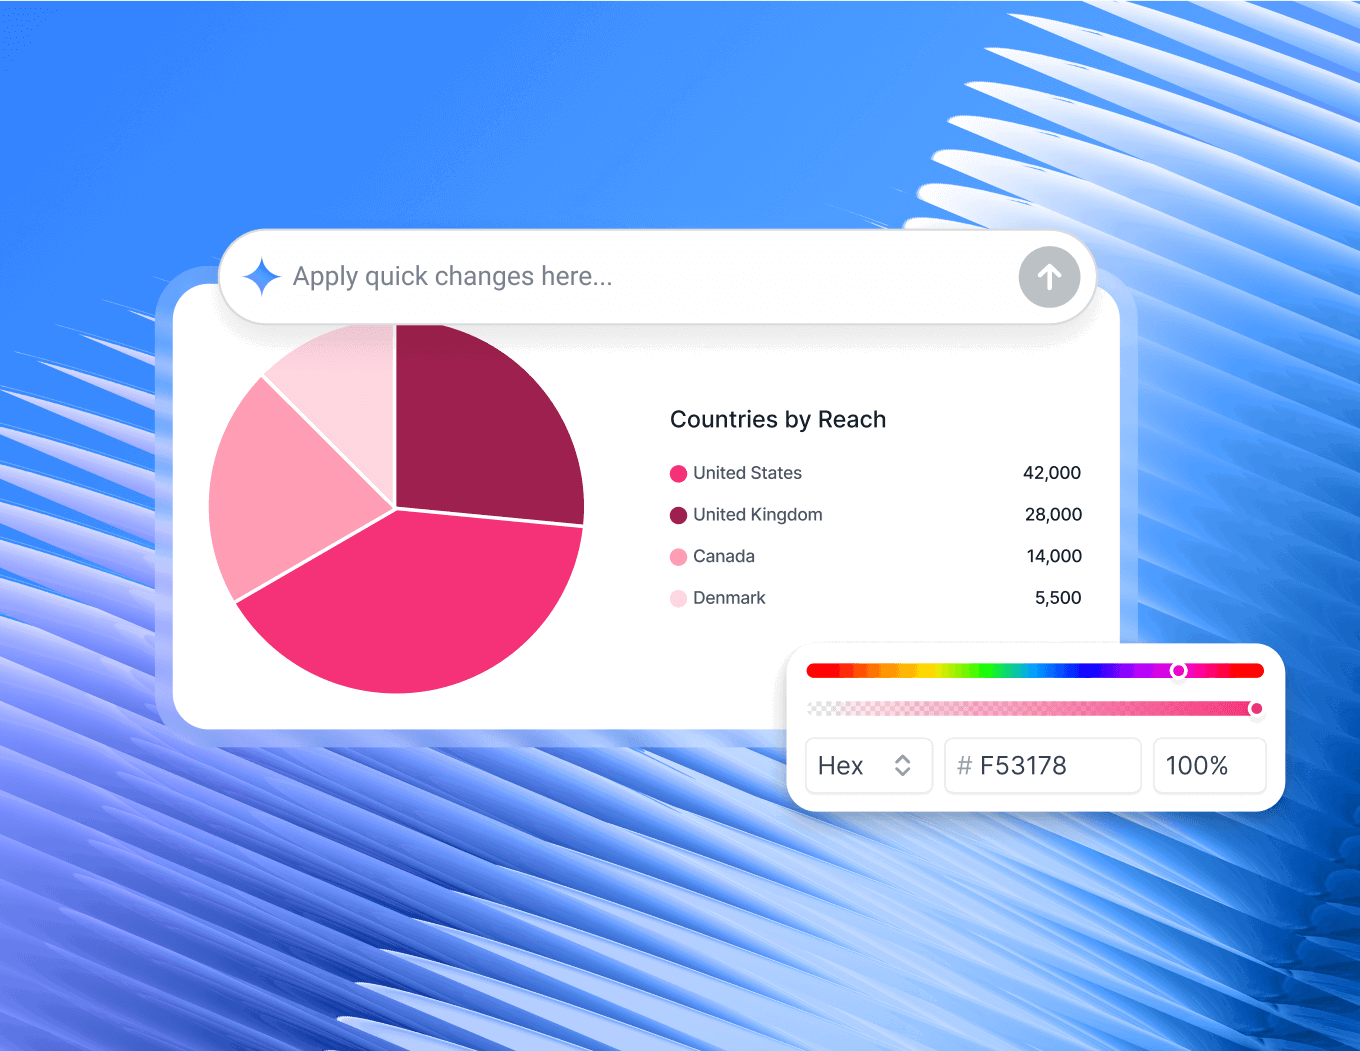
Change how your internal naming conventions are shown, standardize things named differently across sources (like dimensions and countries) to make your reports consistent.

SVG image
Easy-to-use data grouping and aggregation

Easy-to-use data grouping and aggregation

Group campaigns together, combine data from multiple countries in one tier, see total performance metrics of multiple landing pages, and more.

SVG image
Blend cross-channel data together to intuitively perform advanced data management

Blend cross-channel data together to intuitively perform advanced data management

Create new cross-channel metrics, add agency markup to all outputs, summarize data from dozens of pages, aggregate campaign data - and instantly visualize it for analysis or presentation.

SVG image
Track ad spend and other monetary metrics in a currency of your choice

Track ad spend and other monetary metrics in a currency of your choice

Multinational companies and large agencies that serve clients with global presence may collect data with different currencies in their reports. This creates confusion and makes it difficult to measure money metrics such as ad spend, cost-per-click, etc. Whatagraph allows users to easily convert currencies from multiple data sources to a currency of choice or set different currencies for different metrics within the same chart. 


Create stunning reports and dashboards 30-70% faster

SVG image
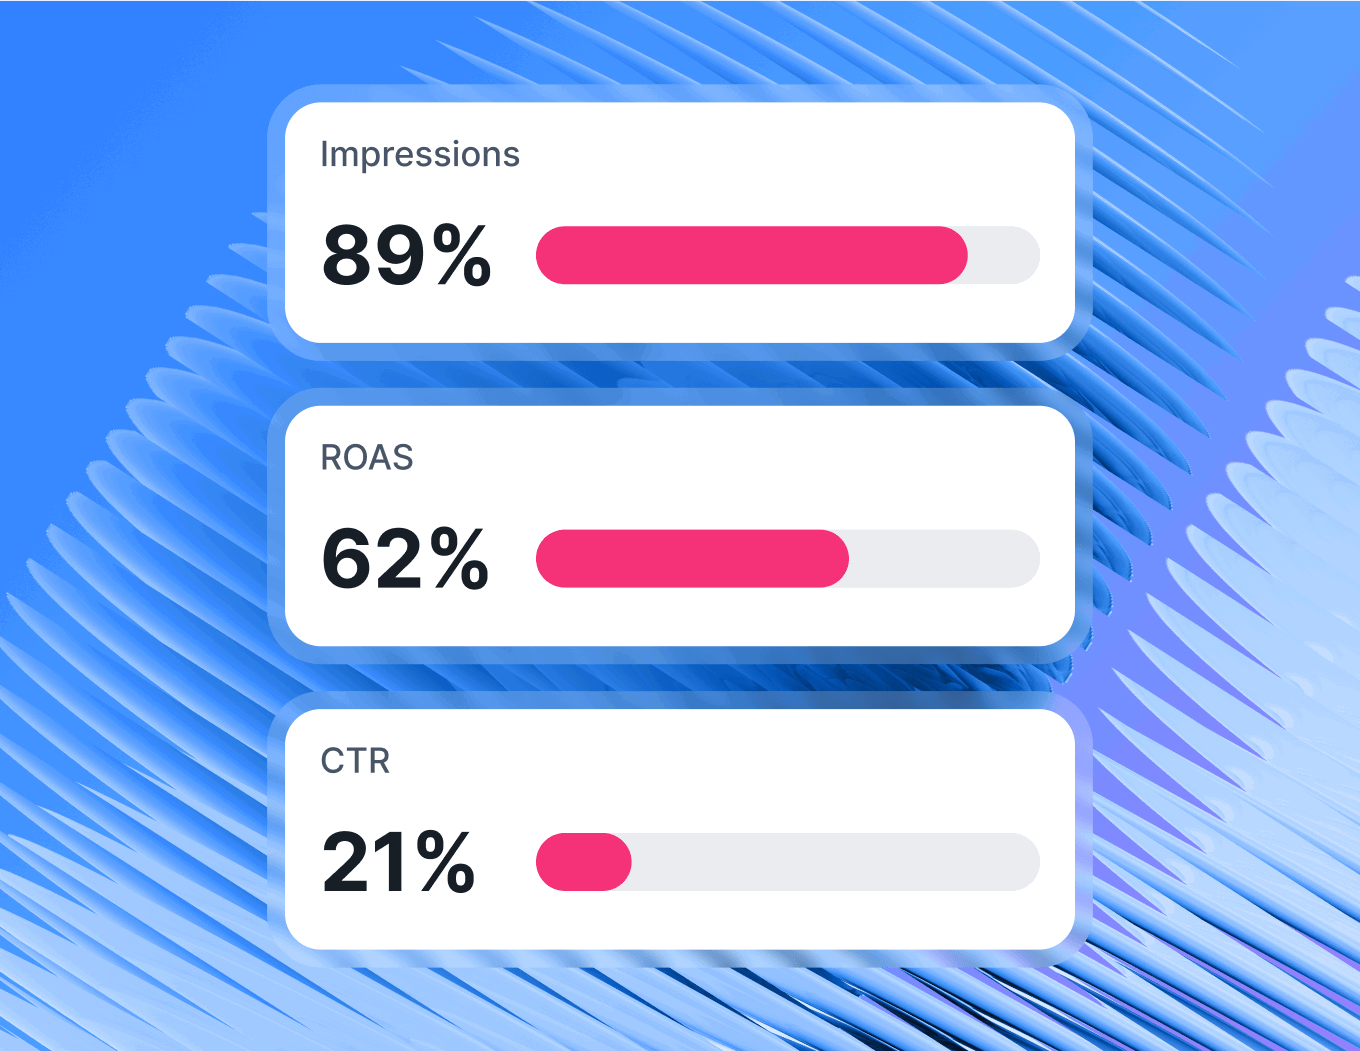
Turn data into visual insights fast with intuitive drag-and-drop

Turn data into visual insights fast with intuitive drag-and-drop

Creating charts and tables, adding goal tracking and visuals, and showcasing ad images or social posts in a well-formatted report takes a few minutes. Pick from a library of pre-made widgets for any integration, or build your own and drop on the page.

SVG image
Save and reuse almost anything as a template

Save and reuse almost anything as a template

Whether it's just one calculation or filter, a widget or a whole report, you can save it as a team template and use it again elsewhere. We've also pre-built some for a quick start or inspiration.

SVG image
Building blocks you can easily edit for any visualization use case

Building blocks you can easily edit for any visualization use case

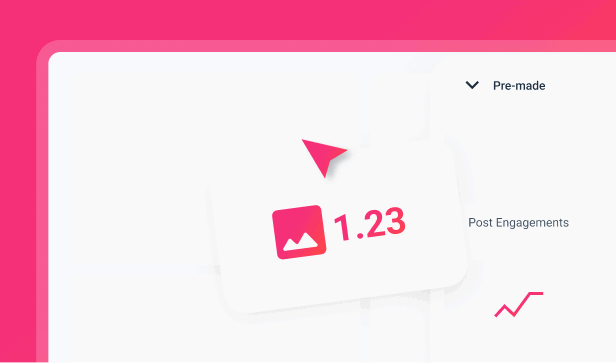
Use an extensive library of pre-made widgets for each integration for instant start. And it takes just a few clicks to build your own charts, graphs, funnels, and more. For complete freedom there are blocks for text comments and custom images.

SVG image
Showcase ad creatives or social posts automatically with media widgets

Showcase ad creatives or social posts automatically with media widgets

Get your ad or post visuals pulled in automatically. Resize, expand, pick the relevant metrics that you need, display copy or ad naming. And it's as easy as editing any other widget.

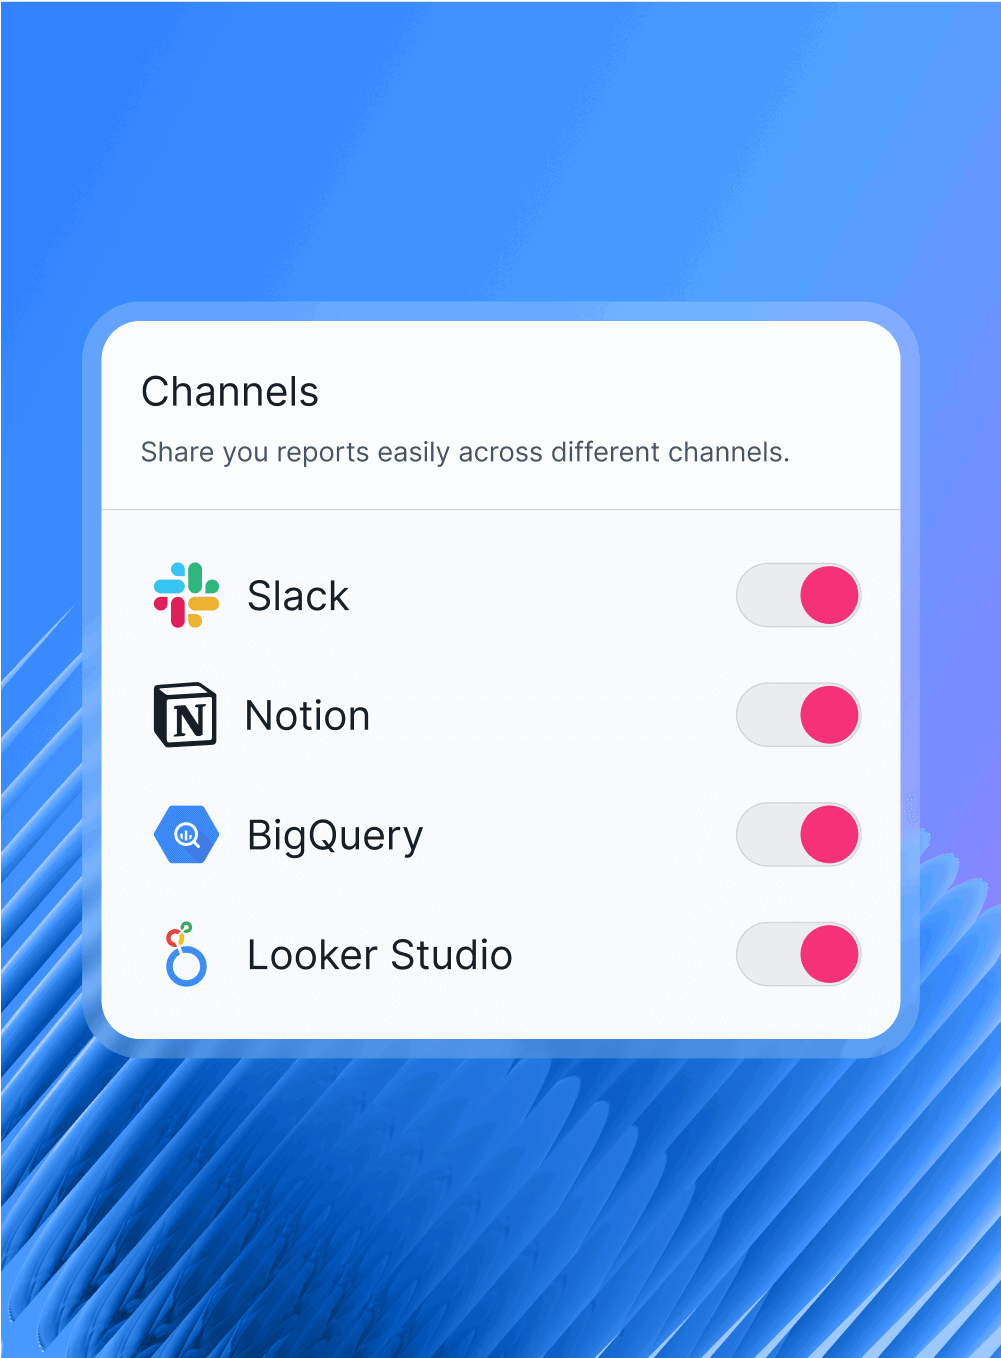
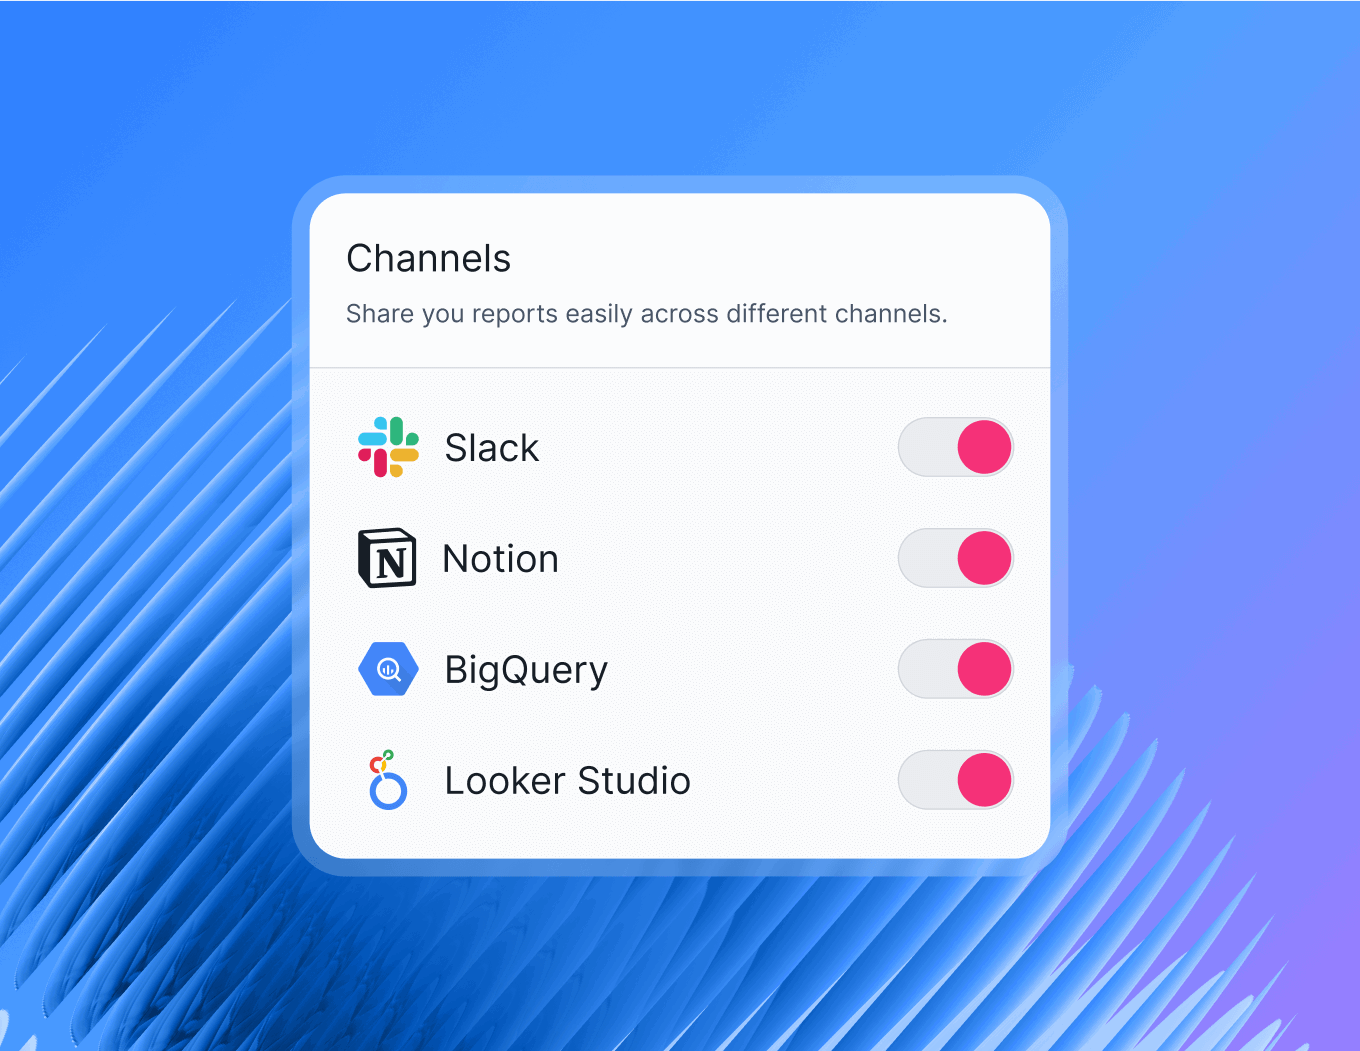
Send marketing data where, when, and how you want it fast and easy

SVG image
Share instant and secure access to interactive live dashboards

Share instant and secure access to interactive live dashboards

Share a link to an on-demand report that updates automatically instead of gathering data whenever a request or question occurs. Give viewers an option to explore the data, change date ranges, and secure it with a password if needed.

SVG image
Eliminate manual work from sending out your reports

Eliminate manual work from sending out your reports

You can automate your reporting emails with PDF reports attached. Set frequency, pick recipients, add a review step if needed and let us do the rest.

SVG image
Own your data on your terms by moving it to BigQuery for storage and analytics

Own your data on your terms by moving it to BigQuery for storage and analytics

Move your data to the BigQuery warehouse in a few simple steps: pick sources, metrics, and dimensions that you need and data transfer schedule. After that, just enjoy the flow. And you can visualize data from BigQuery in Whatagraph, too.

SVG image
Export your data to spreadsheets for storage, analysis or sharing

Export your data to spreadsheets for storage, analysis or sharing

When it's necessary, you can export data with one click in CSV or excel to analyze, store, connect with other tools, share, and customize the data. Download the whole report or separate data points in spreadsheet format.

Get a bird’s eye view across clients, campaigns and more

Create a high-level overview by accounts, teams, regions with a few clicks. Monitor necessary metrics and never loose sight of valuable insights.

Create a high-level overview by accounts, teams, regions with a few clicks
Whatagraph marketing reporting tool

Outstanding support

Get your personalized onboarding and a dedicated manager together with praised customer success team accessible at all times via a live chat.

Start monitoring today!