
TEMPLATE
Annual Marketing Report Template
Use the template to summarize performance, prove ROI, and plan smarter strategies for next year


Give every market the same clean reporting structure, unified naming, and consistent dashboards. Leadership finally gets a global view that’s reliable and comparison-ready.
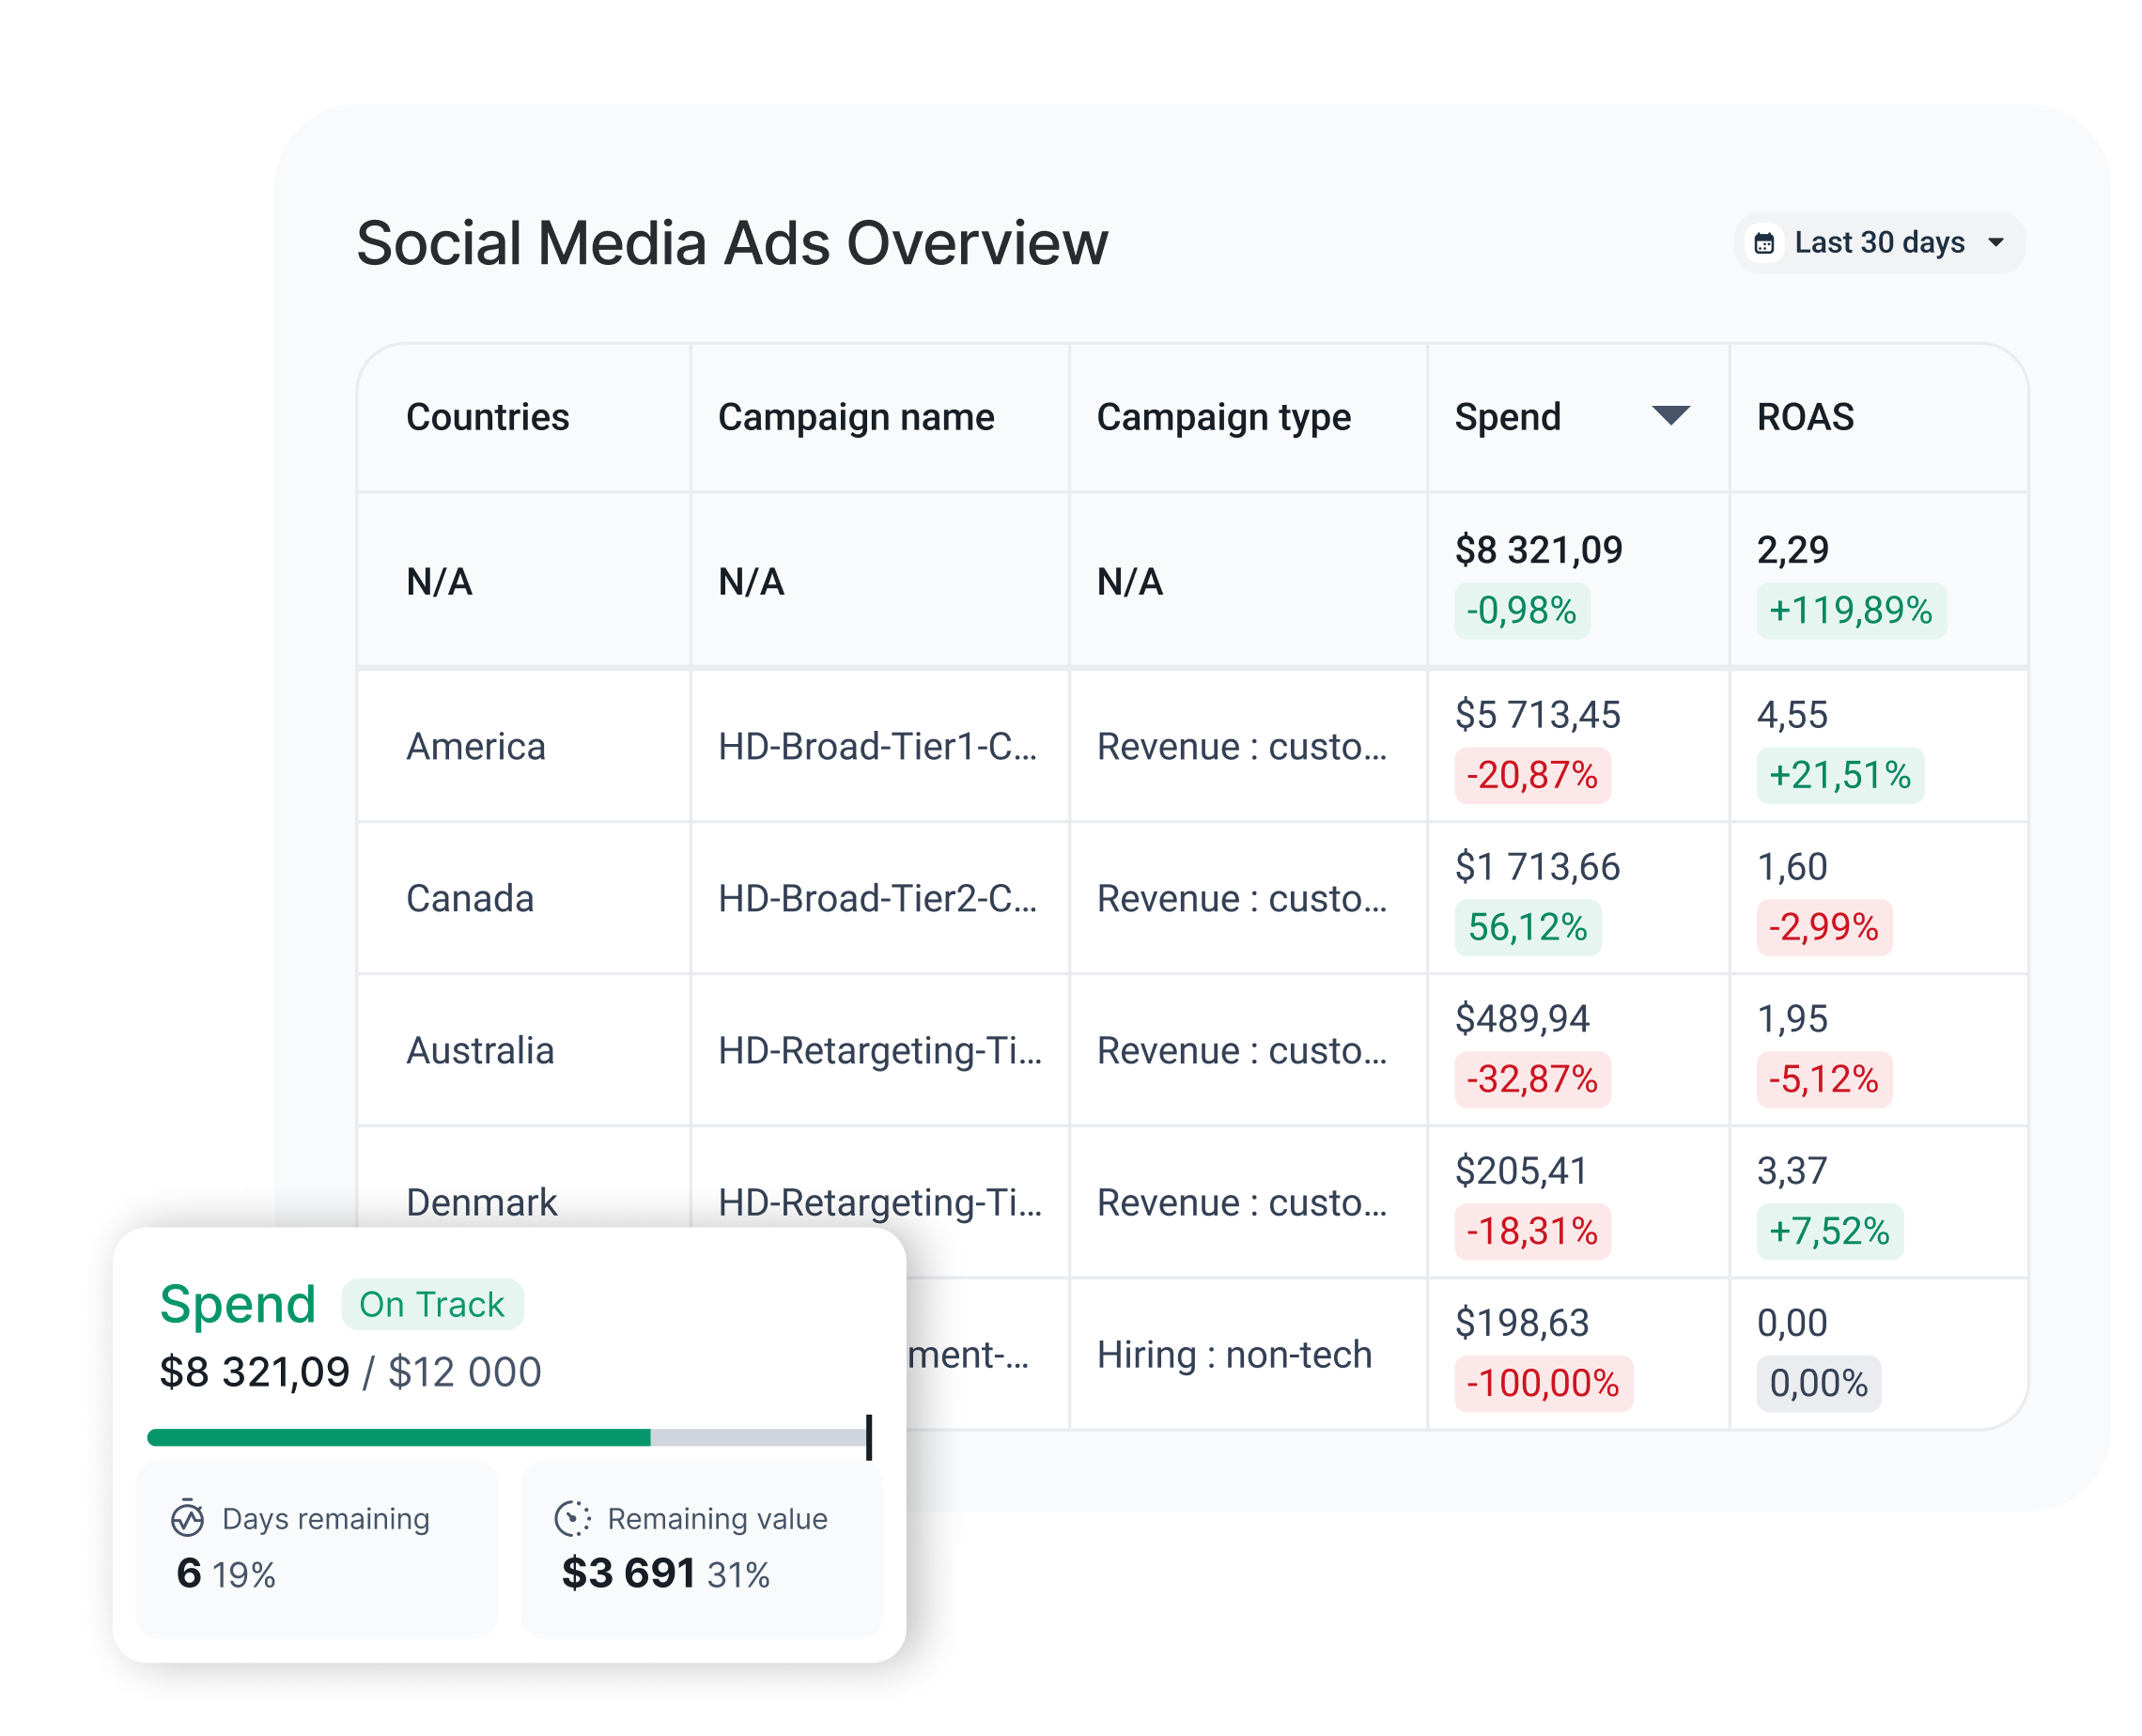
Blend spend and results from every region and channel into a single, high-level overview. Perfect for weekly executive briefings and strategic decision-making.
Automate performance tracking with alerts that surface what matters, so global teams can act on timely insights and never miss a market-level shift.
Convert and unify all spend into one base currency, so finance and marketing teams speak the same language when analyzing budgets and ROI across regions. Use custom dimensions to translate names and labels, and convert the values to local currencies with custom metrics.
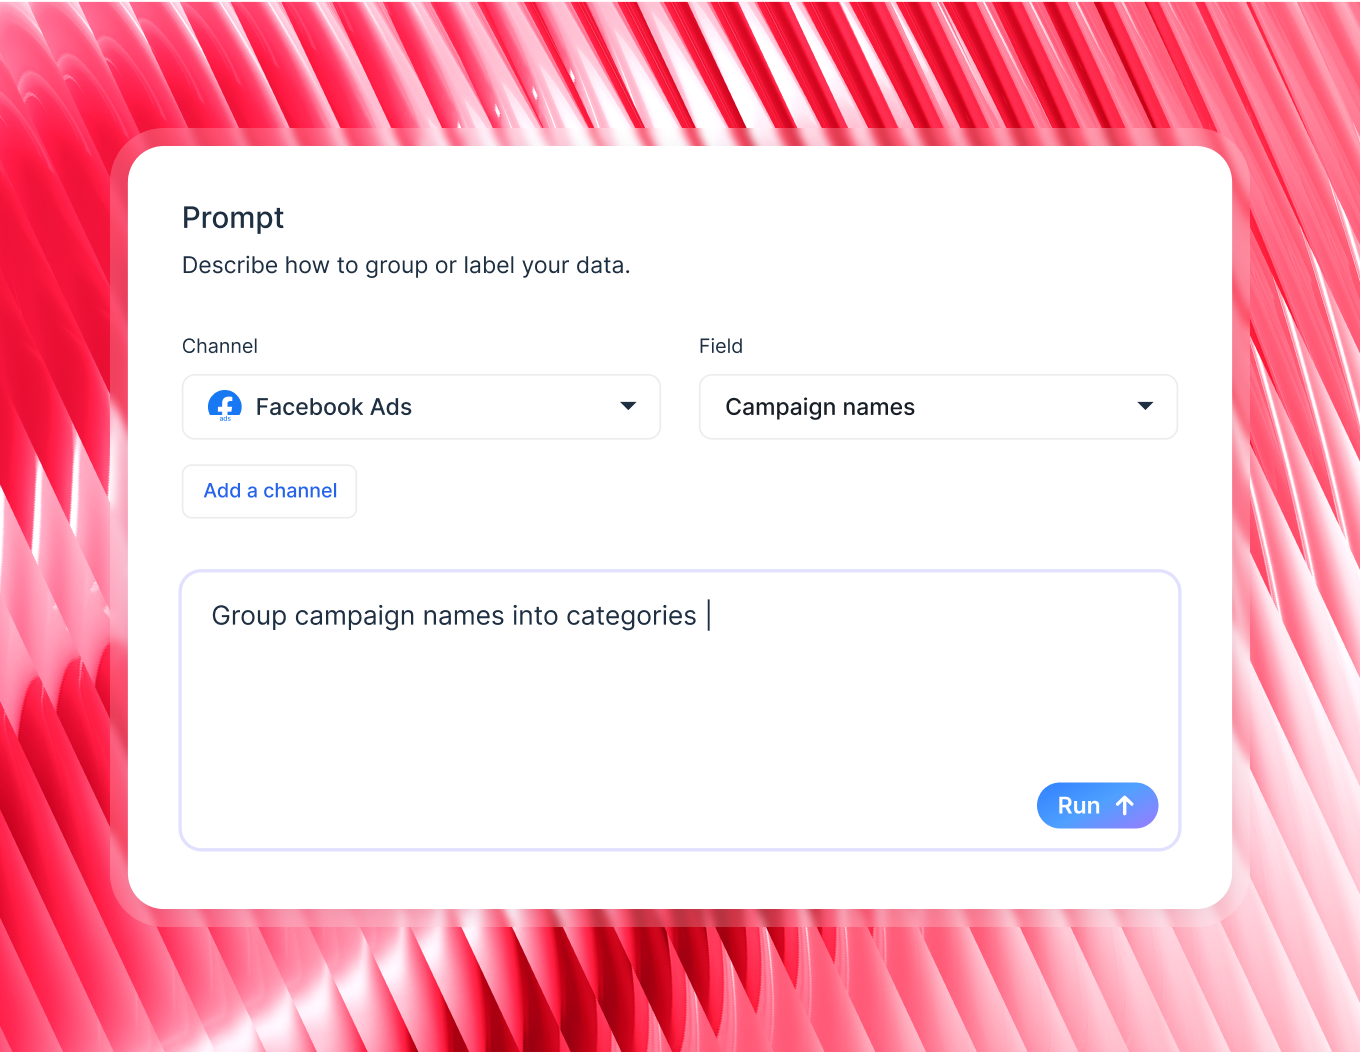
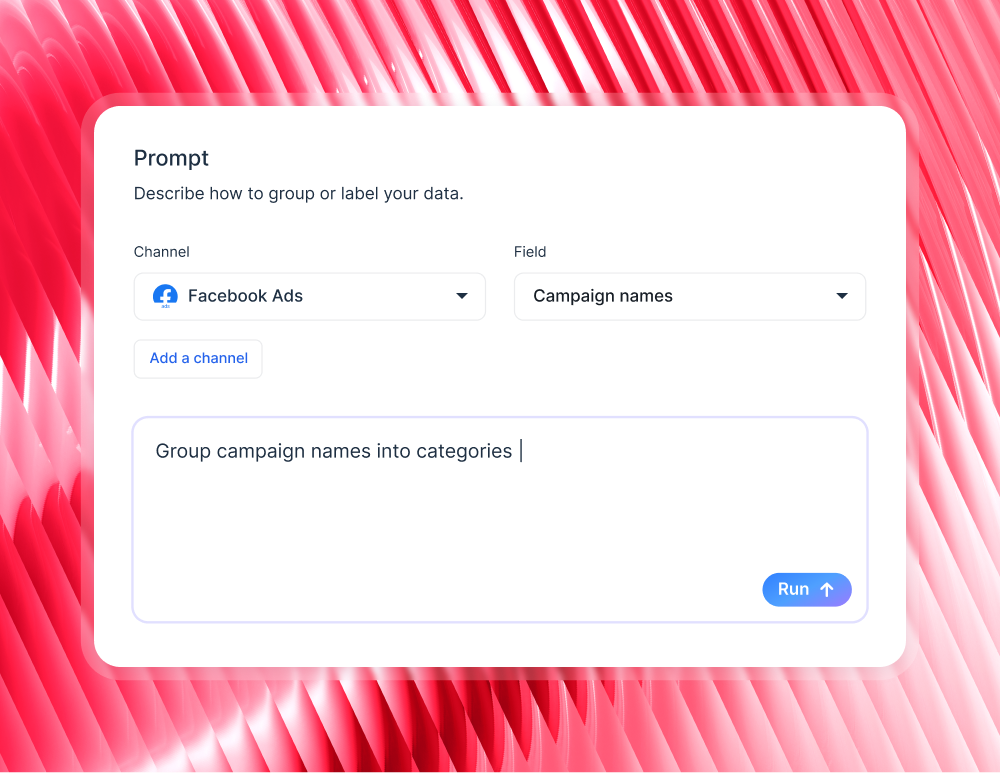
Consistent campaign grouping makes it easy to measure impact across markets. Tag sources to distinguish between global and local campaigns and group data by tags to compare the performance.
Compare results from multiple partners or vendors side by side in overviews. Transparent comparisons make budget allocation easier and more defensible.

Danielle Roberts
Director of Implementation & Support @ Rentable
TEMPLATE
Use the template to summarize performance, prove ROI, and plan smarter strategies for next year

CUSTOMER STORY
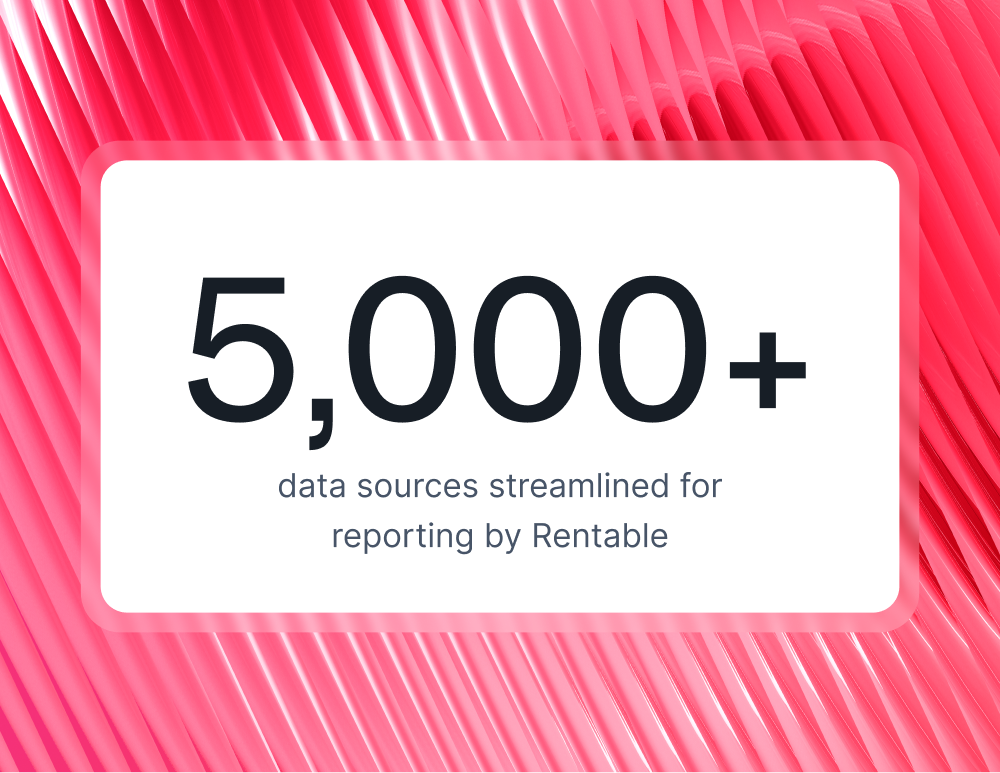
See how Rentable streamlines reporting across 5,000+ data sources on one platform