Data engine behind your marketing intelligence


Turn scattered data into reliable insights
Fragmented
Inconsistent
Slow to work with
Built for marketers.
Powered like a data warehouse.
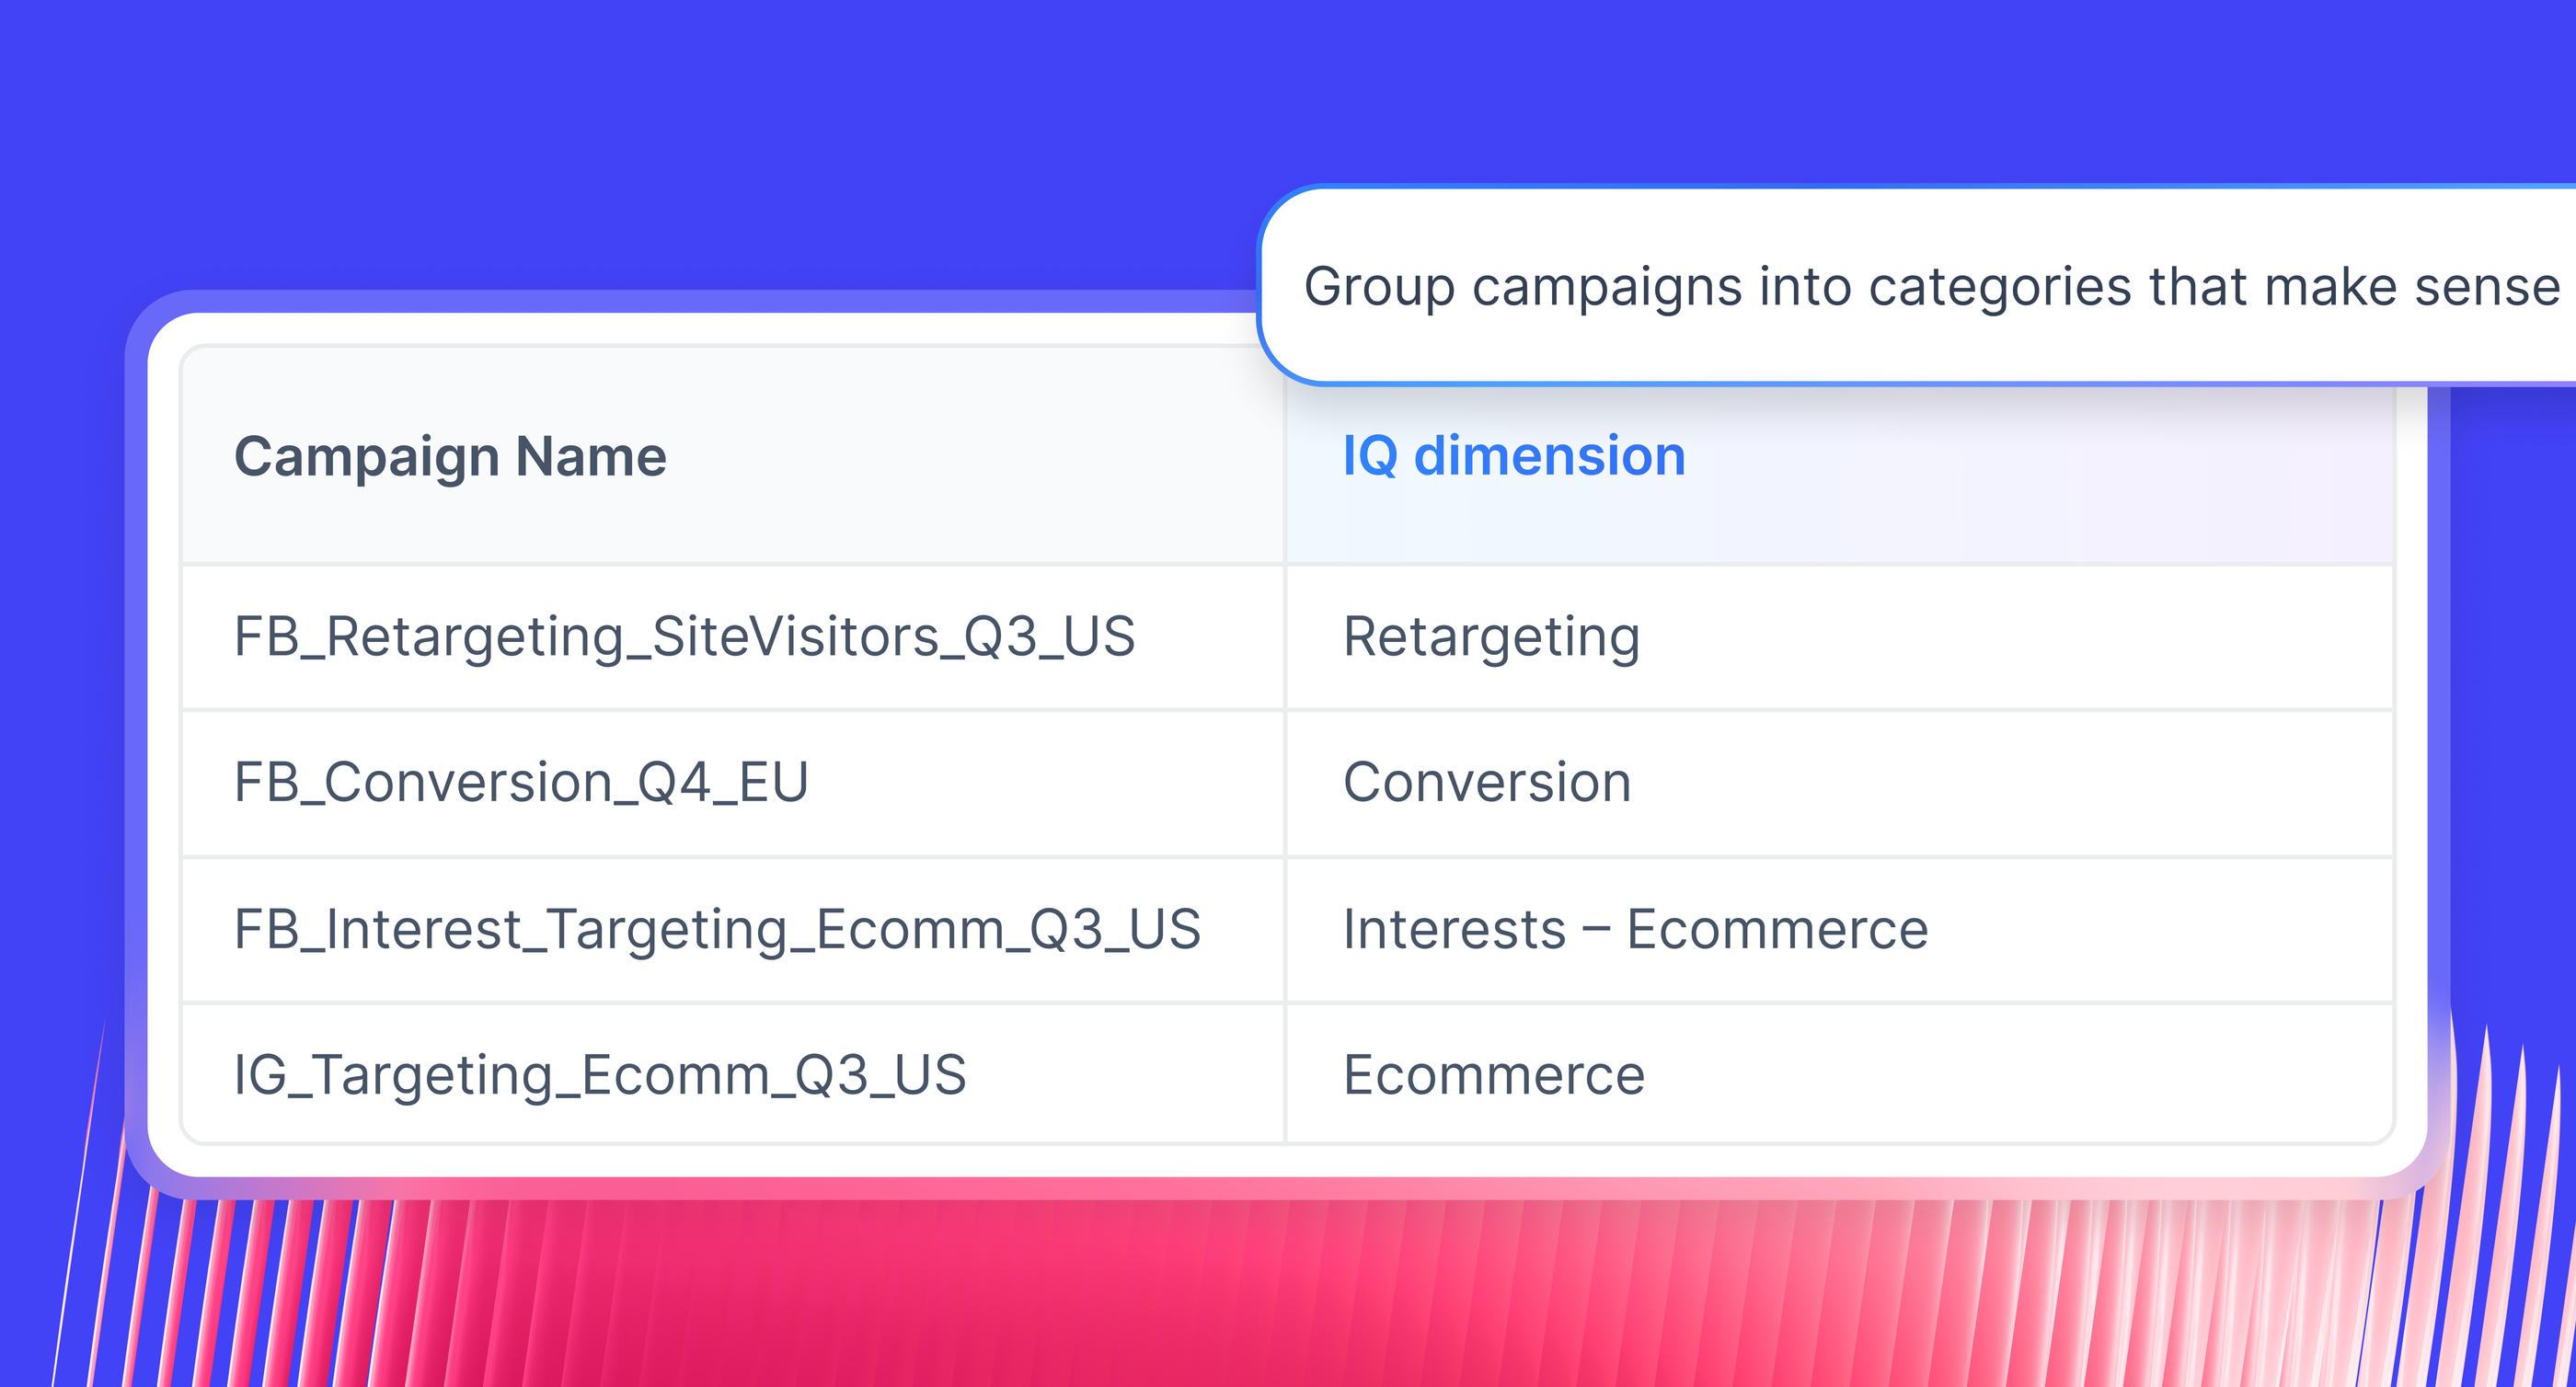
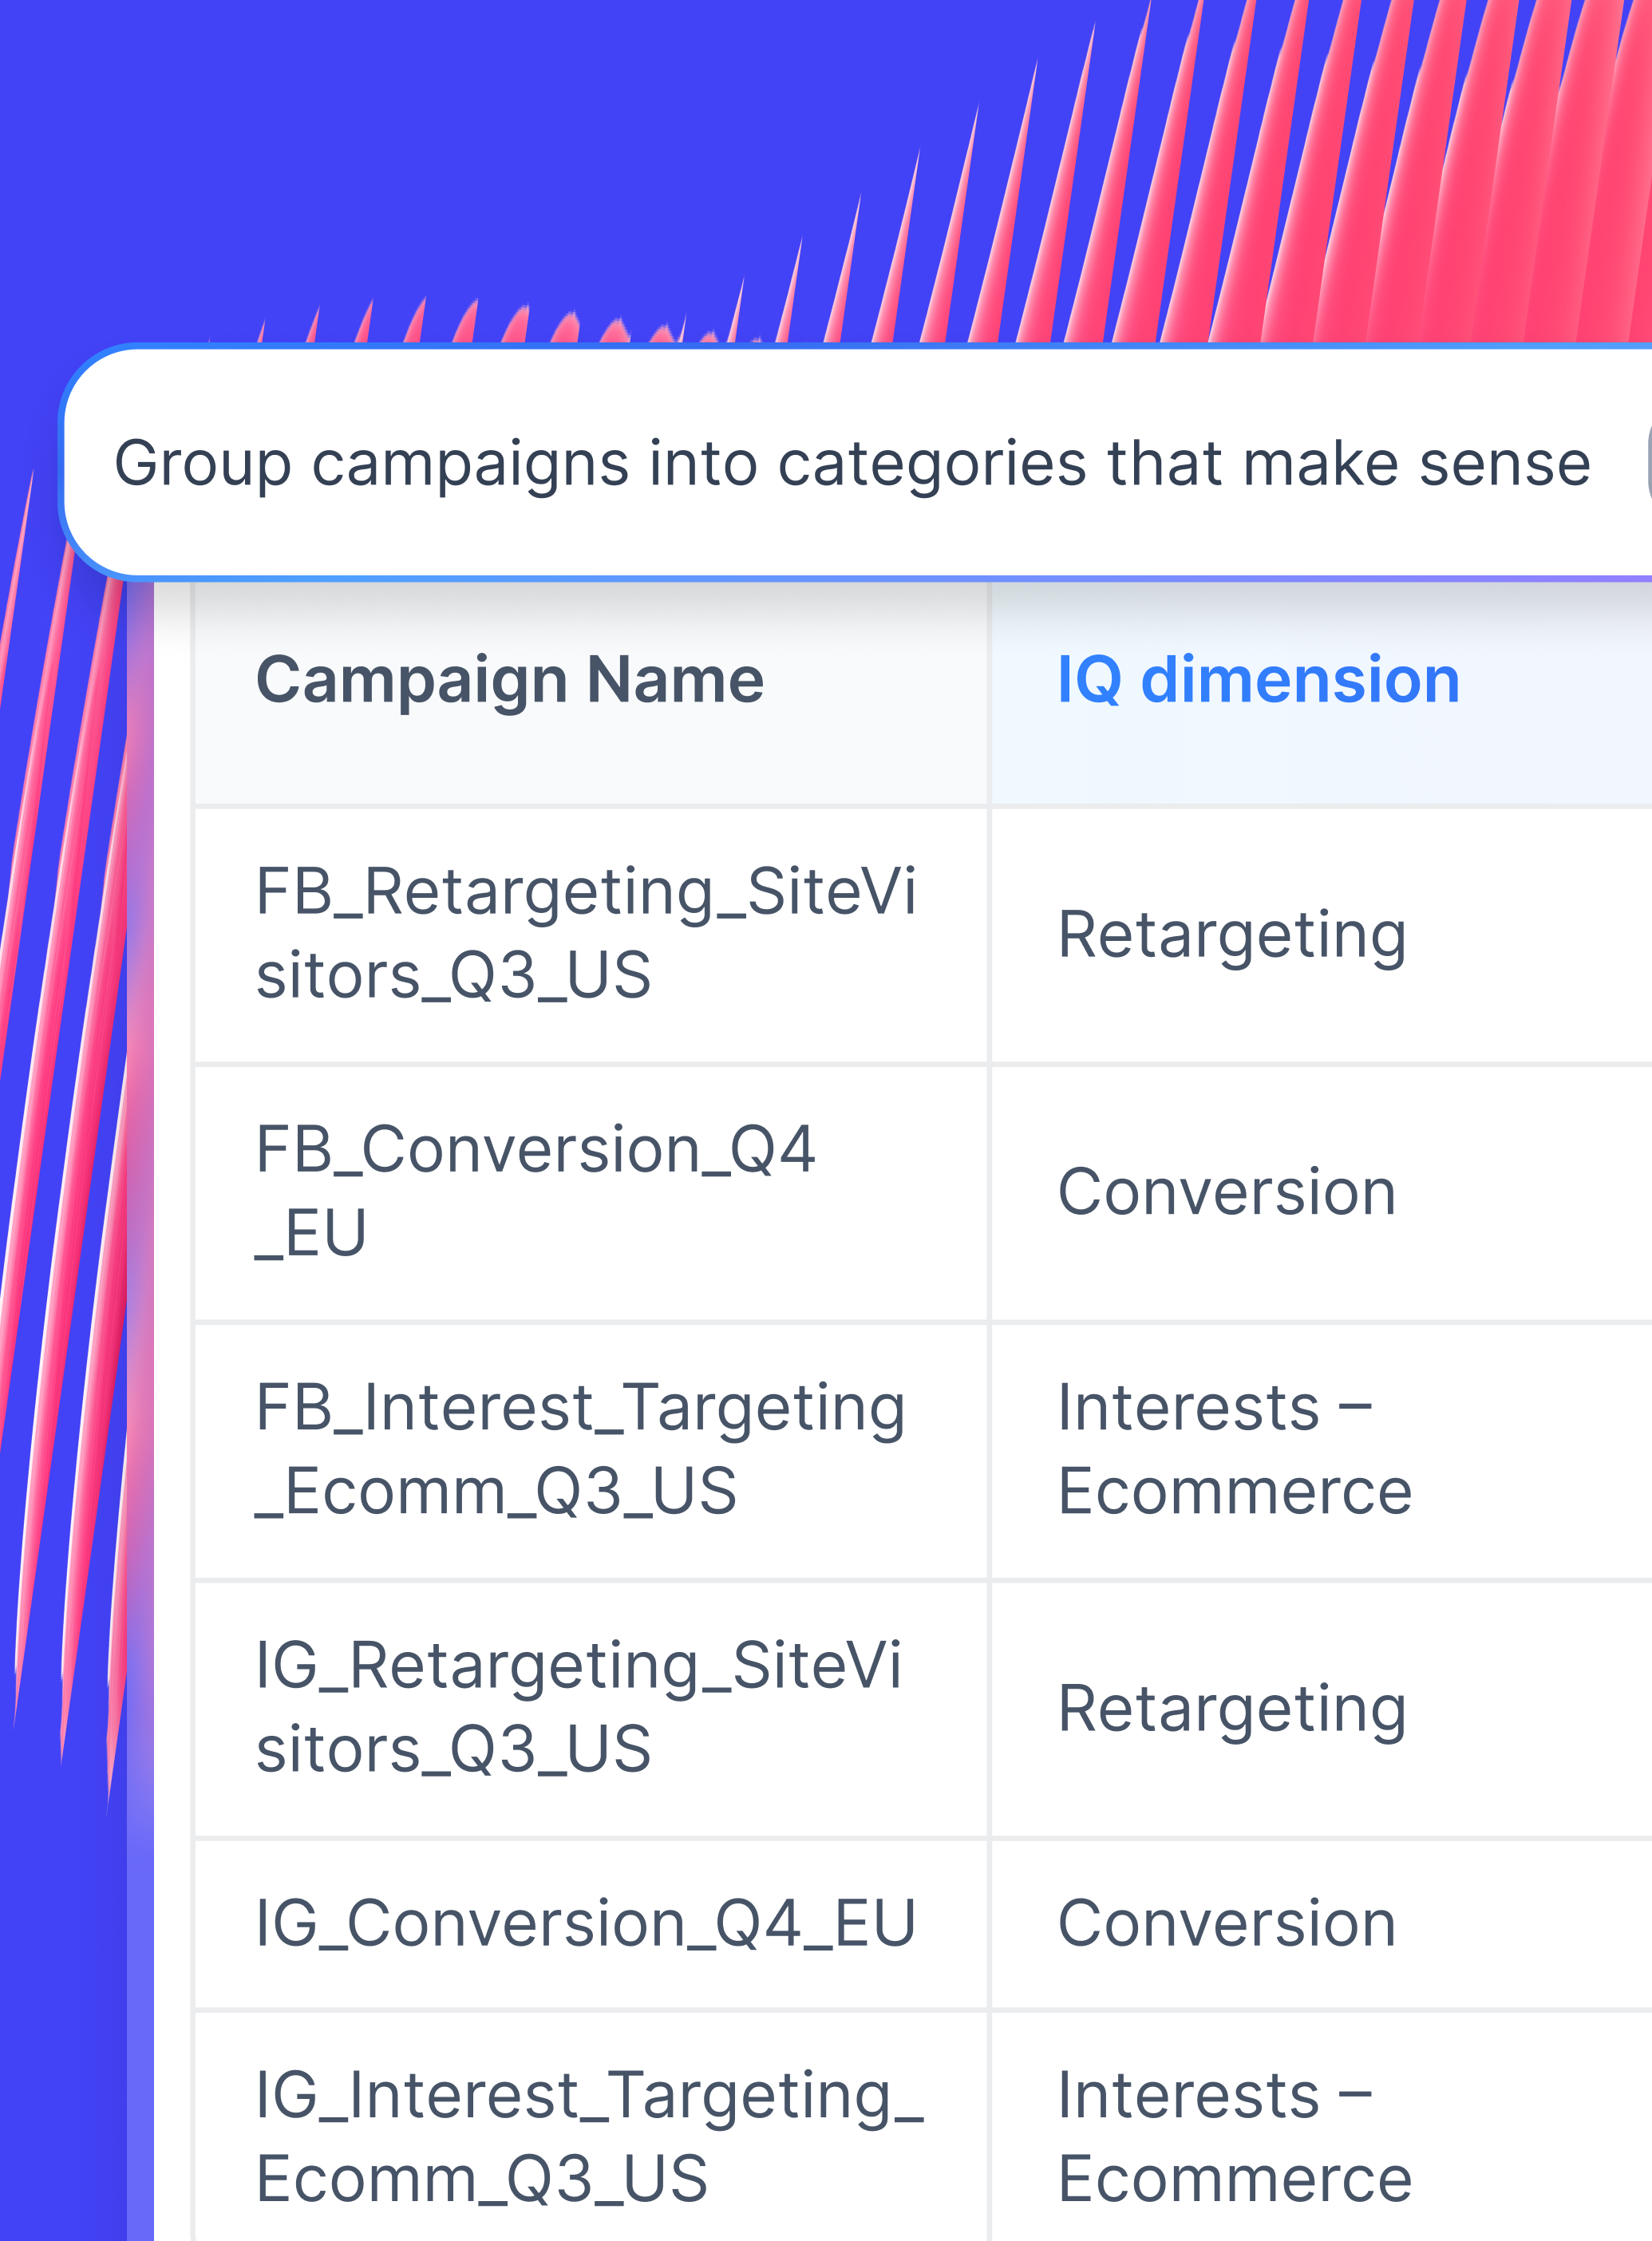
Clean & unify your data
Describe rules in plain language and let AI generate IQ dimensions for you. Or define categories using naming patterns, regex, and conditional logic.
Build the metrics that matter
The output is defined by you and formatted automatically (integer, percentage, or currency), so it works correctly in every chart and table.
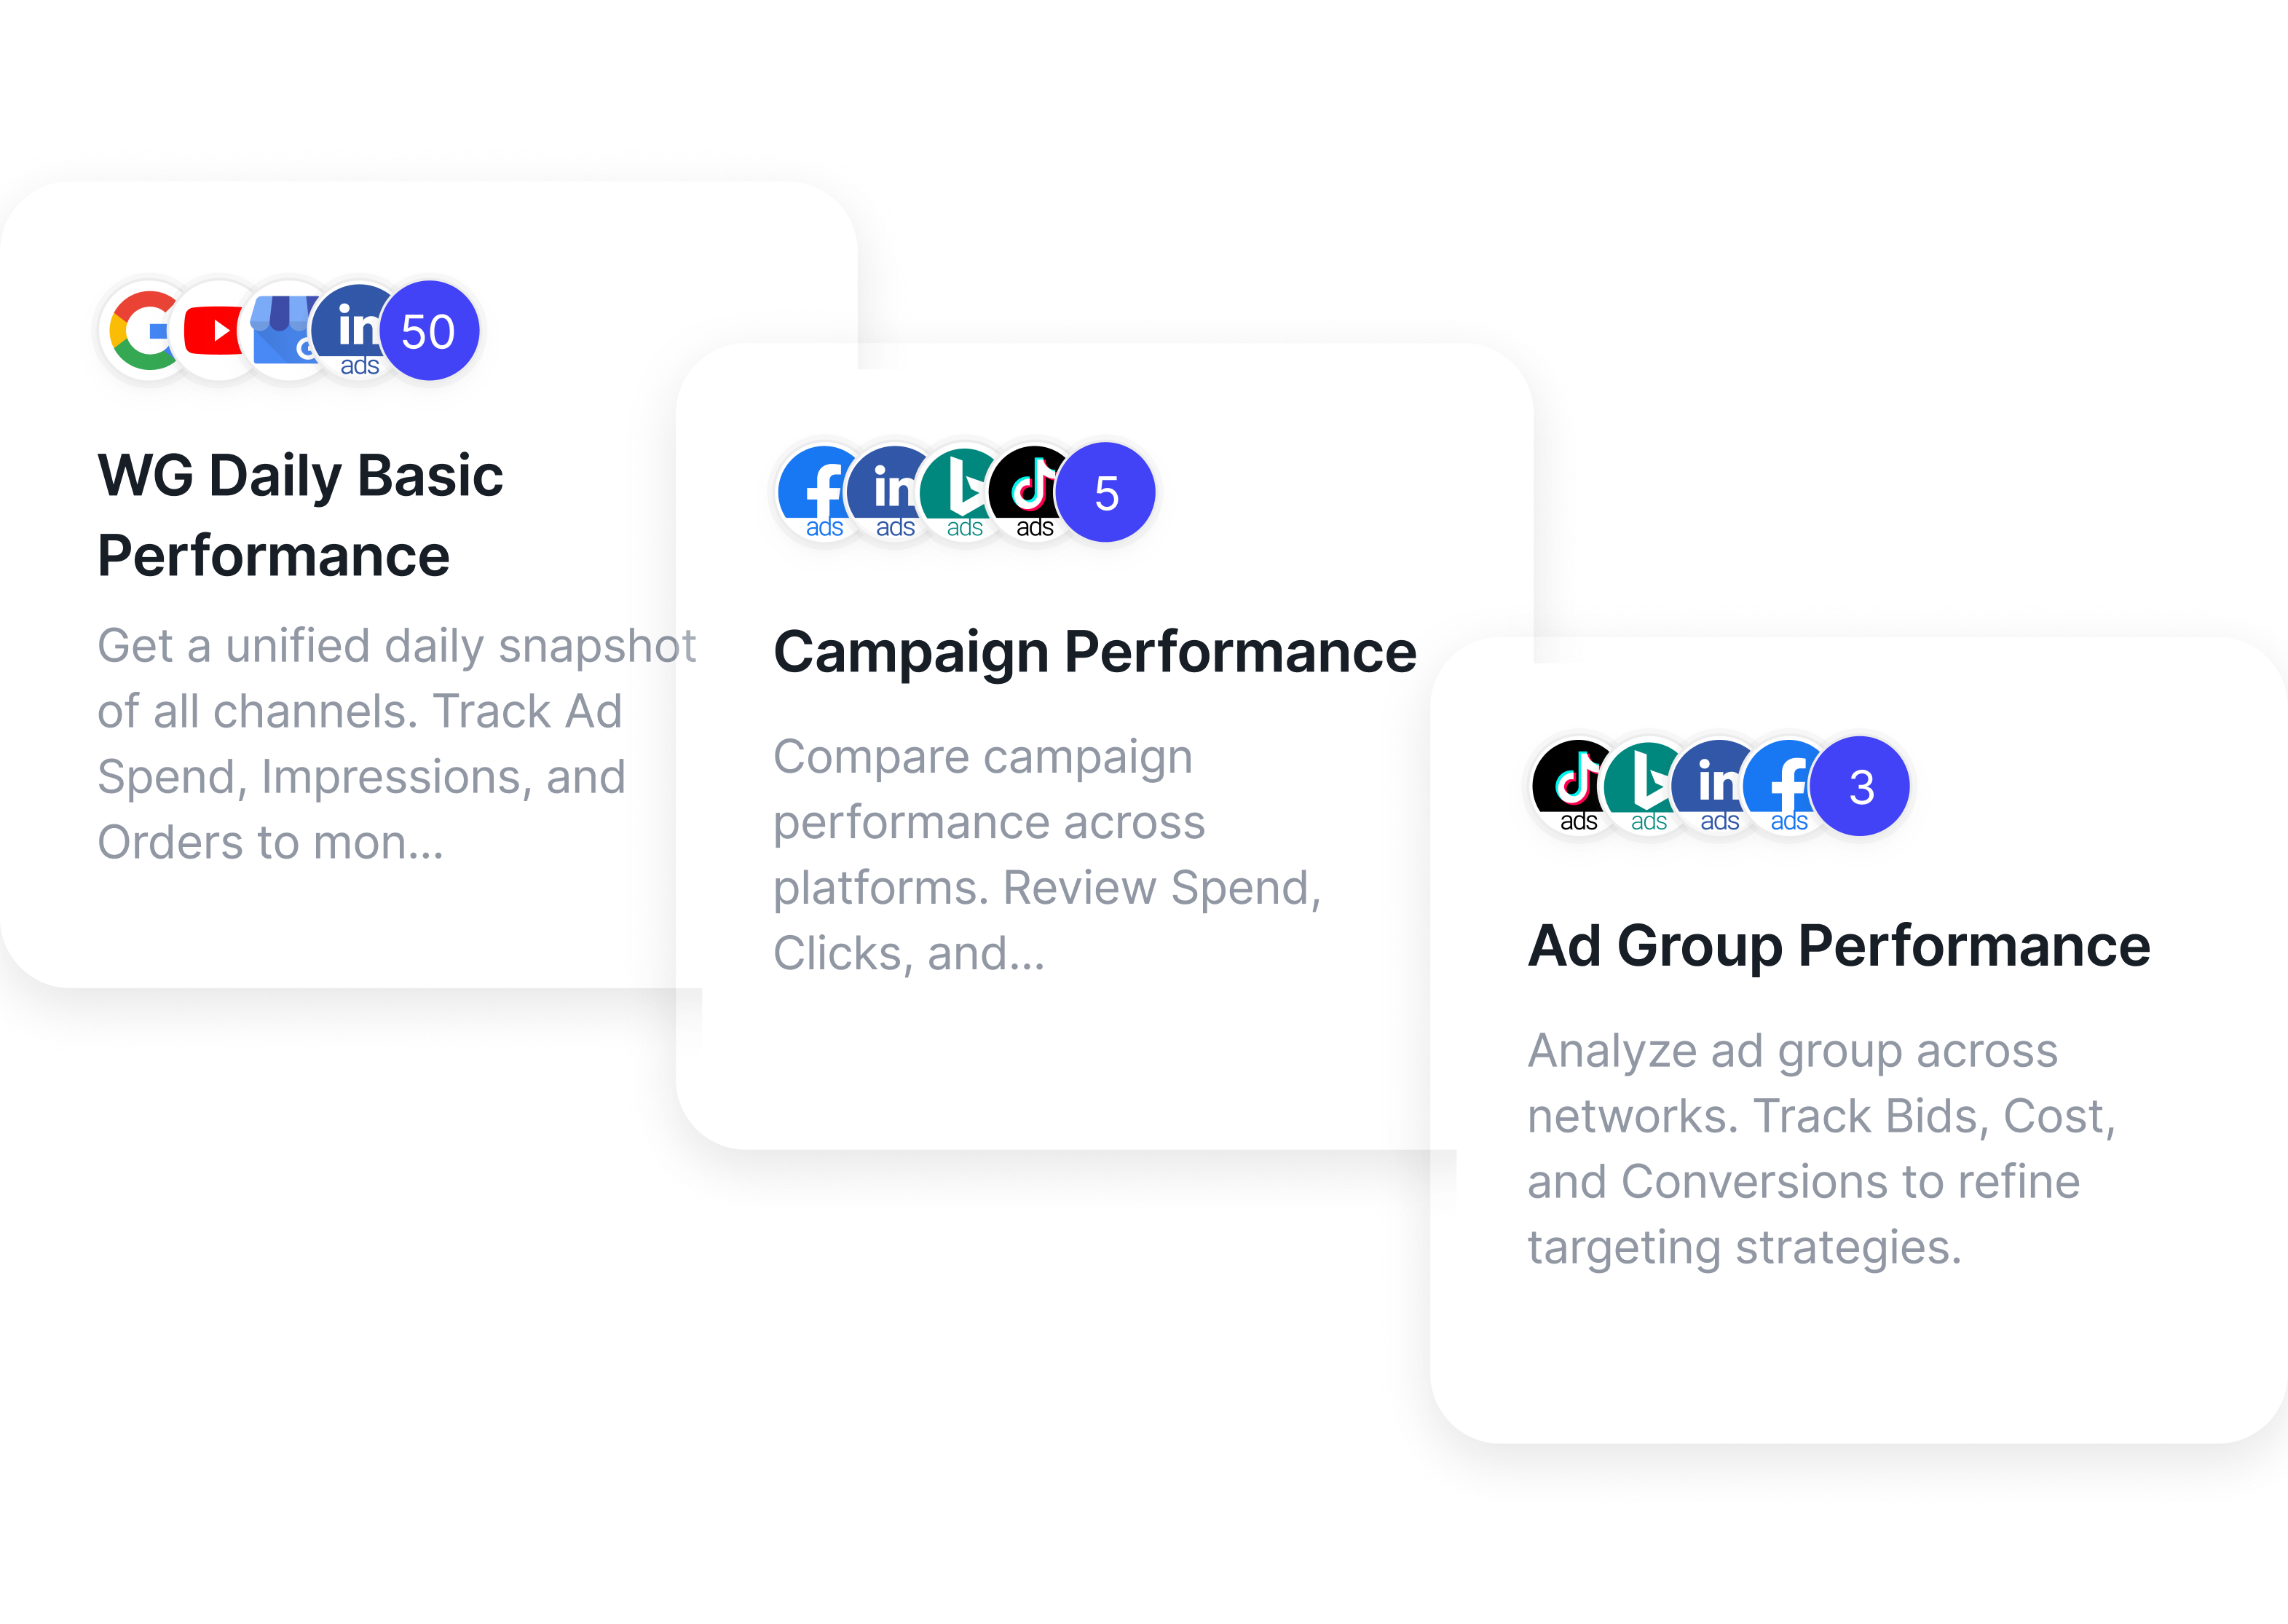
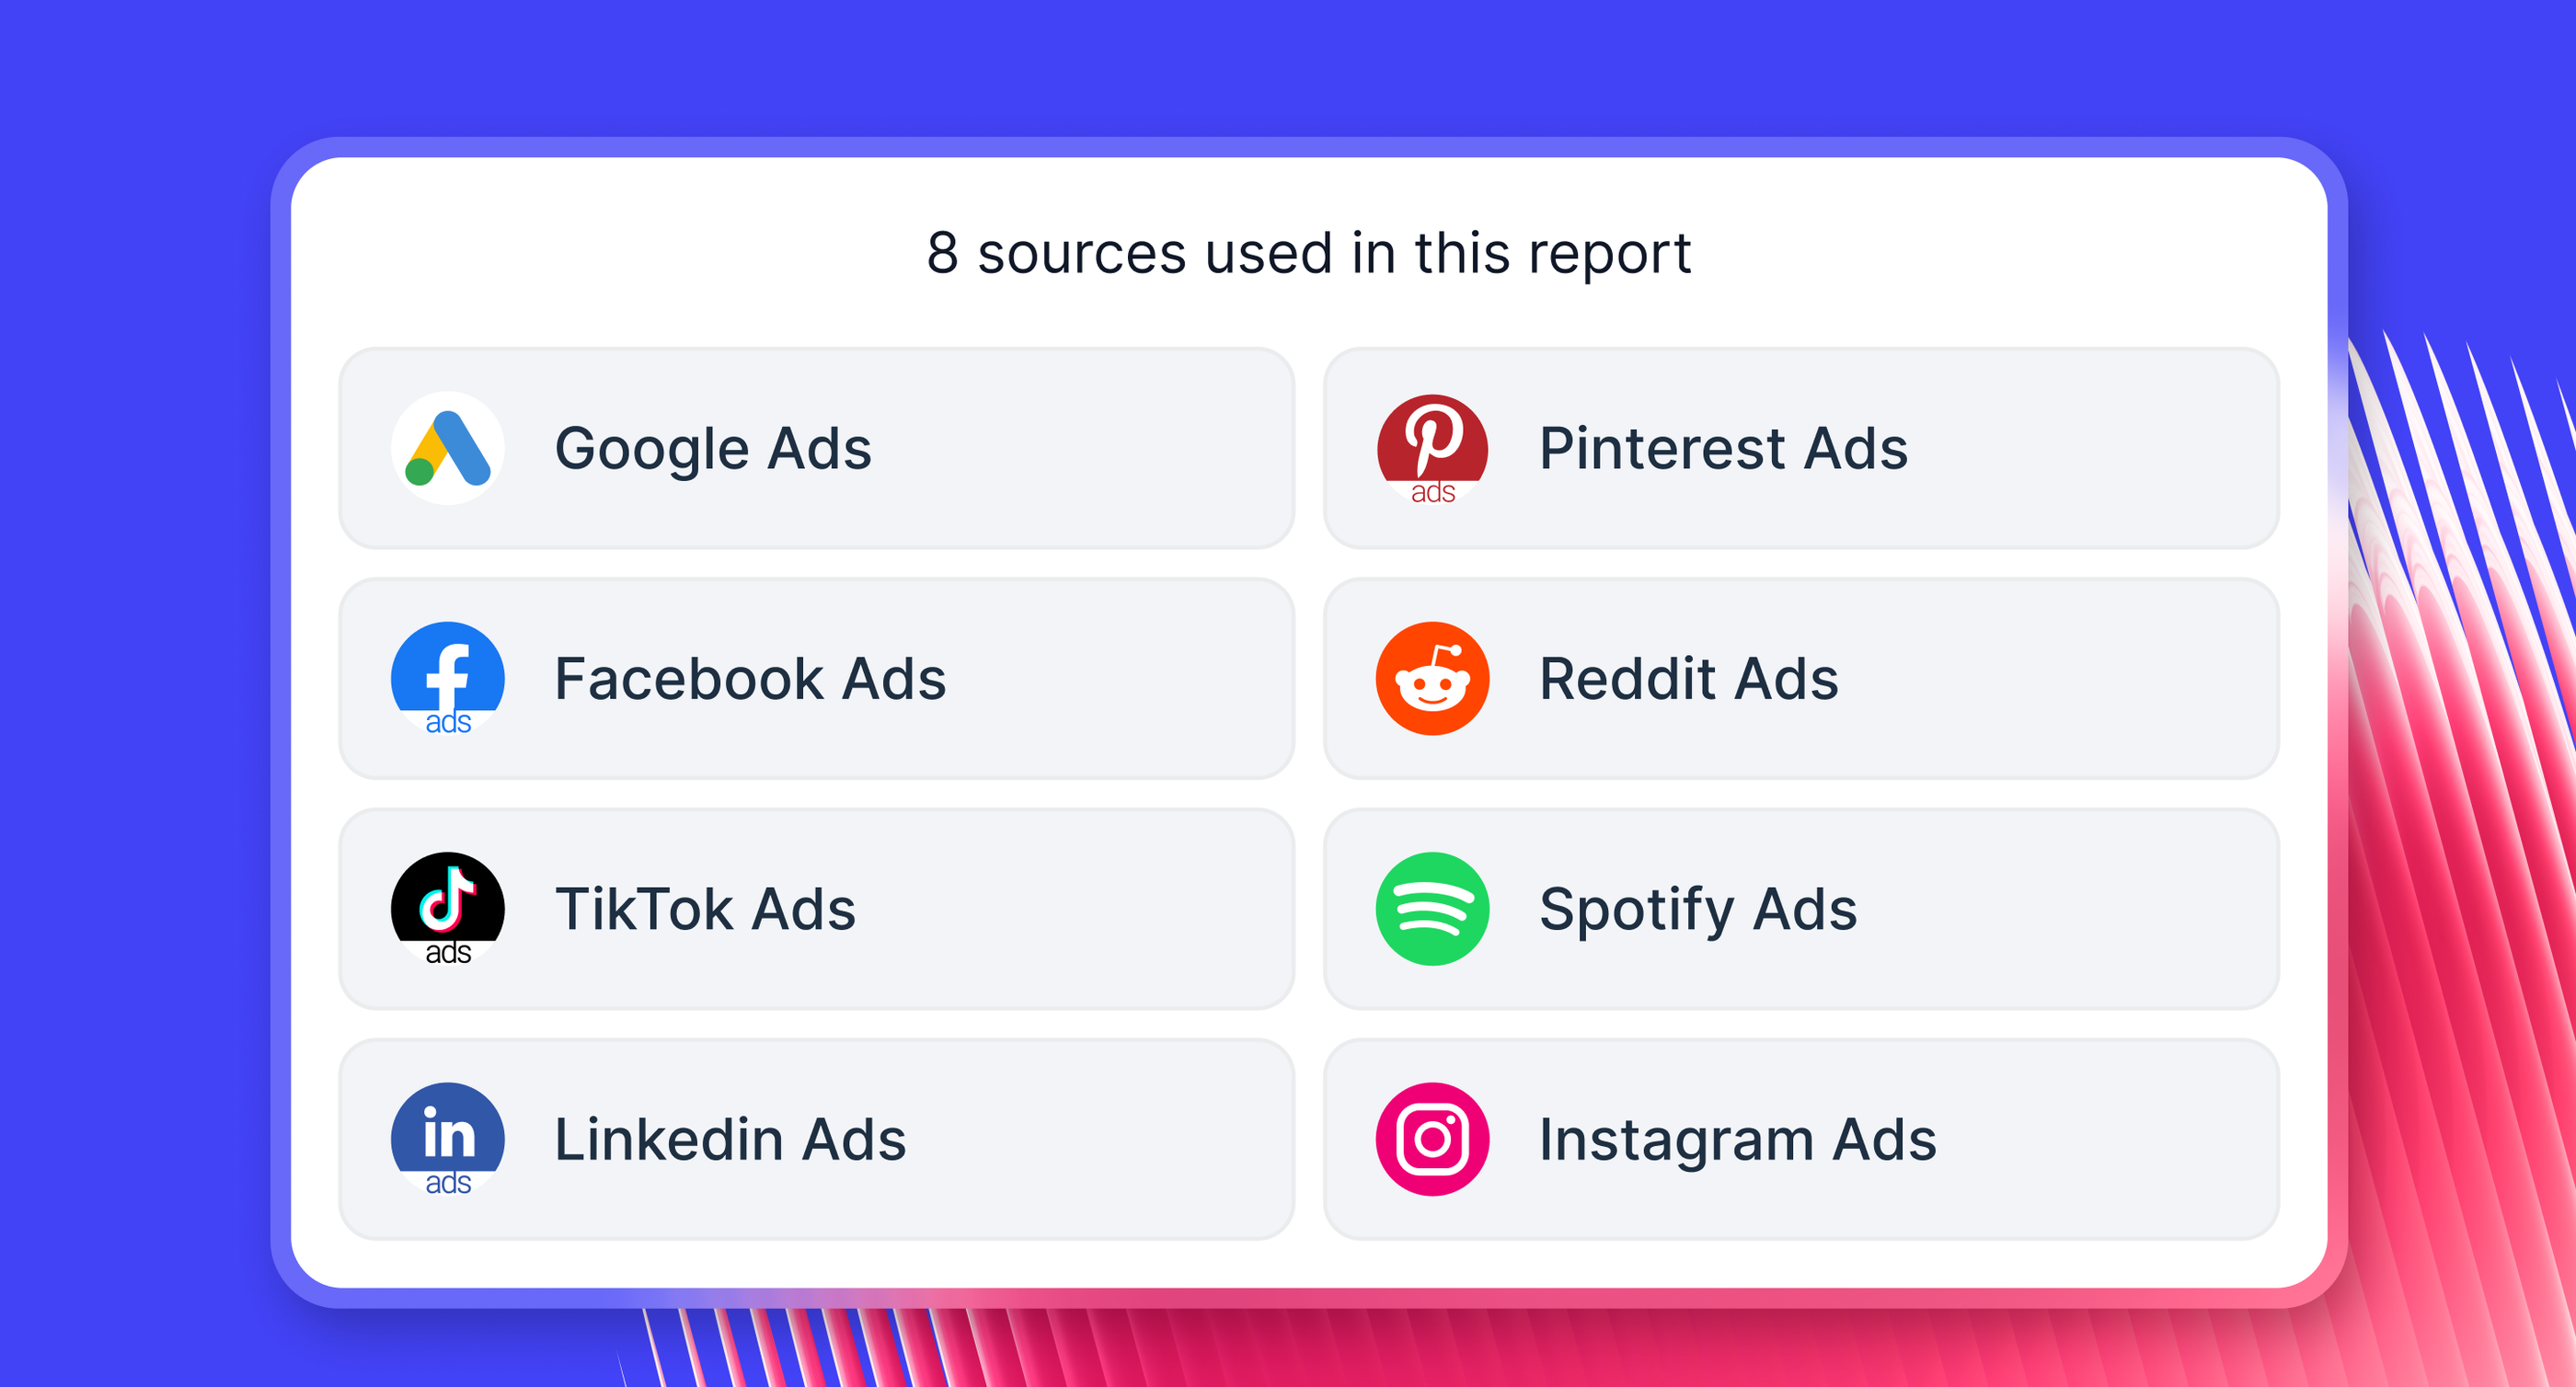
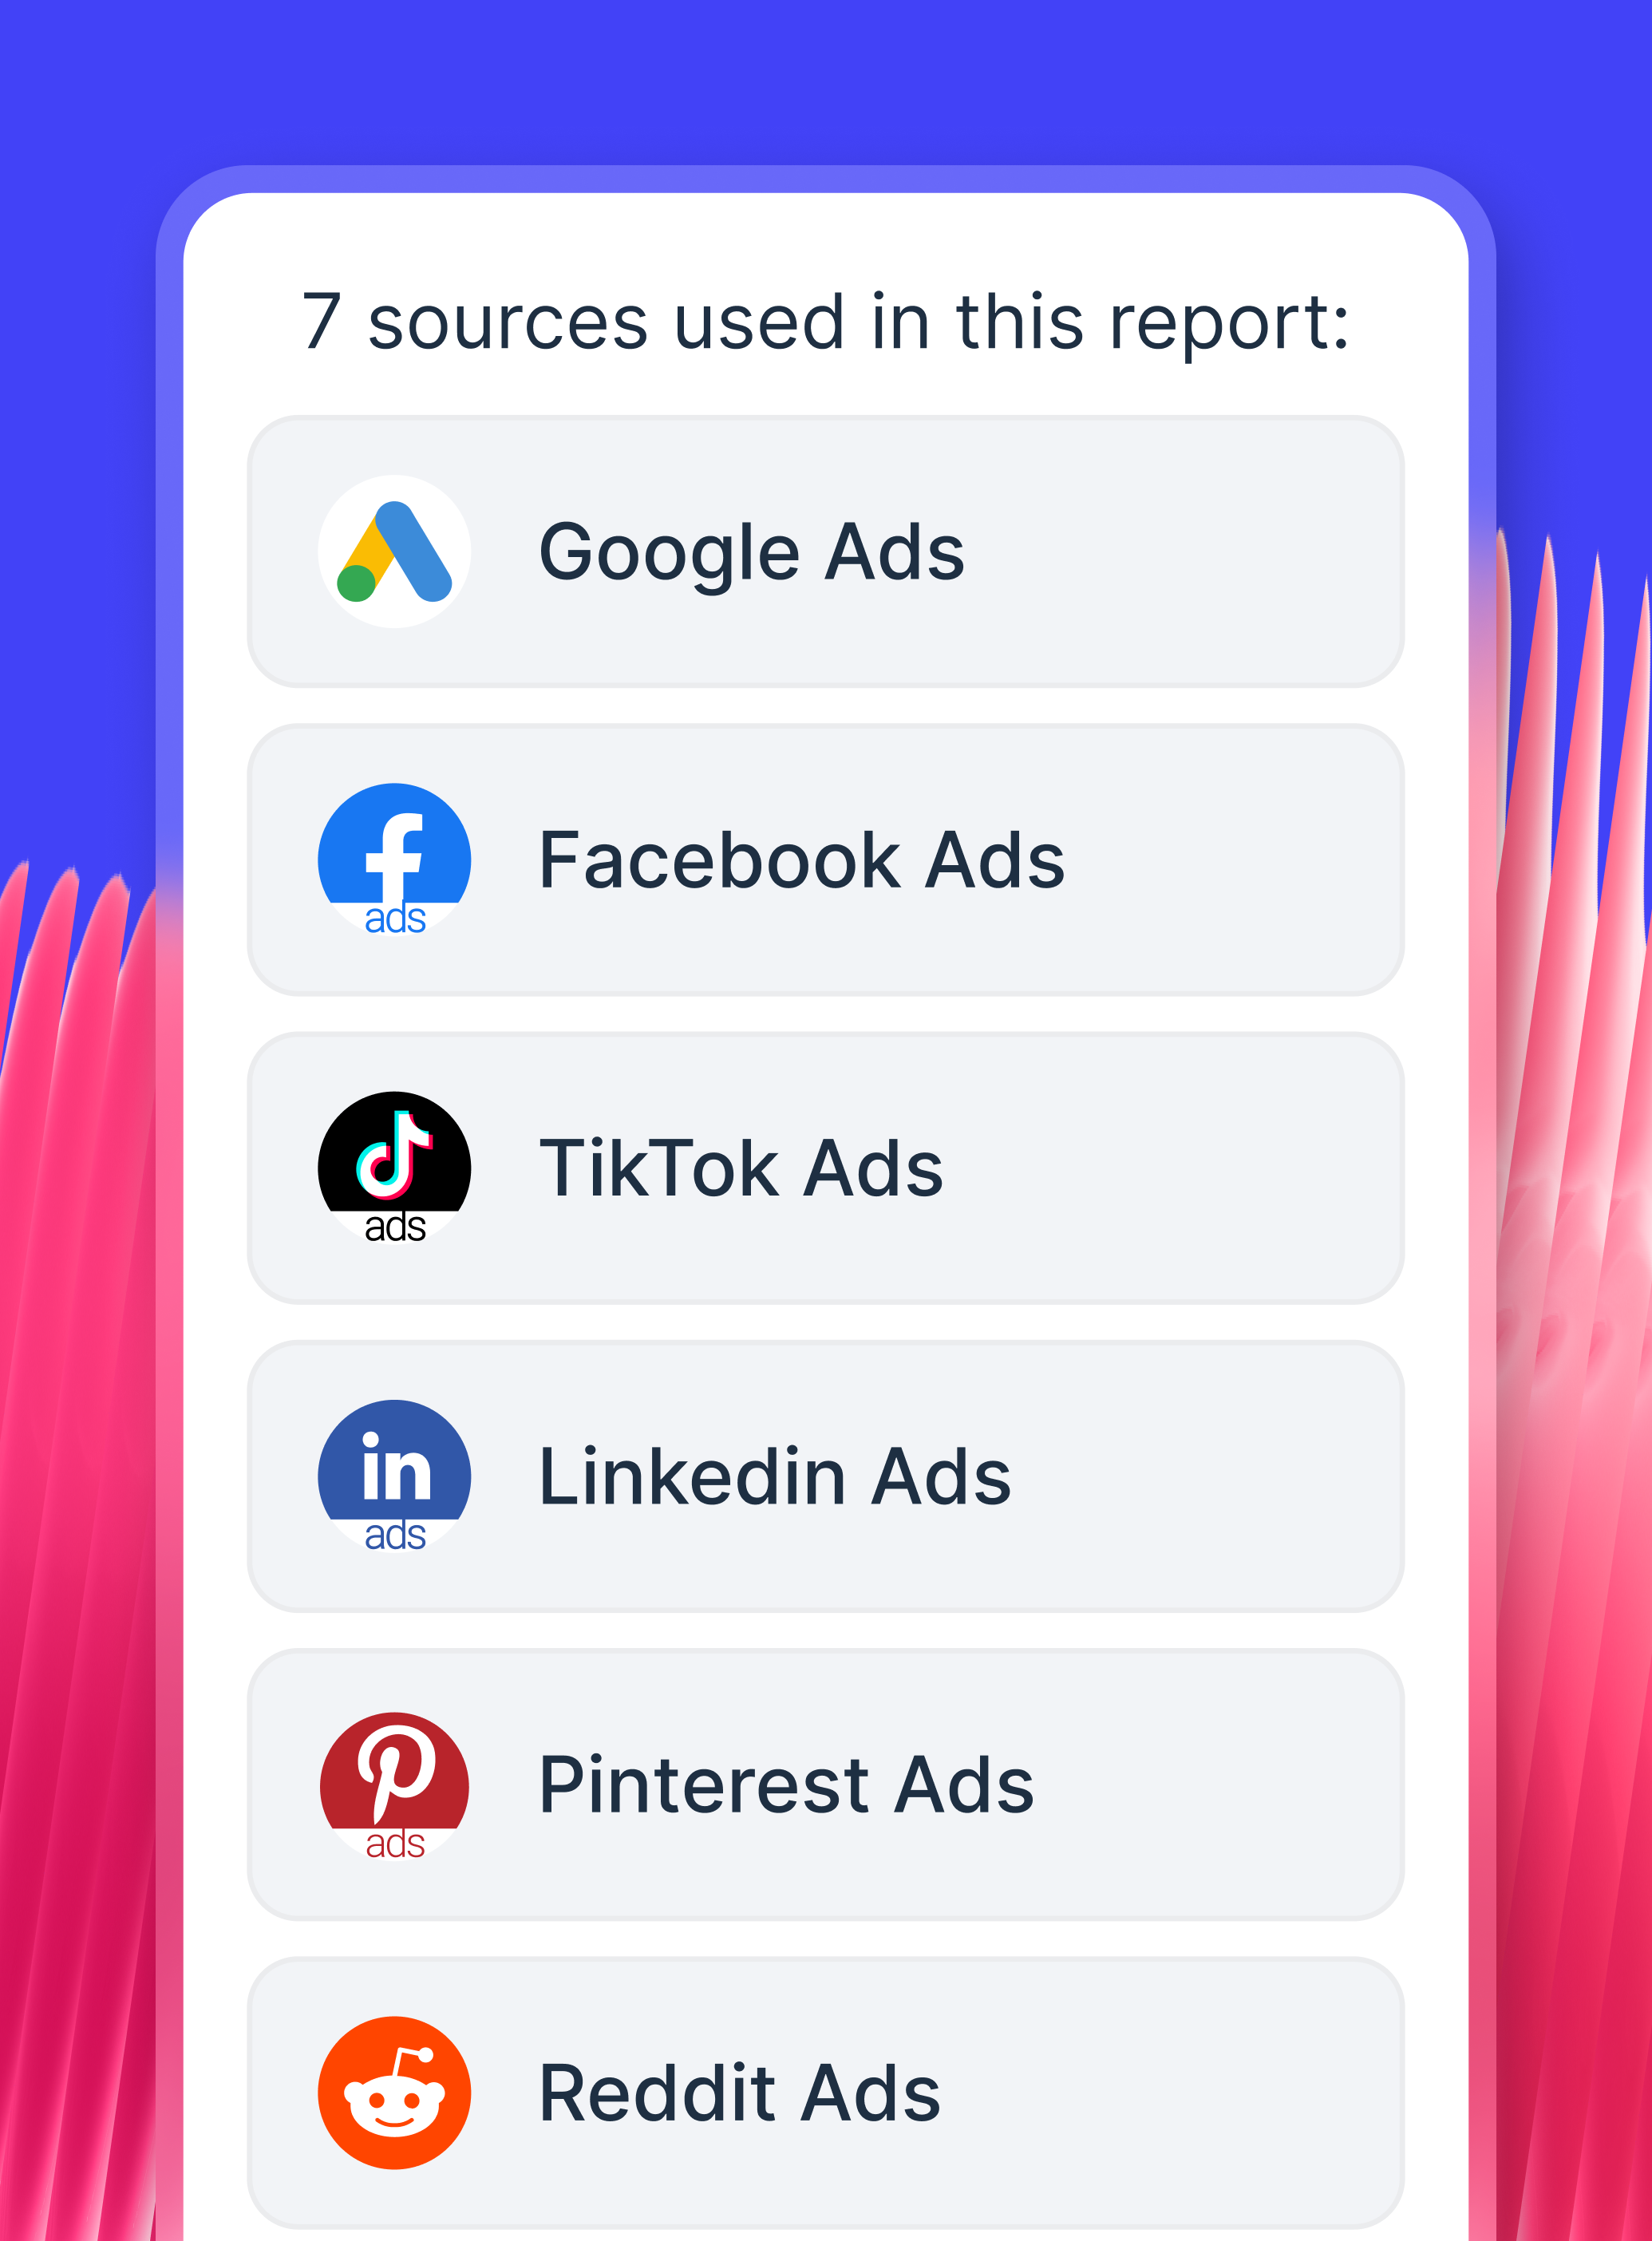
Aggregate data at scale
Perfect for teams managing multiple entities, multi-region accounts, complex campaign structures.
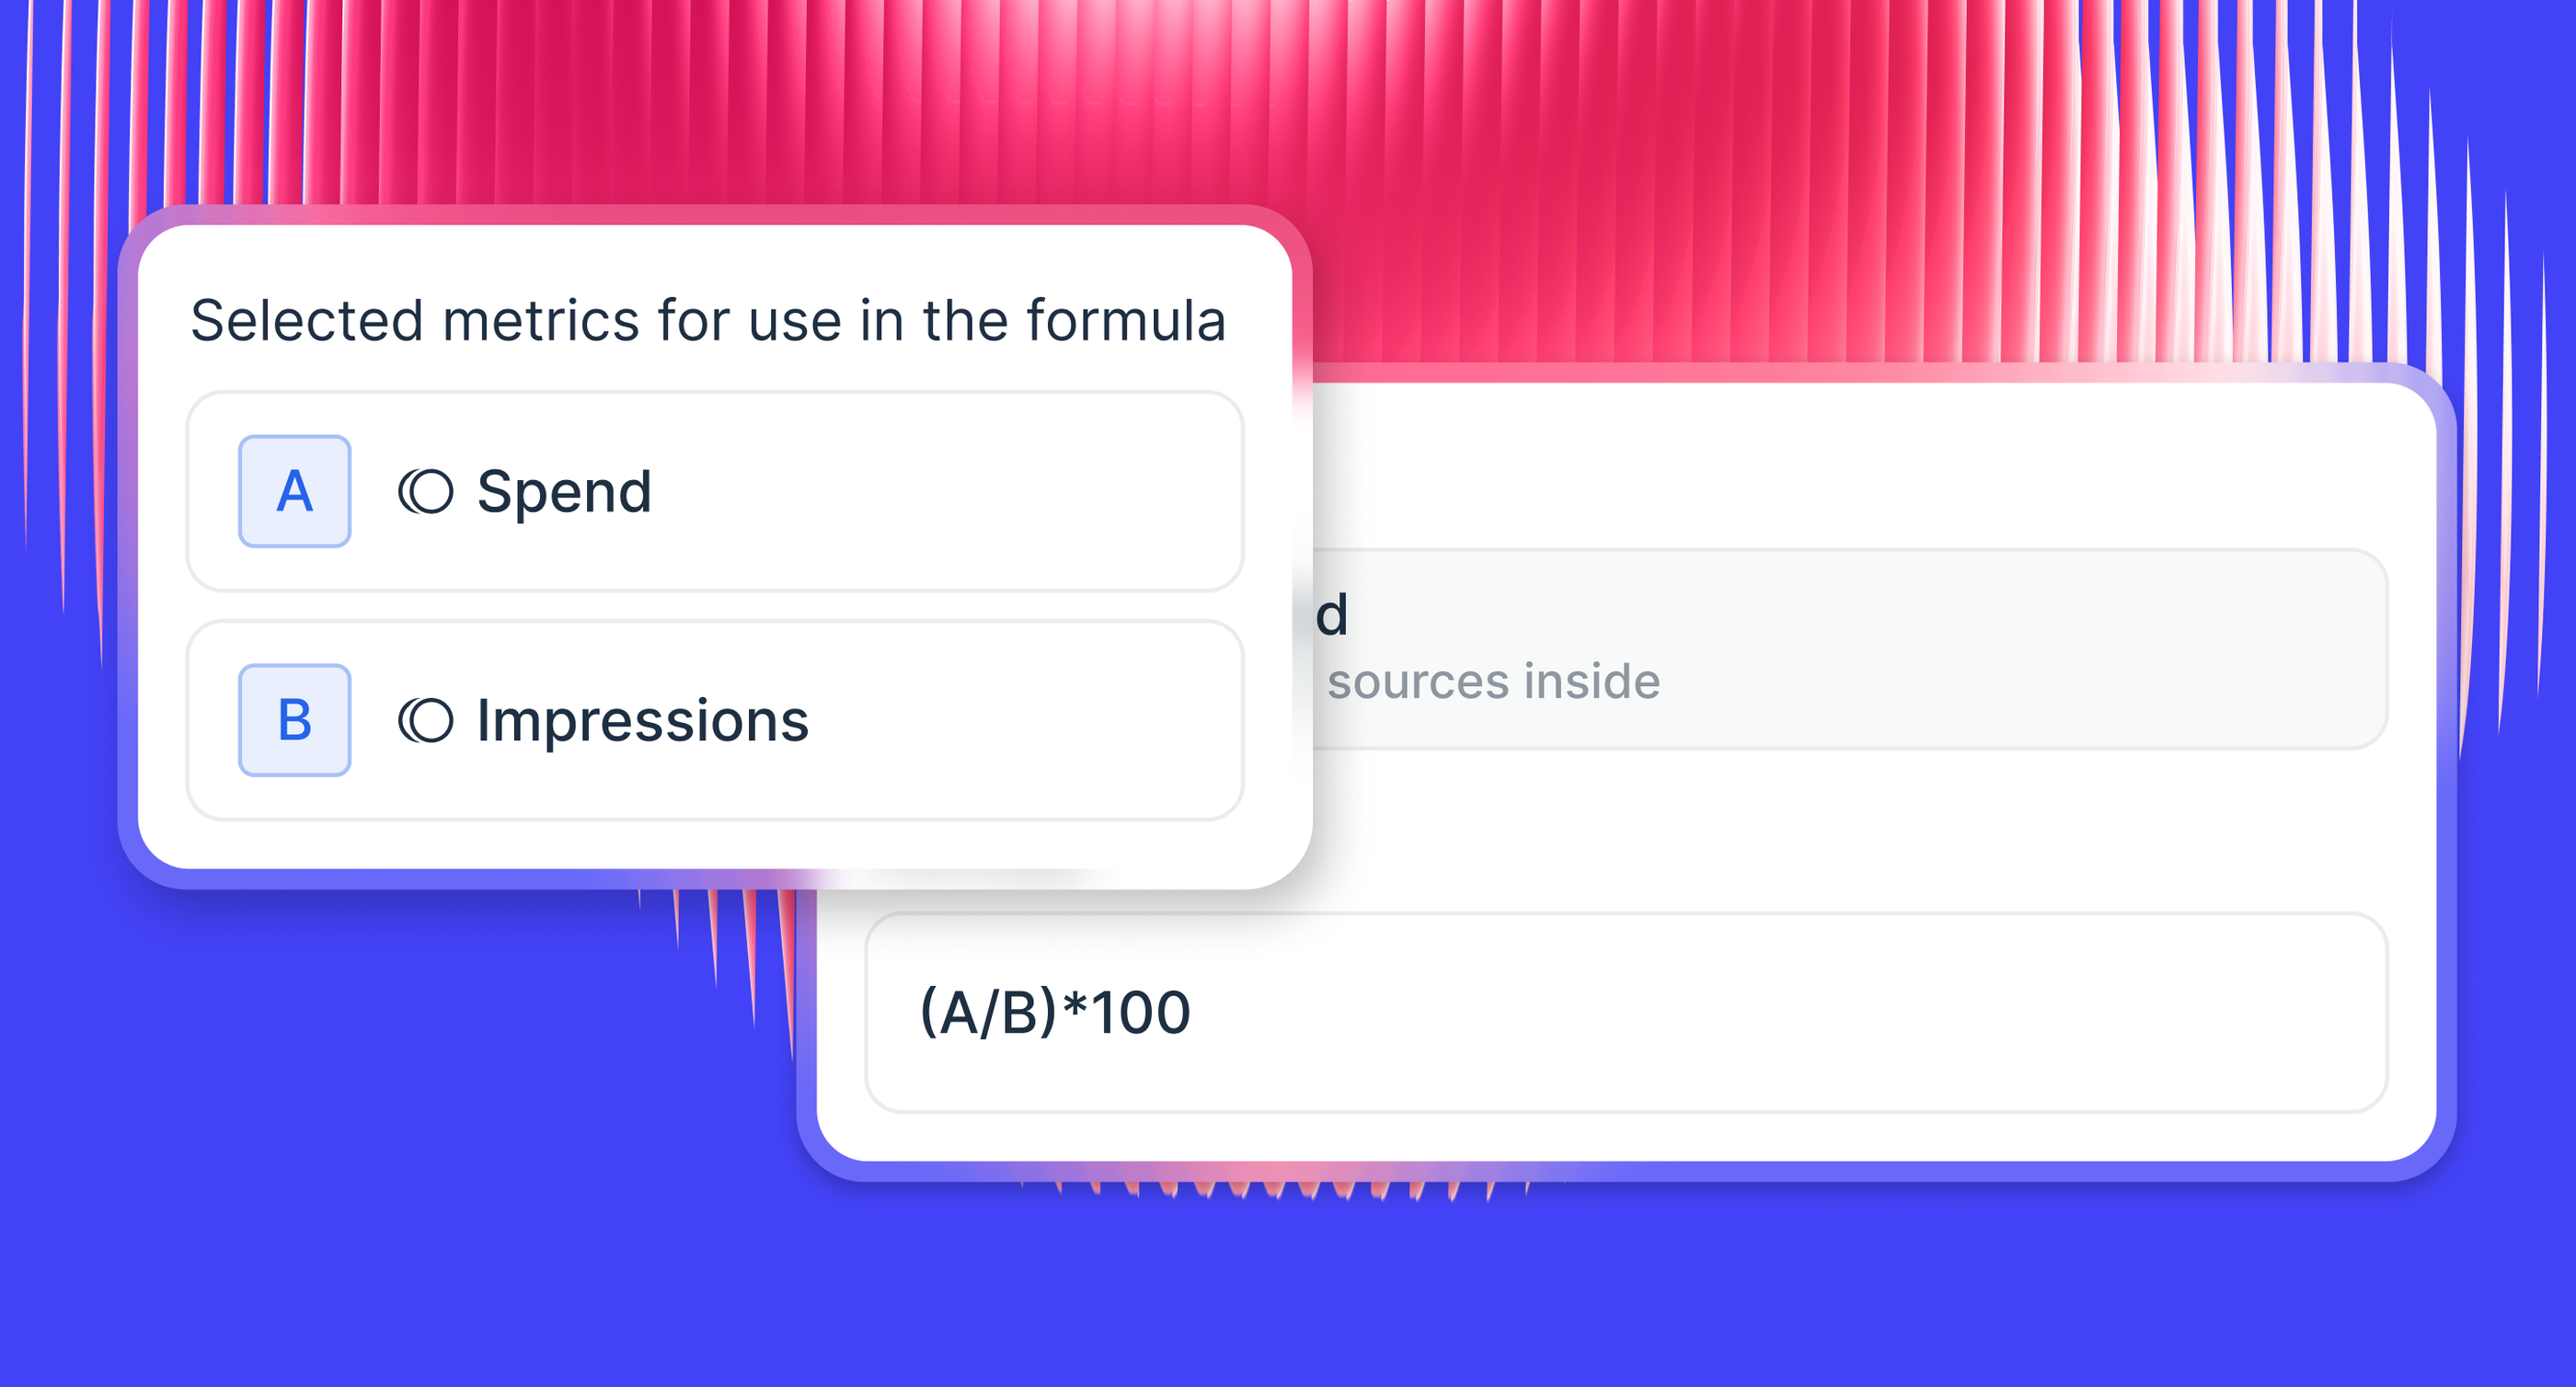
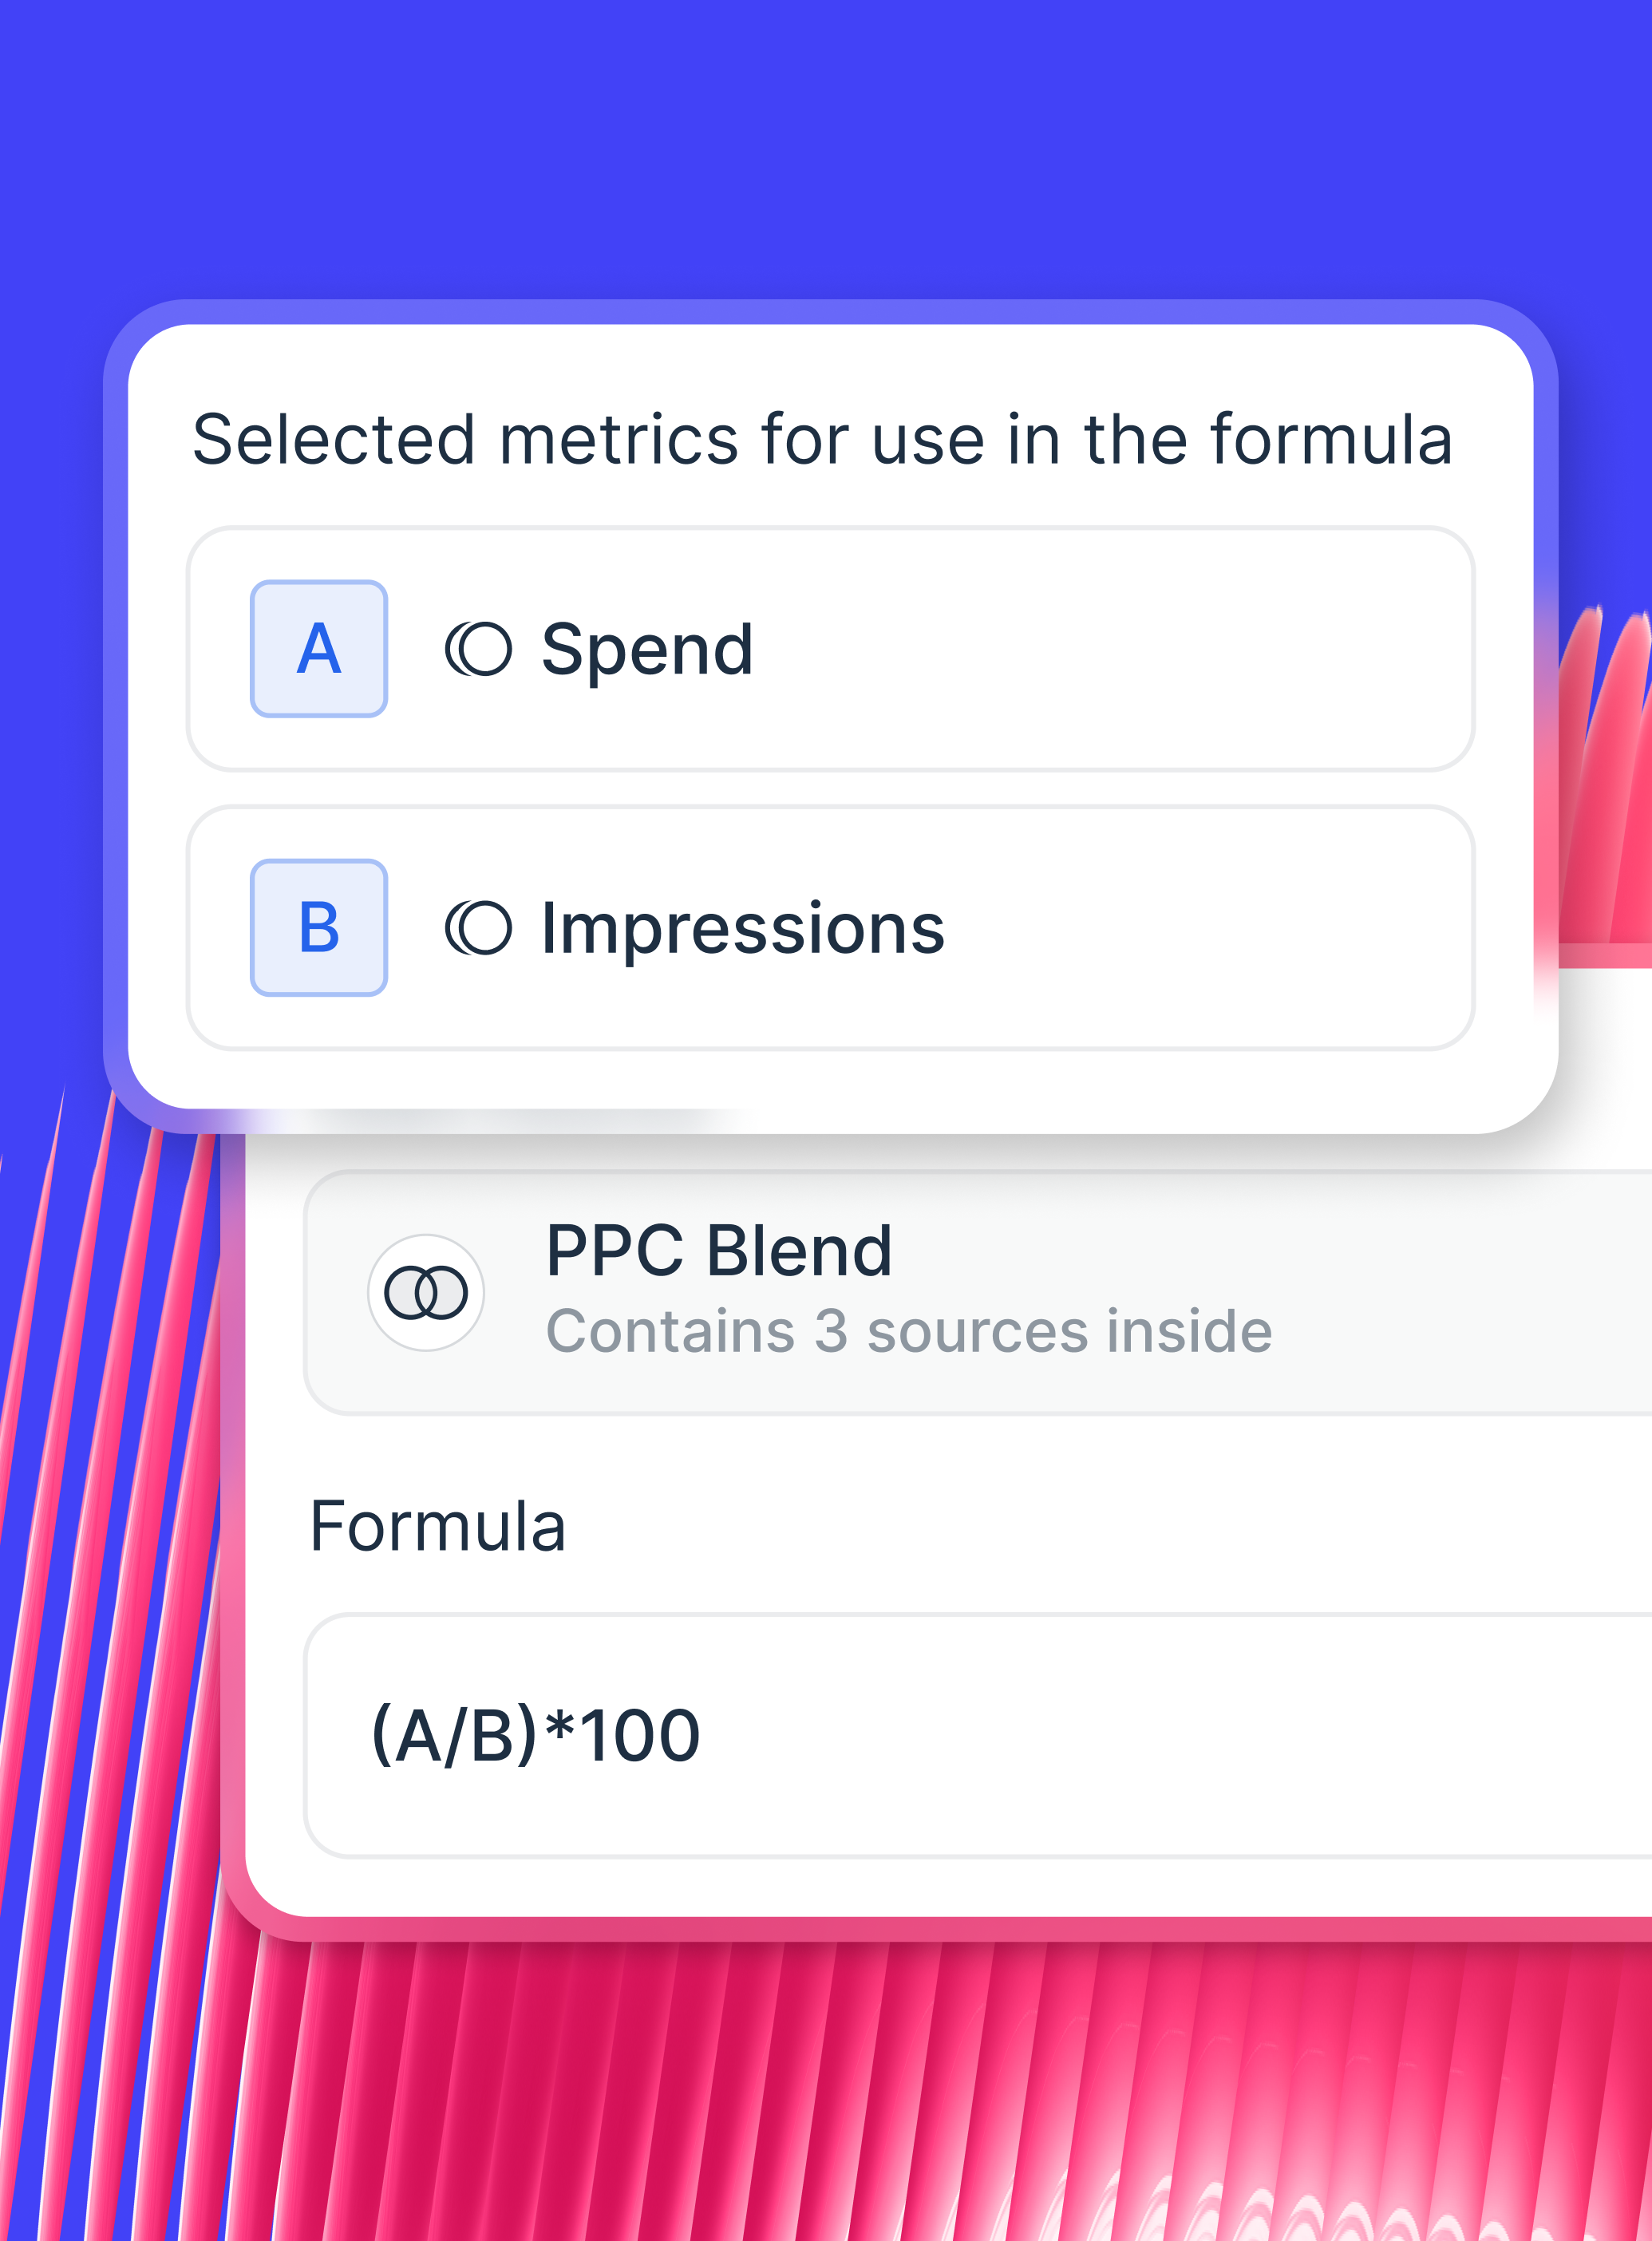
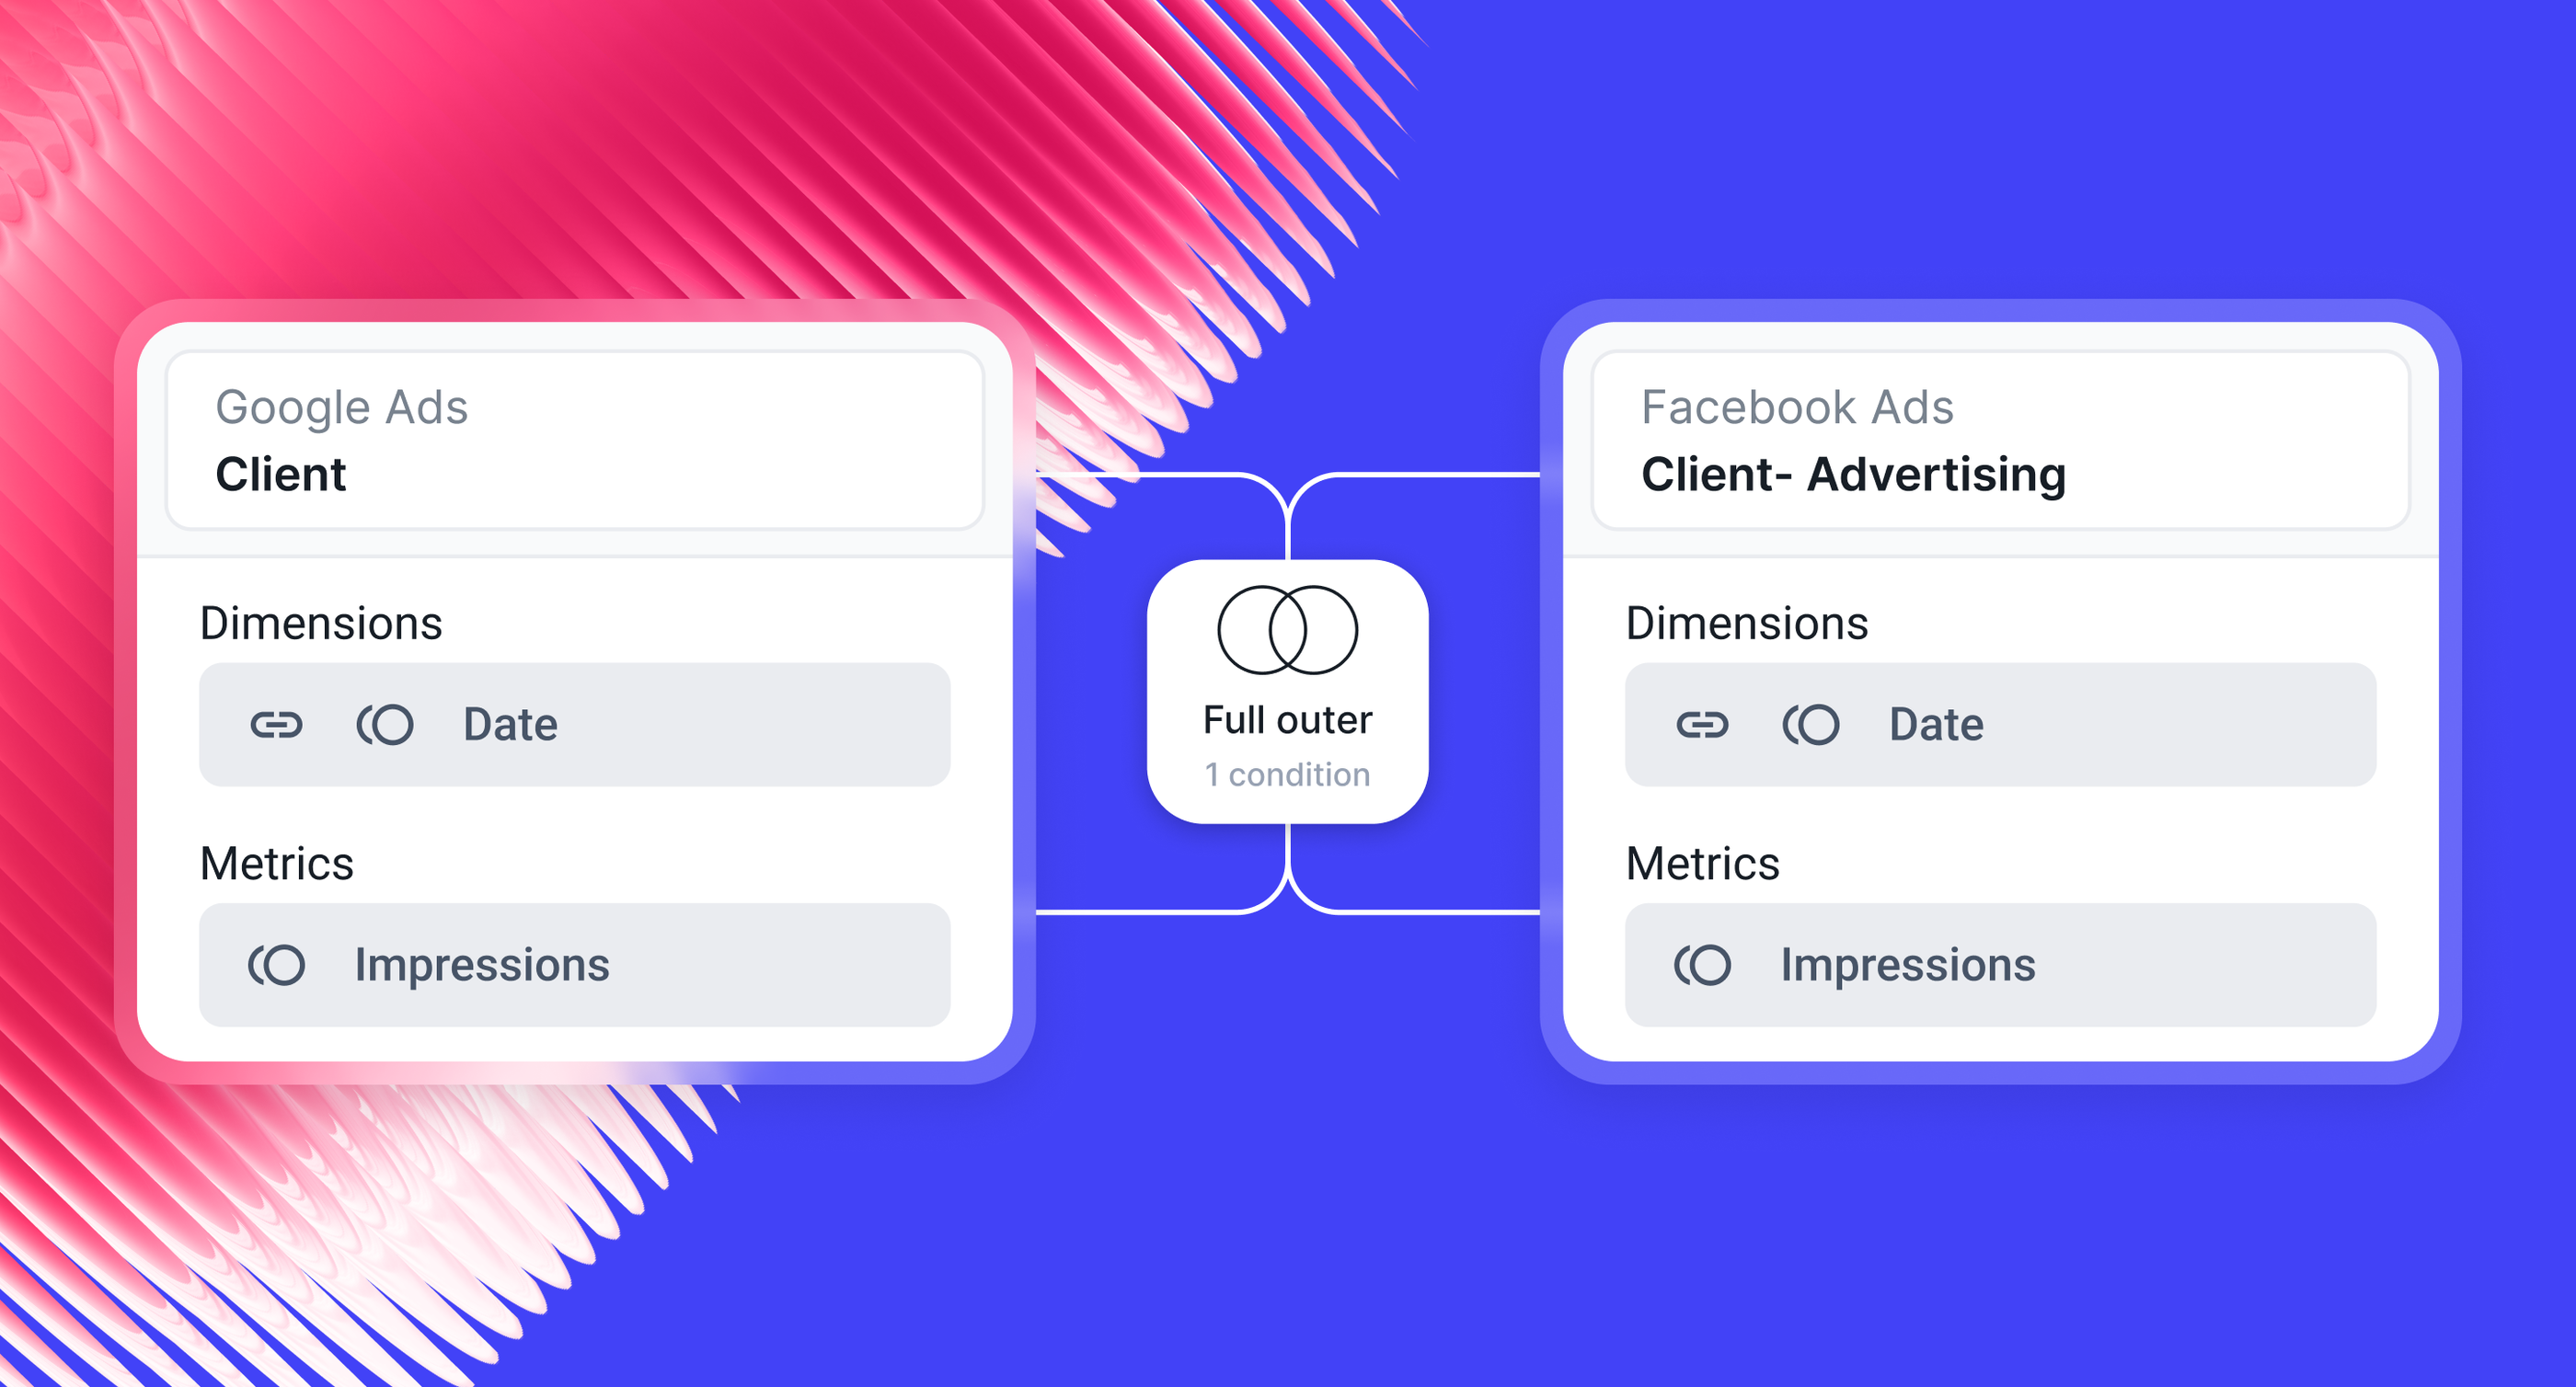
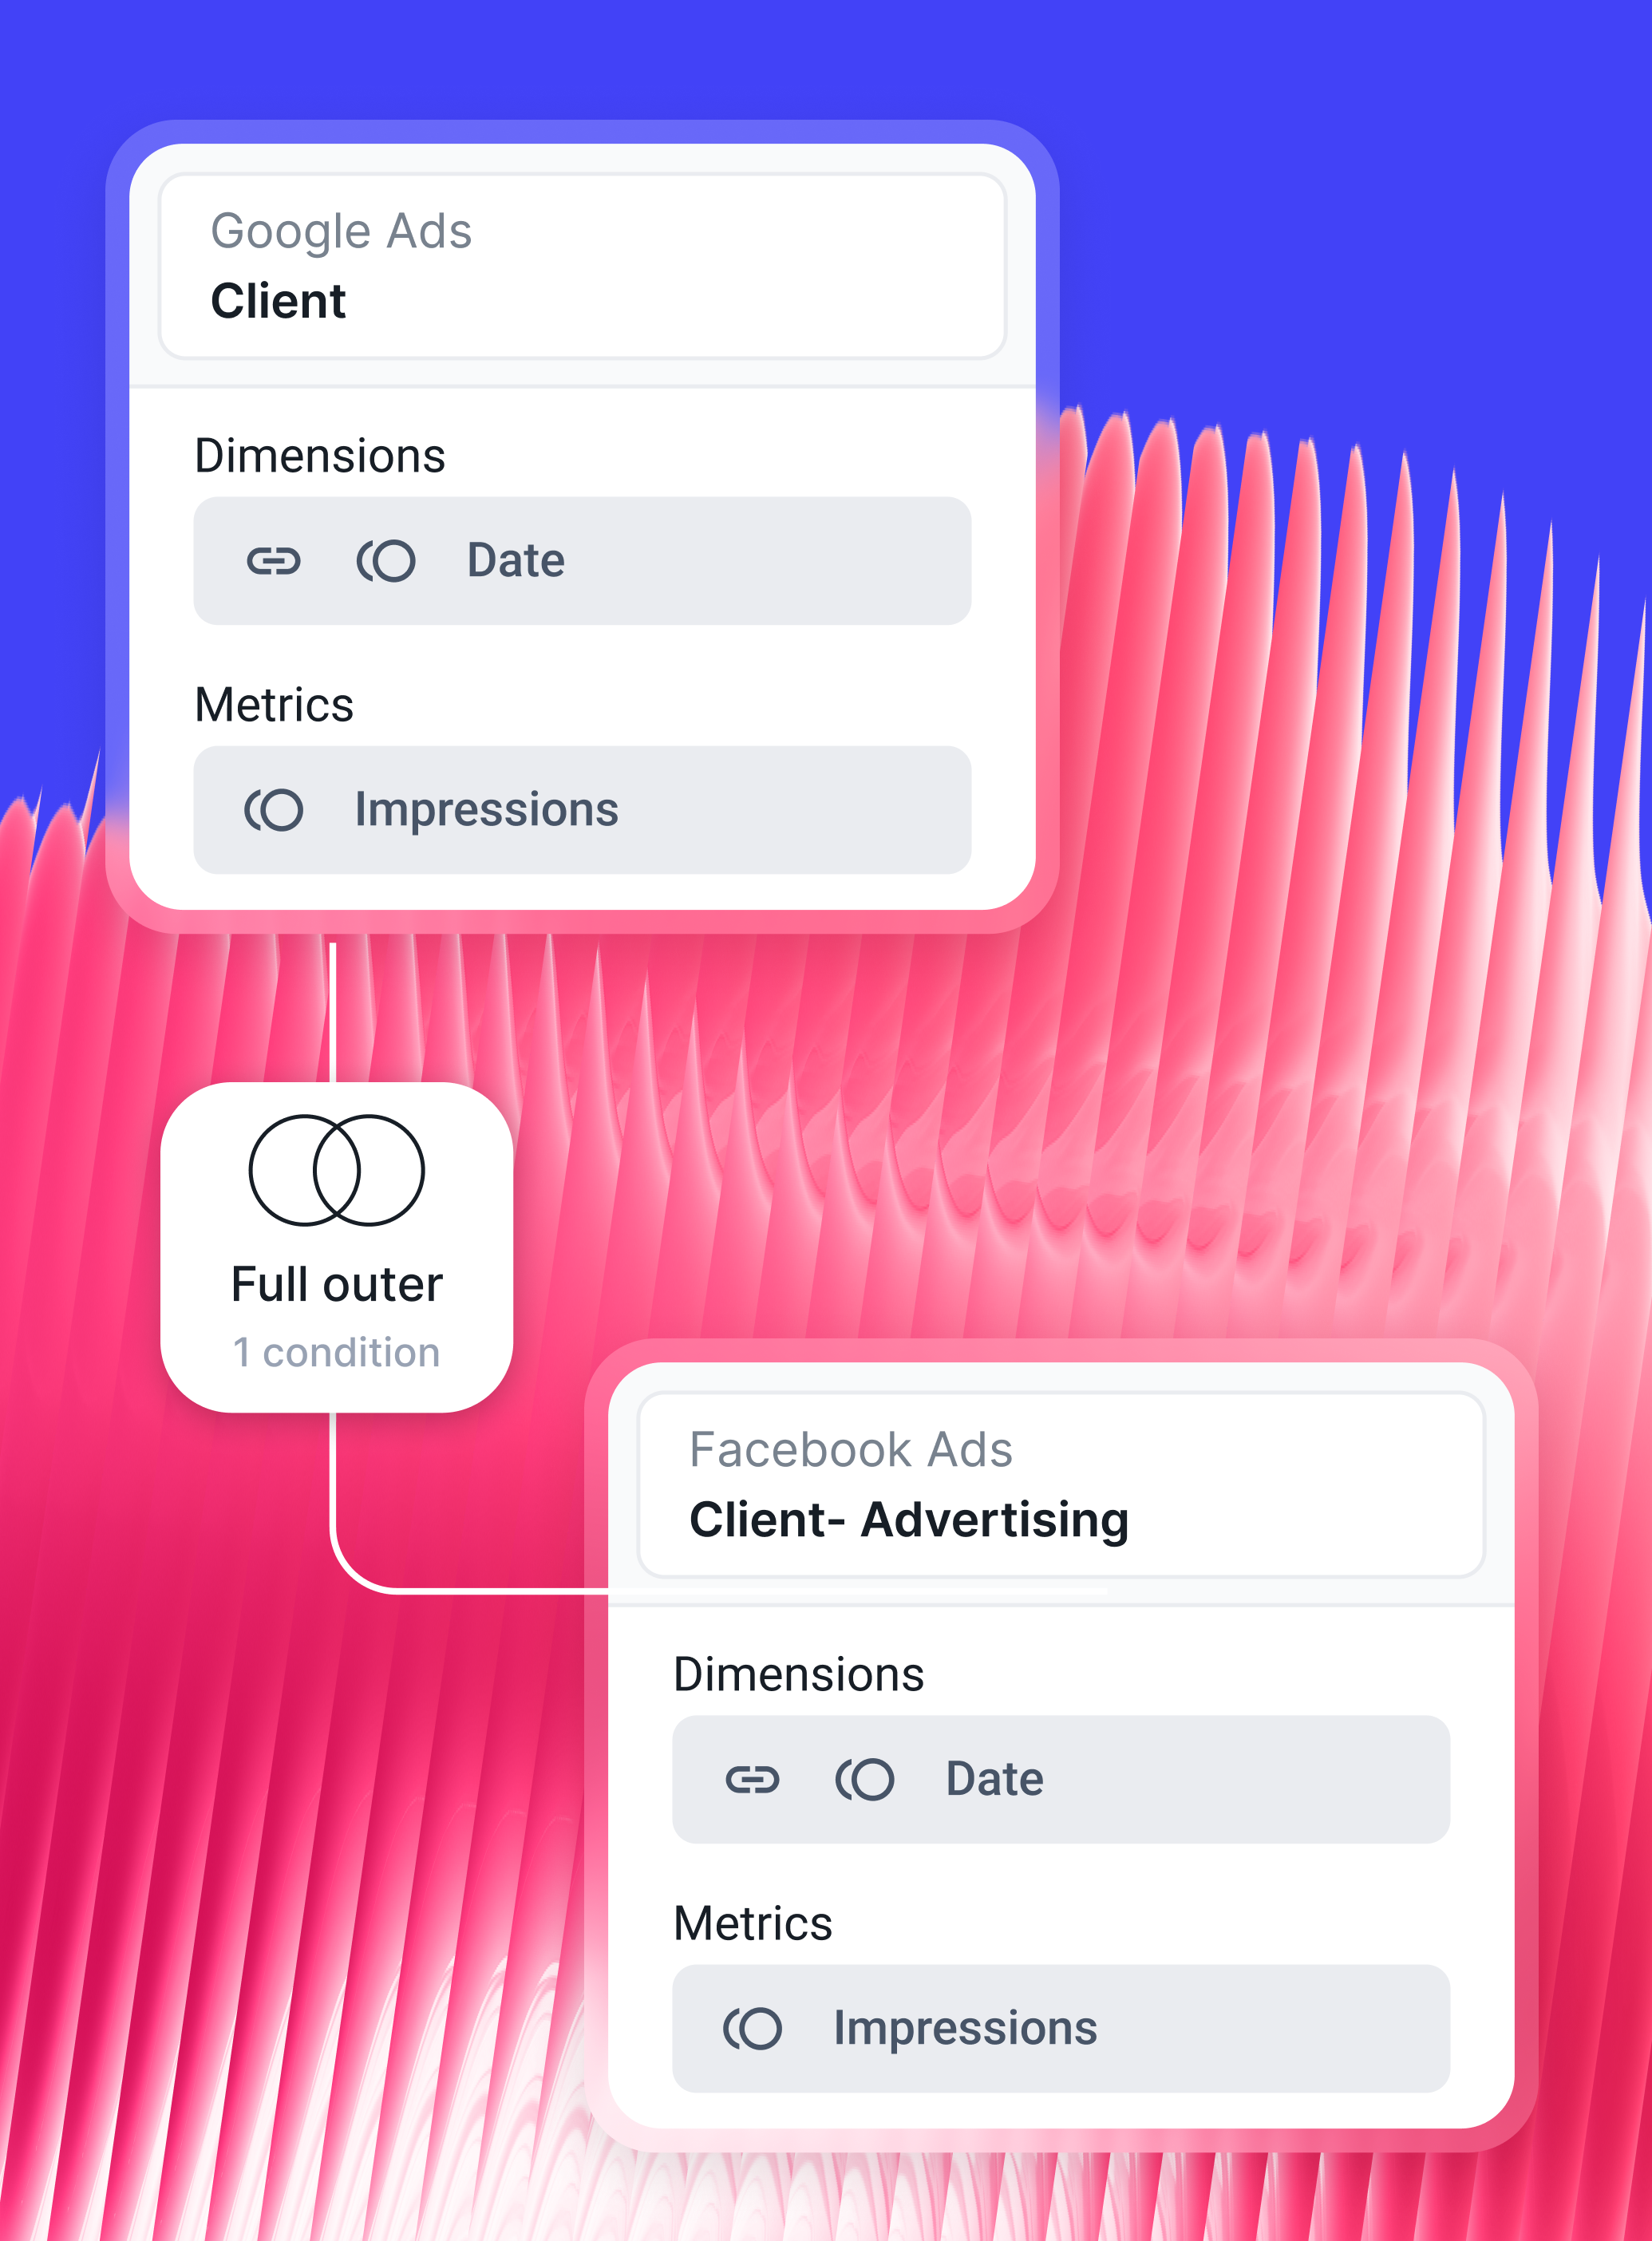
Blend data across channels
Choose your join key (like Date or Campaign) and type (left, inner, full & cross), and create cross-channel datasets in seconds.
Marketing teams are already
seeing the difference
The biggest reason we chose Whatagraph was its holistic approach. We can blend data from different channels and see in one view what needs to be changed.

Tanja Keglić
Performance Marketing Manager @ Achtzehn Grad

The biggest advantage of Whatagraph is having everything in one place. Funnel was two to three times more expensive than Whatagraph.

Linda van Baal
Online Marketing Consultant @ YourFellow
Whatagraph lets us pull in all the data we need, fit hundreds of locations in one report, and break it down exactly how our customers want.

Danielle Roberts
Director of Implementation & Support @ Rentable
Looker Studio was slow and always breaking. It was a constant guessing game.

Kim Strickland
Digital Marketing Specialist @ Peak Seven
We help you solve challenges like these
Standardize reporting across all regions and teams
Give every market the same clean reporting structure, unified naming, and consistent dashboards. Stakeholders finally get a global view that’s reliable and comparison-ready.
Spot wasted spend before stakeholders notice
Spot inefficient channels or campaigns before they drain your budget. Whatagraph highlights unusual spend patterns, alerts your team automatically, and gives you a clean cross-channel view so you can fix issues proactively.
Clearly show campaign-level ROI
Connect spend to revenue with clear, blended metrics and storytelling-ready dashboards. Stakeholders instantly see the value of your work and trust your reporting as a single source of truth.
Consolidate cost & revenue across media and marketplaces
Blend all your ad spend and sales data into one clean view, from Meta to Google to Shopify and beyond. Finally understand true CAC, ROAS, and profit without stitching spreadsheets together.
Data hub handles the heavy lifting automatically
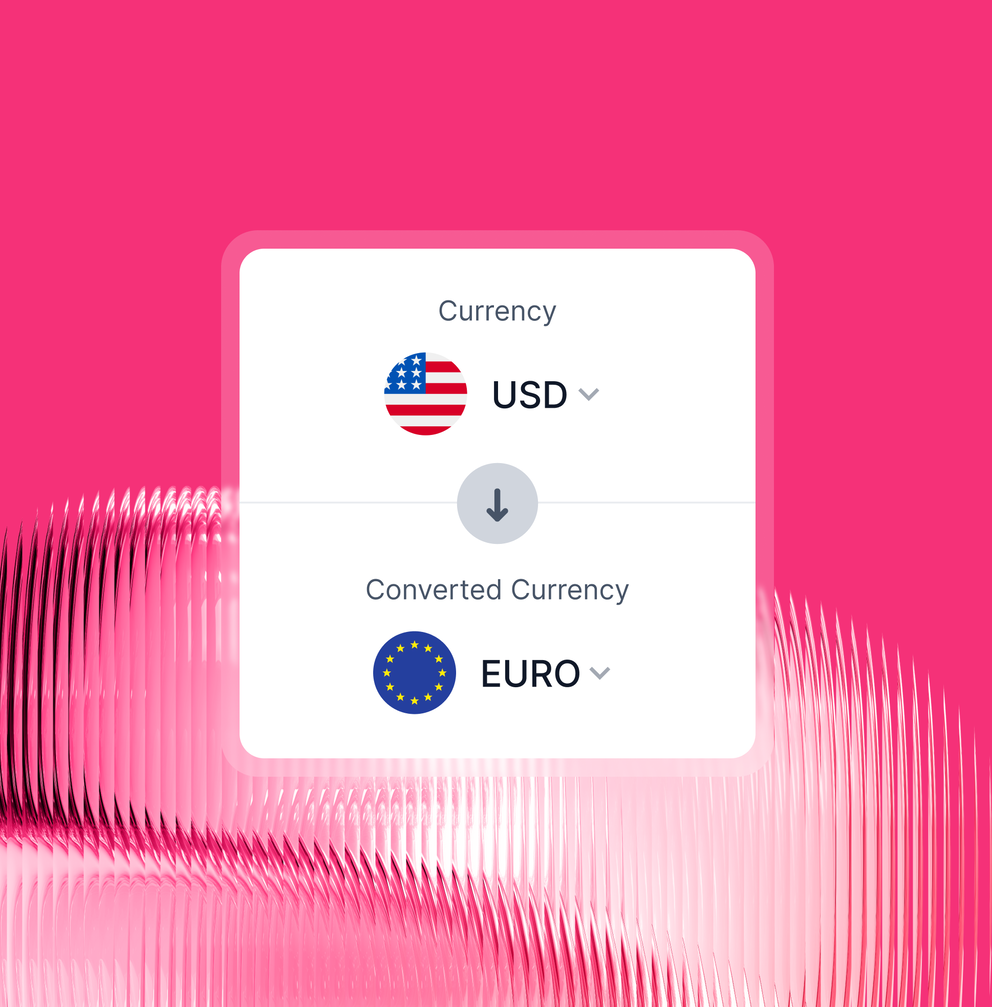
Automatic currency conversion for global reporting
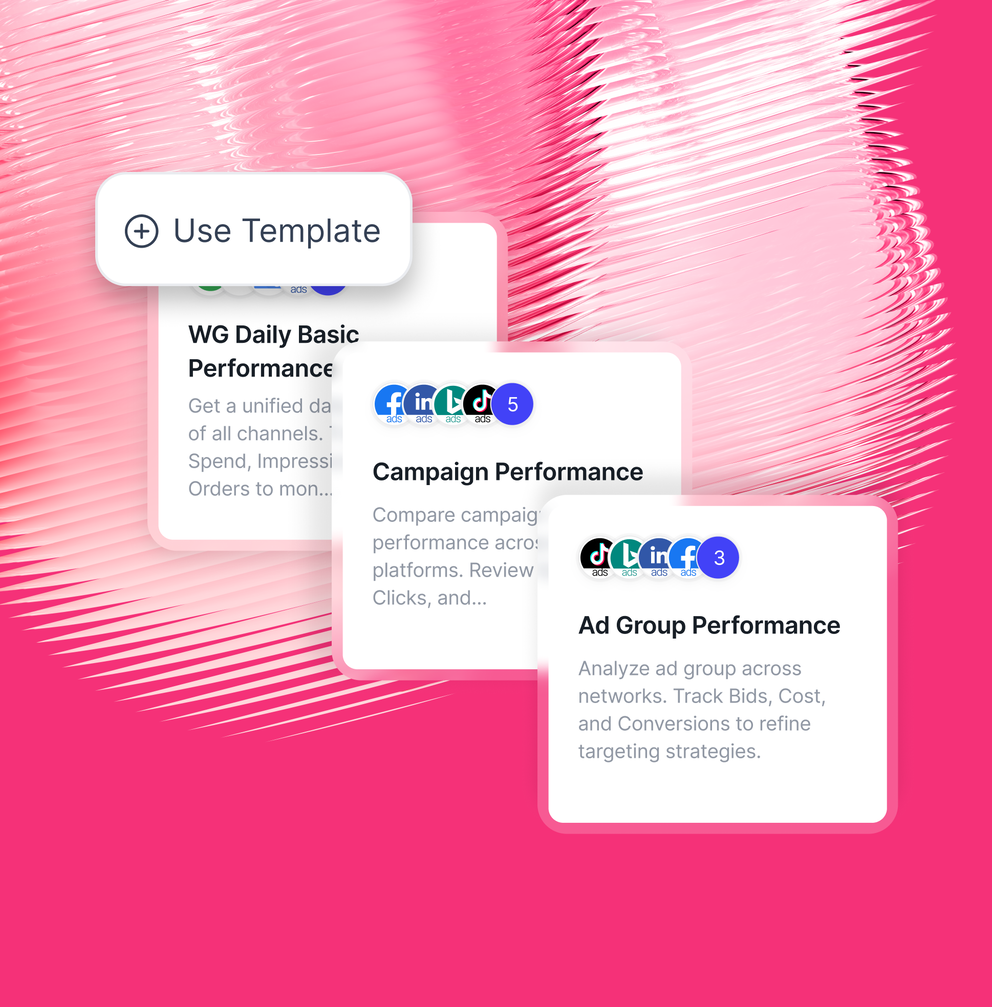
Pre-made data maps for a faster kick-off
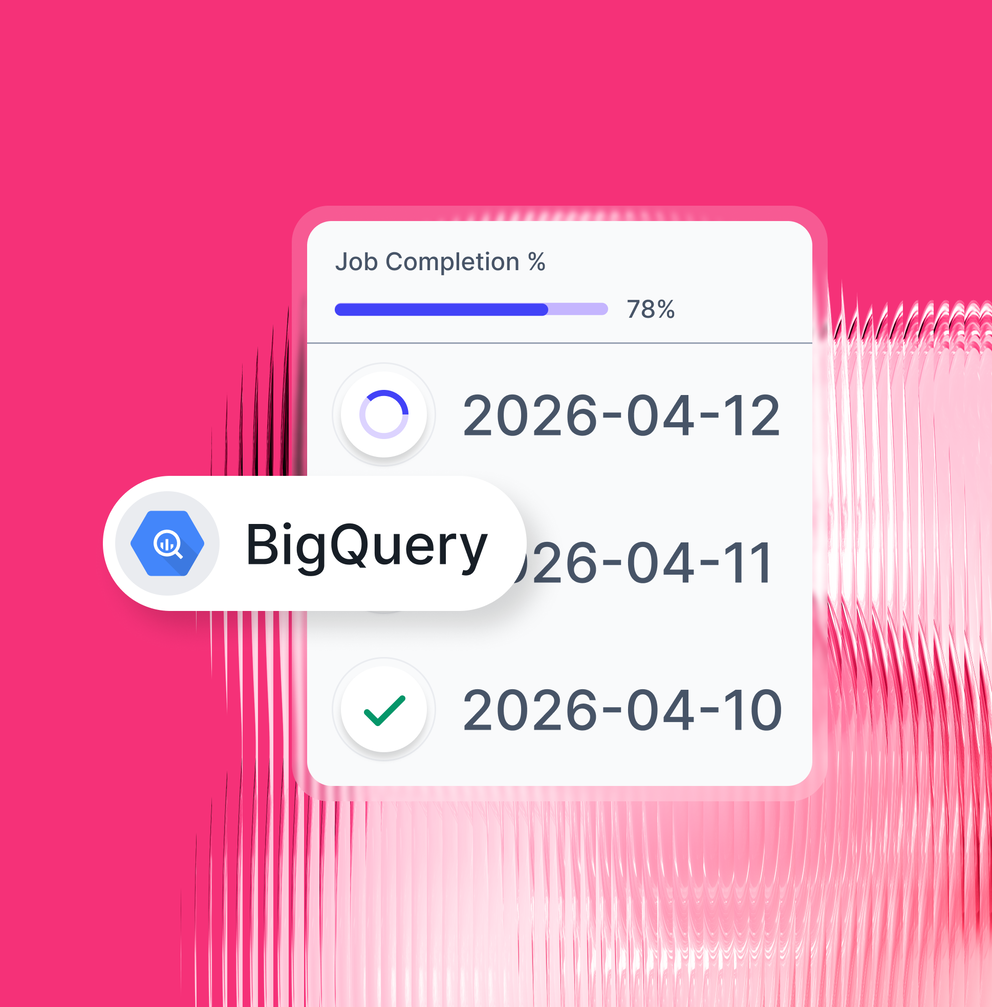
Export to BigQuery for advanced use cases