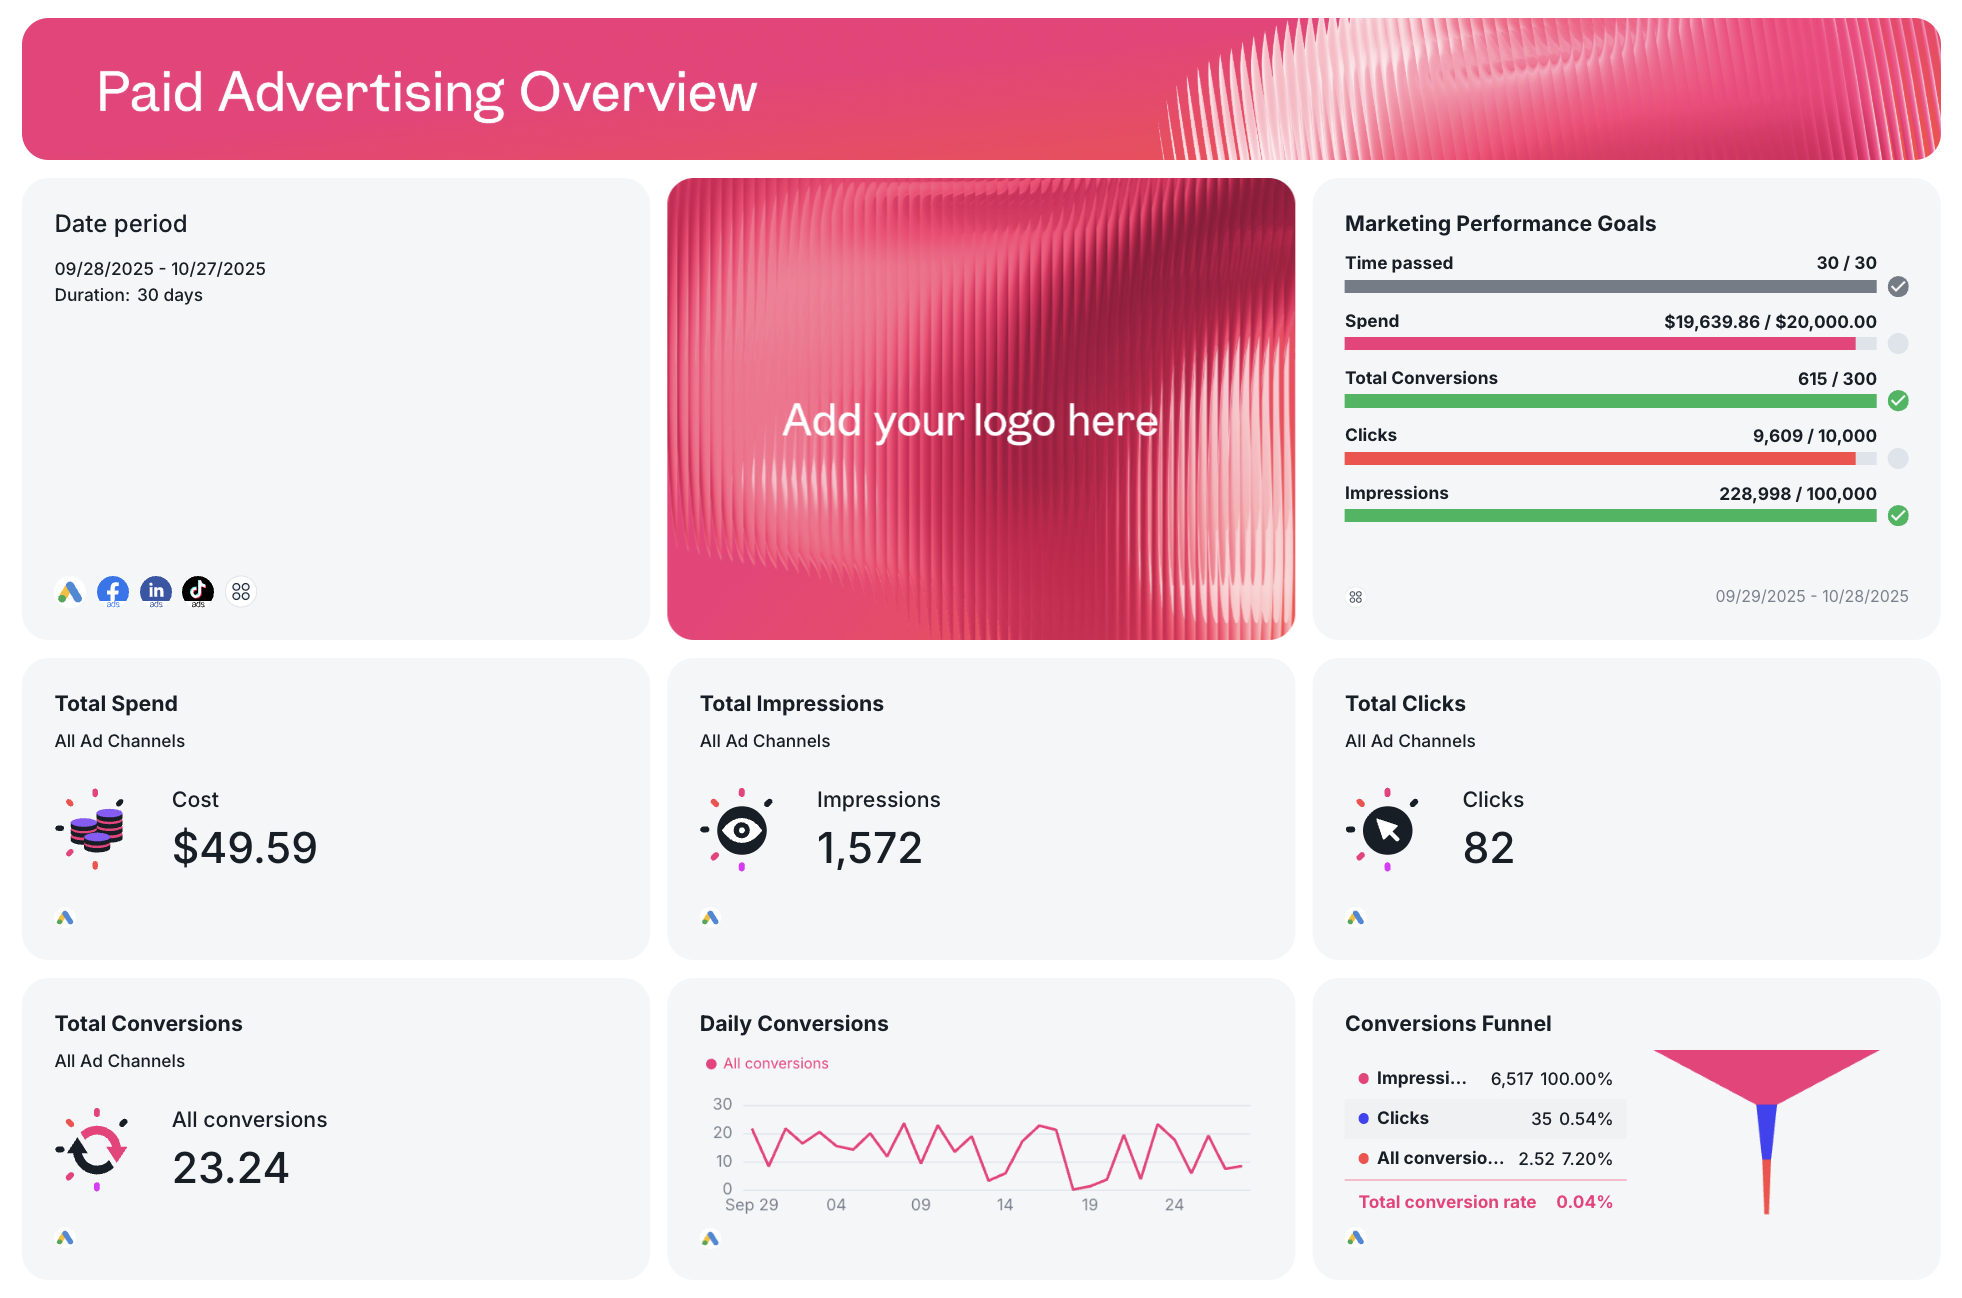
PPC Report Template

Running hundreds of PPC campaigns across multiple channels and clients?

Save time gathering paid ads performance metrics with one stunning PPC Report Template.

Wow clients with white-labeled reports—built in seconds. Tell compelling stories with your PPC data.

PPC Report Template for Marketing Agencies
Trusted by 1,000+ marketing agencies around the world
Whatagraph image
Whatagraph image
Whatagraph image
Whatagraph image
Whatagraph image
Whatagraph image
Whatagraph image
Whatagraph image
Whatagraph image
Whatagraph image
Whatagraph image
Whatagraph image

How Whatagraph Saves You Time on Reporting

Automatically collect data from multiple channels at once

Frustrated with PPC data scattered over dozens of channels?


With Whatagraph, you can consolidate them all on one platform in a few clicks.


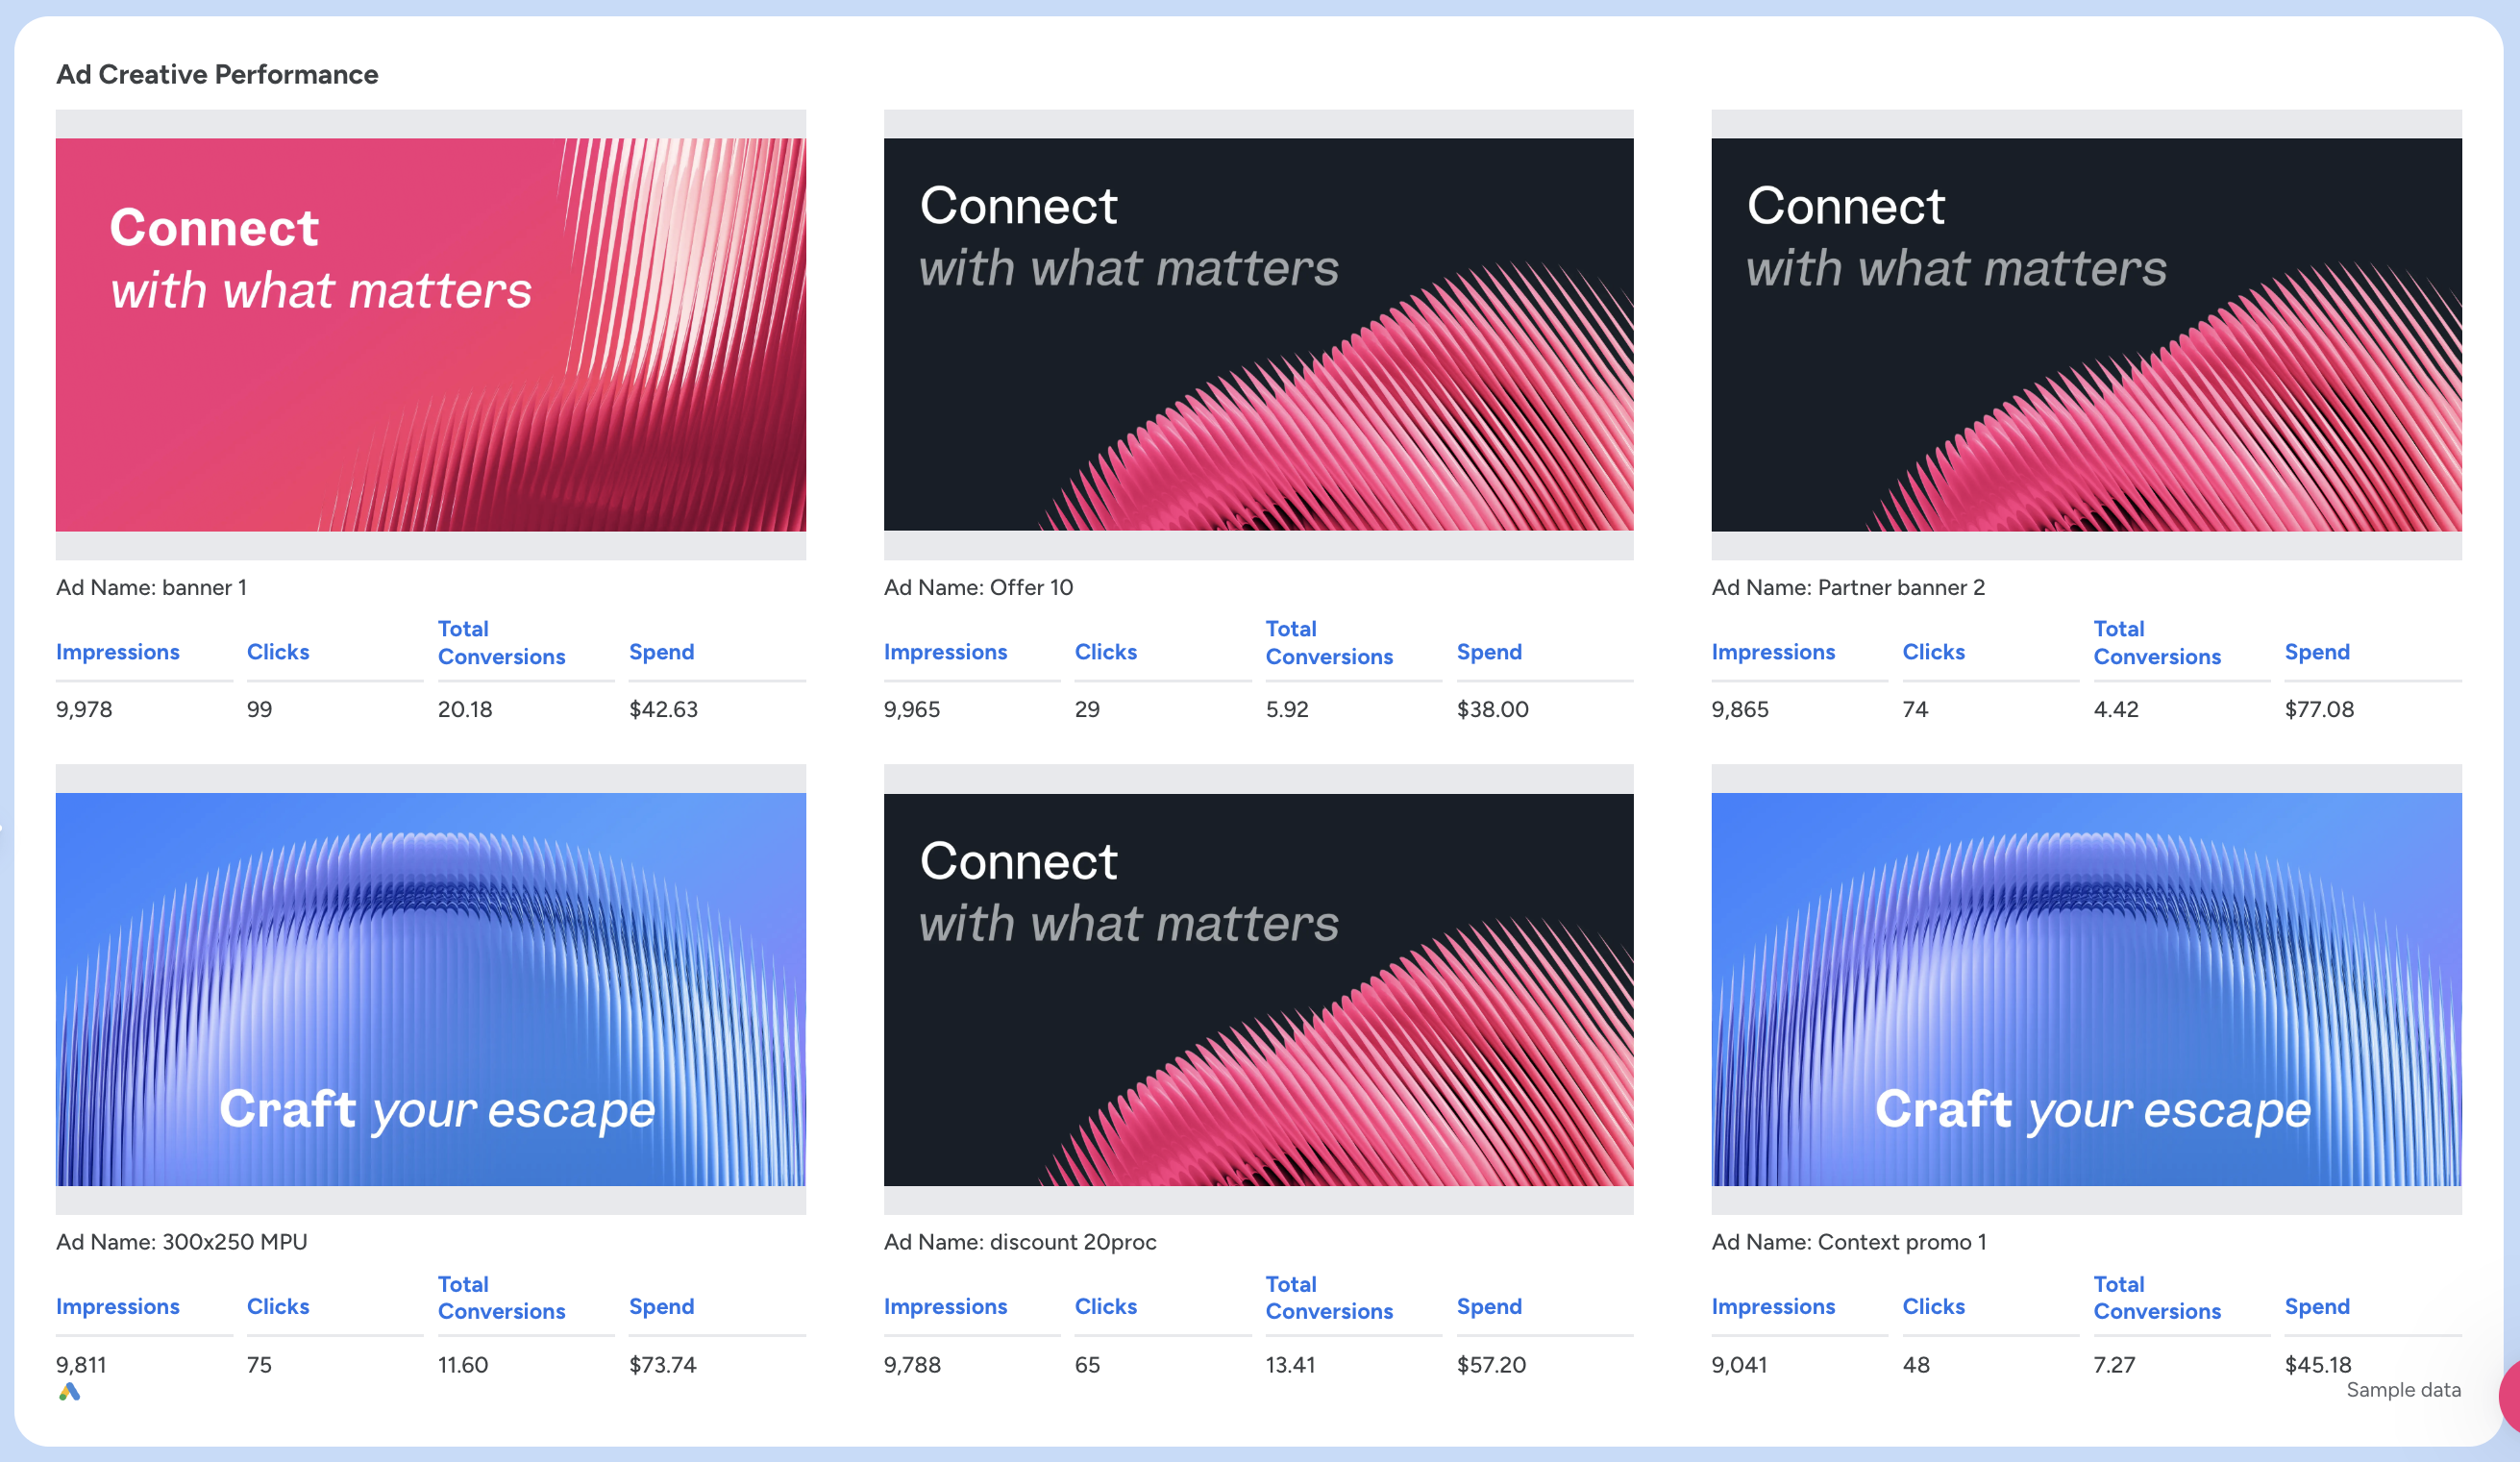
Visualize the data based on your own preference with lists, tables, charts, images, and comments. 


No complex setups needed. Just plug, and go.

Automatically collect data from multiple channels at once - PPC report template

Organize all your paid-channel KPIs under one roof

Want to see the total ad spend for all your clients? Or CTR performance for both Google and Facebook Ads? 


You can do that (and more) on Whatagraph.


Easily blend performance data in a few clicks to get the full picture of PPC performance.  


Use Google Sheets and Public API integrations to include custom data from any source.

Organize all your paid-channel KPIs under one roof - PPC report template

Customize your PPC reports

Impress clients with professional and polished performance reports. 


Customize your reports with your client’s logo. Create different color schemes. Add header texts. Get custom domains. The possibilities are endless.


Create reports from scratch or use our pre-made PPC reporting template. Quick and easy.

PPC KPIs in a single chart.

Share data and reports your way

Want to send automated emails to your clients every month? Or ship your data to BigQuery?


We got you.


Share live links to reports, send automated emails, export to CSV or Excel, and transfer data to Google BigQuery — all through Whatagraph.

Share data and reports your way - PPC report template

It’s good to be loved! Our clients are not shy about expressing it.

I made a switch from GDS and Sheets for reporting to Whatagraph, and I am saving literal hours each week on performance report creation. Our small firm actually managed to onboard 2 new clients as a result of all the time we saved on managing data and reporting. The customer service is also really helpful and easy to reach.

Mindaugas S., Marketing ConsultantCapterra logo for Whatagraph review

Capterra verified review by

Mindaugas S., Marketing Consultant

Having active customer support to help fix any issues was a big contributor, but we also really liked the ability to save templates and connect sources to multiple charts/widgets at once without having to edit them individually. And having the grid layout is much easier to stay consistent with than the free form setup that Data Studio has.

Nico T., Media PlannerCapterra logo for Whatagraph review

Capterra verified review by

Nico T., Media Planner

The system has standard templates that are easy and fast to use. Also you can build your own report with lightning speed. It is very easy to use, has a lot of integration, and let get started very fast.

Rasmus Bernt K., External Senior Management ConsultantCapterra logo for Whatagraph review

Capterra verified review by

Rasmus Bernt K., External Senior Management Consultant

We love Whatagraph - we would definitely recommend and our account manager is great! I love how easy this tool is to use, everyone on the team finds it much more user-friendly than other dashboards. Integration was easy, we sent some example reports to the team who duplicated these for us. We literally had to log in and send it to our clients!

Stephanie S., Digital DirectorCapterra logo for Whatagraph review

Capterra verified review by

Stephanie S., Digital Director

We are showing our clients the work that we're doing for them and this is incredibly important for our clients ROI. They want to see results and having a tool like Whatagraph that can show data from virtually every source we use is hugely important.

John S., SEO StrategistCapterra logo for Whatagraph review

Capterra verified review by

John S., SEO Strategist

The tool is easy to use; you do not need to have development resources. Even my junior project managers are capable of making campaign reports in minutes. There are a lot of pre-made templates you can use as well as many pre-made widgets.

Erman E., Marketing SpecialistCapterra logo for Whatagraph review

Capterra verified review by

Erman E., Marketing Specialist

Really easy to connect data sources within the tool. The library of report templates has been helpful. The customer support team has been responsive to all of our needs. Our team enjoys the simplicity of setting up the reports and how the data is presented.

Brent N., Director of OperationsCapterra logo for Whatagraph review

Capterra verified review by

Brent N., Director of Operations

Easy to create really beautiful graphs and reports which can help other team members to understand the most important takeaways. I especially like the automated report function, so I don't have to check on the same thing repeatedly.

Orsolya S., Online Marketing ManagerCapterra logo for Whatagraph review

Capterra verified review by

Orsolya S., Online Marketing Manager

More Sources for Your PPC Report Template

Connect all your paid advertising, SEO, social media, e-commerce, and other digital marketing platforms. Hook up the sources, and data flows automatically. No coding needed.

Why Do You Need a PPC Report Template?

A PPC report template can help you overcome the challenges of tracking and reporting paid advertising performance across channels.

Here are some pain points that a professional PPC report template can help you with:

Scattered data

Marketing agencies often run multiple PPC campaigns for different clients on different channels. 

For example, one client can have 3 PPC campaigns on Google Ads and 2 on Facebook Ads. 

Another can have 5 campaigns on TikTok Ads plus a remarketing campaign on Taboola.

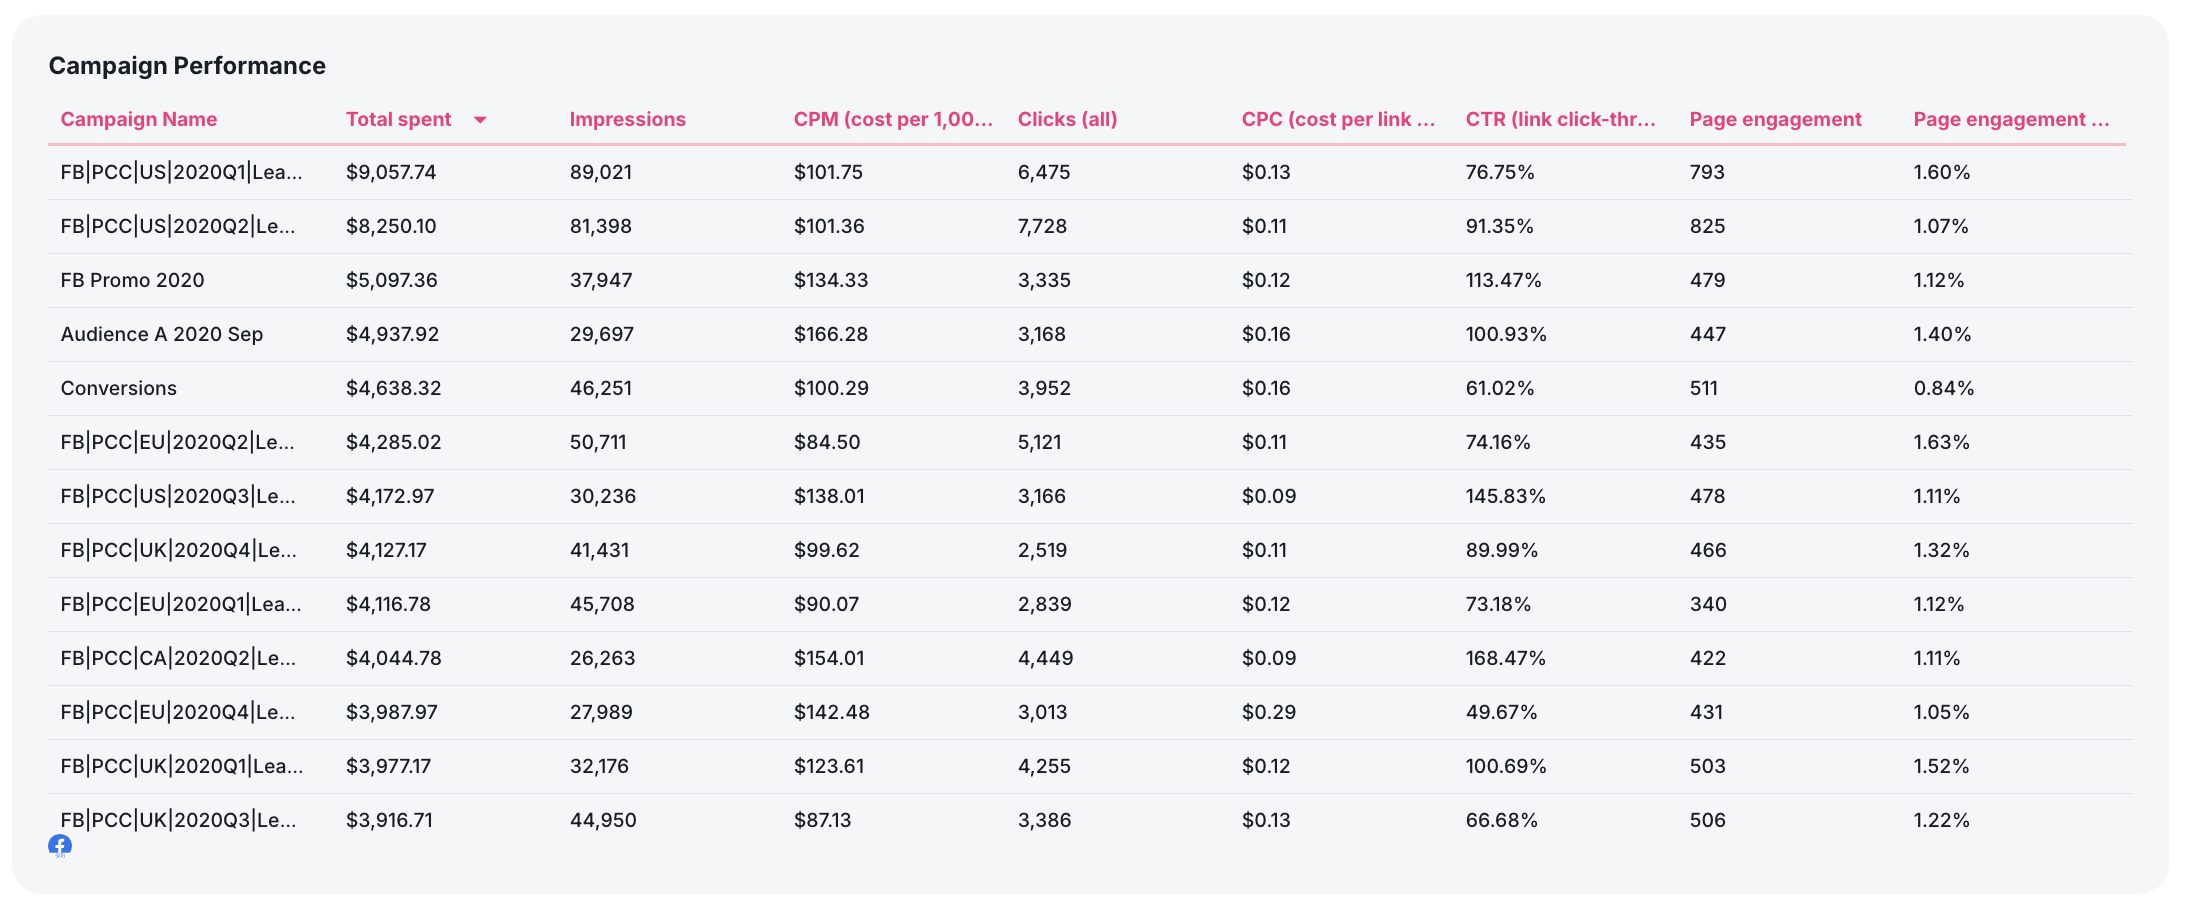
Each platform has its own analytics and reporting methods, making it difficult to see all performance at a glance. 

Scattered data means you must put in extra work to gather, prepare, and interpret information from all those sources. 

Inconsistent metrics 

Different ad platforms measure success in different ways. 

For example, Google Ads might prioritize Click-Through Rates (CTR), while Facebook Ads focus on Engagement or Reach. 

To add to the confusion, different platforms name metrics differently, so for example, 

  • conversions
  • total clicks
  • website clicks


— can mean the same thing on three different platforms, making it difficult to see the total values across all channels. 

Without a way to unify metrics, your report can appear fragmented and incomplete to clients. 

Time-consuming reports

Creating PPC reports manually takes a lot of time. 

First, you need to collect data and convert the rows and columns into more digestible formats, such as charts, breakdown tables, or summaries. 

As you’re doing it, you must also transform data—unify metrics, group similar data, or even blend several sources to get the insights you need to prove your success. 

Next, you need to customize the reports to each client’s preferences, which takes even more of your time.  

Pressure to show ROI

At the end of the day (or month), clients expect clear, measurable results from their PPC investments. 

Your agency can be under a lot of pressuer to demonstrate the return on investment (ROI) from paid advertising campaigns. 

Without a structured report that clearly shows the result, it may be difficult to show how specific ad spend turns into real business outcomes, such as leads, sales, or conversions.

We recently interviewed several agency leaders and discovered that failure to demonstrate value is the No.1 reason agencies lose clients. 

Dylan Hey, CEO of Hey Digital, calls it “Neglecting to measure and report on clear, tangible outcomes.

One must tell a story and not just present numbers. Agencies aren't consistent with reporting which leaves clients questioning the value of the service.” Explains Hey. 

What to Look for in a Comprehensive PPC Report Template?

Having the biggest PPC reporting pain points in mind, you should look for a PPC report template that gives you the following:

Cross-platform reporting

Agencies often run PPC campaigns on several platforms, each with its native analytics and reporting dashboards. 

Consolidating this data manually takes time, and there’s also a huge possibility of error. 

But with a PPC report template with cross-platform capability, you can automatically pull key metrics from each source into a unified format. 

In Whatagraph, you can easily add more sources to your PPC template and present data from each using ready-made widgets. 

Cross-platform reporting - PPC report template

This way, you can always see which channel is doing fine and where you need to take a closer look. 

As a result, your agency can:

✅ Save time by having all data in one place.

✅ Reduce the risk of errors.

✅ Give clients a complete view of their ad performance across all channels. 

Auto-updating metrics

Collecting the latest metrics can be slow, especially if you manually export data into spreadsheets or use PPC reporting templates with unreliable third-party connectors. 

Built by different vendors, these connectors may have different refresh rates, which may cause some data to be inaccurate. 

If only we had a cent every time we heard someone complaining about Looker Studio not updating data evenly across all integrations…

Such a report takes the “real” out of real-time insights.

An auto-updating PPC performance report template pulls live or near-real data from all PPC platforms, ensuring that all metrics are always current. 

Once you connect your PPC channels to a Whatagraph PPC report template, there’s nothing to update or refresh on your side. 

All integrations are fully automated and keep feeding your reports with the latest data. 

As a result:

✅ You can always deliver up-to-date metrics to clients.

✅ Reduce manual workload and build reports faster. 

✅ Boost client trust as they know you can always deliver timely and accurate information.

Customizable for different clients 

Each client has unique goals, KPIs, and business models. 

If you use a one-size-fits-all report, you risk sending unimportant or confusing information to some clients, who may just stop reading your reports. 

We’we heard that many times. 

“It’s pivotal that agencies don’t take a ‘one-size-fits-all’ approach to their service. While they can have some type of ‘template’ for how their processes work or a general list of what they can offer, every client should have a personalised approach. Failing to consider the individual needs and goals of clients can lead to dissatisfaction as well as lacklustre work that can tank your reputation and retention rate.” 

Gareth Bull - Founder of Bulldog Digital Media

You need a PPC report template you can tailor so the content, metrics, and layout match the client’s preferences. 

With Whatagraph, your job is made easy. 

You can freely drag and drop each widget and rearrange them like building blocks. 

A client doesn’t care about a specific metric? Remove the widget from the report and keep the view uncluttered.

Use our Goals widget to highlight how your efforts are bringing you closer to your client’s goals. 

Customizable for different clients - PPC report template

Whether your client is focused on lead generation, brand awareness, or conversion optimization, you can adjust the template to highlight KPIs that matter most to them.

As a result:

✅ You improve clients' satisfaction by presenting only the insights they want to see.

✅ Clients can easily understand the value of the report as it directly reflects their goals.

✅ Personalized reports show your understanding of the client’s business.

Visual storytelling

Raw data can be overwhelming and difficult for clients to interpret. This is especially the case if they’re not familiar with digital marketing metrics. 

If you just present numbers, clients may not effectively understand the trends or campaign performance.

For example, they would much better understand your PPC monthly report template if you could tell the story of data through graphs, charts, or infographics. 

These visuals help communicate complex information quickly. 

Even if you have no clue about marketing, you can clearly see the success or areas for improvement.  

Every template in Whatagraph is rich in visualizations. 

The moment you connect a PPC platform, you get a choice of charts, graphs, and other visual widgets for all metrics available from that source. 

Still, having just visualizations without context can leave many questions unanswered. 

In Whatagraph, you can add a text widget anywhere in your report and give more info on the data in a chart or table. 

  • If there is a surge in clicks — say what caused it.
  • If there’s a drop in leads — say that you’ve found the issue and reworked the ad already.

The result:

✅ Clients can better understand campaign performance, which leads to more productive conversations. 

✅ They’re more likely to engage with the report if they find it easy to digest.

✅ Well-designed visuals make your agency look more professional and organized.

“Clearly and transparently display the results from your campaigns, in addition, ensure that you include the work undertaken with commentary, and future work to be done. A bonus is to include any industry updates in reports to explain how things may impact them and how you are navigating them, such as new Google algorithm updates.”

Matt Pyke - Founder @ Fly High Media

Linked templates

For big agencies that manage lots of clients, making individual changes to each client’s report is a painstaking work. 

Even small edits in branding, metrics, or campaign structure across several reports can take up a lot of time that you can use more productively. 

A PPC report template with a group edit feature lets you make changes across several reports at once. 

This is especially useful if you need to update the reporting format or add a new feature to all client reports.  

Whatagraph’s Linked Reports feature is a lifesaver for big agencies that manage reports for multiple clients. 

How it works:

  1. Choose a report that will be a master template.
  2. Create any number of reports from this template. 

Any changes you make to the master template also take effect in the linked reports. 

This way you can bulk edit connected sources, textual widgets, images, and company logos for multiple reports instead of doing it manually in each report.
Linked reports - ppc report template

With linked reports, you can:

✅ Save hours by making changes across multiple reports in one go. 

✅ Achieve consistent updates across all client reports while avoiding mistakes.

✅ Scale your agency operations by managing more reports even as your client base grows.

“Having active customer support to help fix any issues was a big contributor, but we also really liked the ability to save templates and connect sources to multiple charts/widgets at once without having to edit them individually.”

Capterra verified review by

Nico T., Media Planner

White-labeling

If you use non-customizable PPC report template PDFs or send reports with third-party software branding, you can look unprofessional and confuse clients about the source of the report.

With white-labeling, you can fully customize the template with your own branding, logos, and color theme. 

Every PPC report sample you create can look as if you created it in-house.

In a few clicks, you can replace Whatagraph branding with your own: 

  • Upload your logo or your client’s logo to the report
  • Create color schemes that fit your brand colors
  • Add text, headers, and footers

This means you get professional and white-labeled reports without overwhelming your team with complex customization set ups.  

What does this achieve:

✅ You reinforce your own brand identity, creating a polished, professional appearance. 

✅ Improve client trust by making reports feel like a seamless extension of your agency’s services rather than a third-party product.

✅ Stand out from competitors who may not provide this level of customization.

How to Write a PPC Report

Here is a breakdown of must-have sections you should include in every PPC report + tips on how to write each part effectively.

1. Cover section

The cover section serves as the first impression of the report and should include:

  • Client’s Name and logo
  • Agency Name and logo
  • Report Title (e.g., "PPC Performance Report for [Month]")
  • Reporting Period (e.g., January 2024)
  • Prepared By (Account Manager’s Name)

Report cover - PPC report template

This section creates a professional, branded introduction to your report and sets the tone for what’s inside.

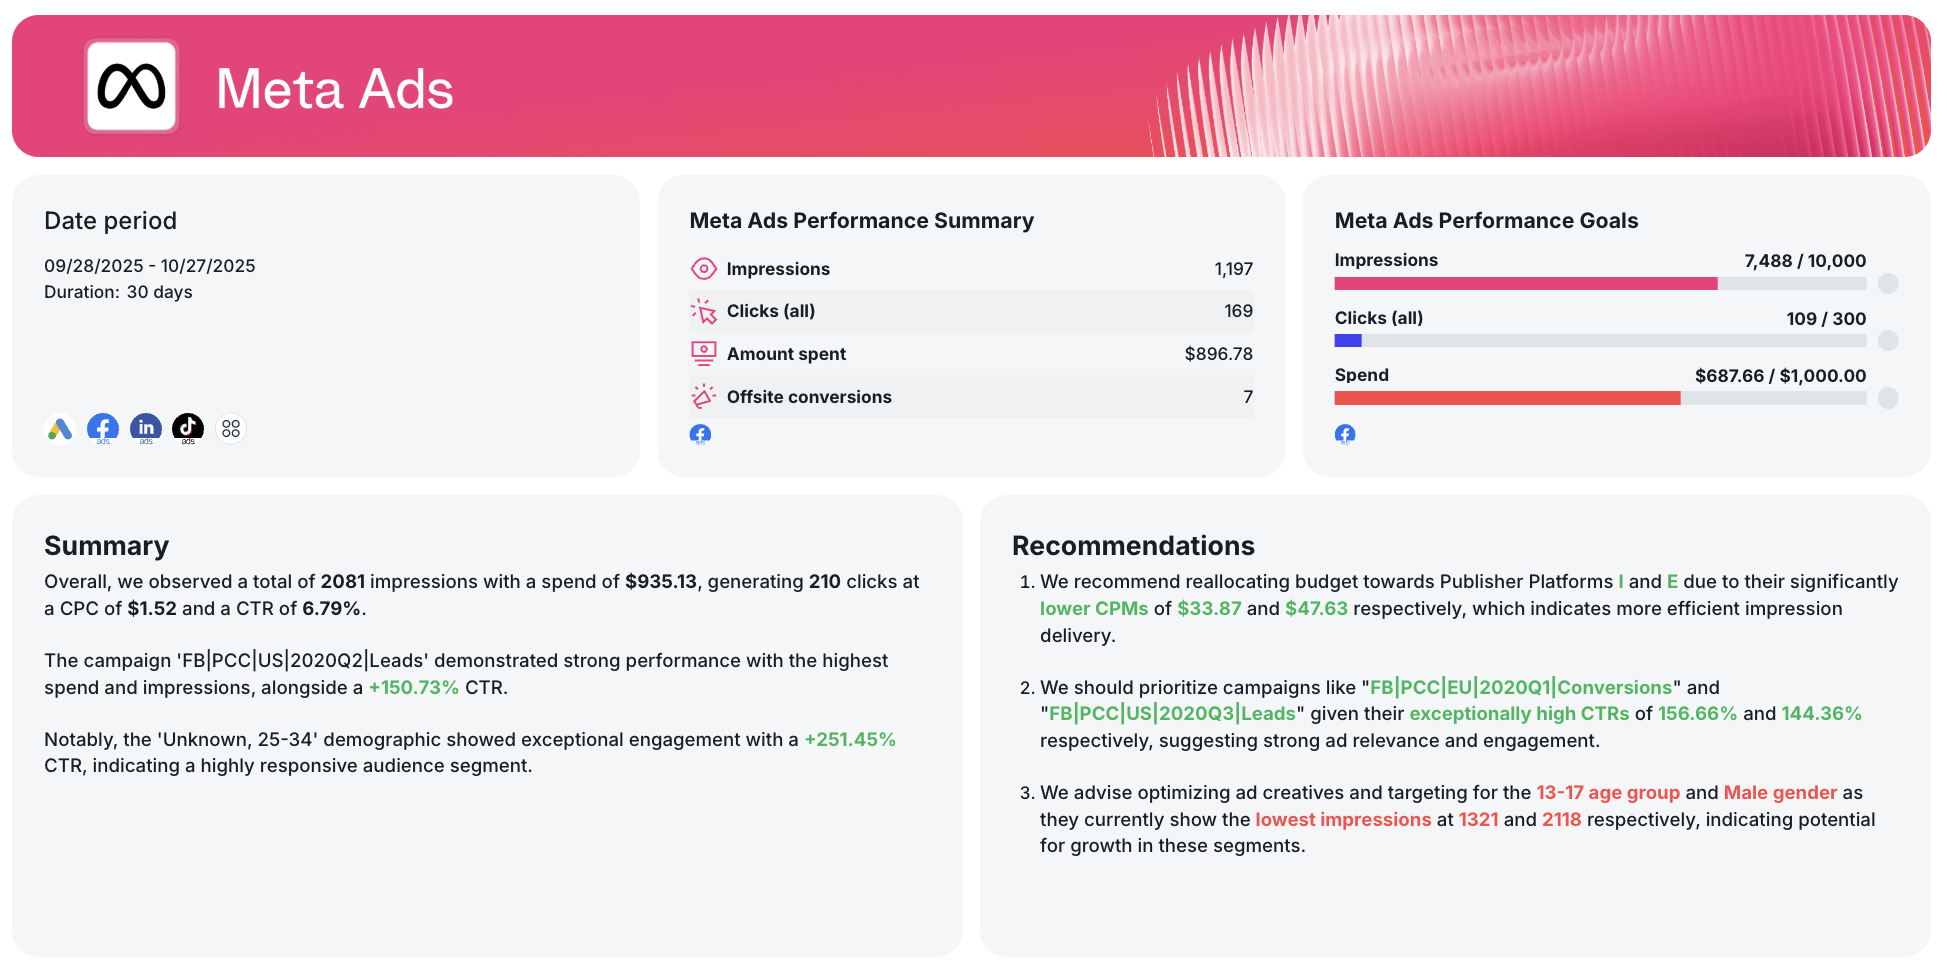
2. Executive summary

The Executive summary gives you a high-level overview of the campaign’s performance. As its name says, it sums up the key outcomes in simple, non-technical language. 

Here are two examples of how a summary can look:

Executive summary - PPC report template

Your aim is to give clients an at-a-glance understanding of how their PPC campaigns performed during the reporting period.

3. Goals

The Goals section is a snapshot of how the campaign is performing against the primary objectives. This section should display:

  • The goals set at the beginning of the campaign (e.g., conversions, leads, revenue)
  • The current status (percentage completion of the goal)
  • Highlight whether the campaign is on track, exceeding, or underperforming against goals.

You can easily present this in Whatagraph reports using our Goals widget.

Goals widget - PPC report template

Depending on the template you choose, the widget comes with default KPIs, but you can quickly change them for those that you and the client agree on. 

4. Single-value widgets

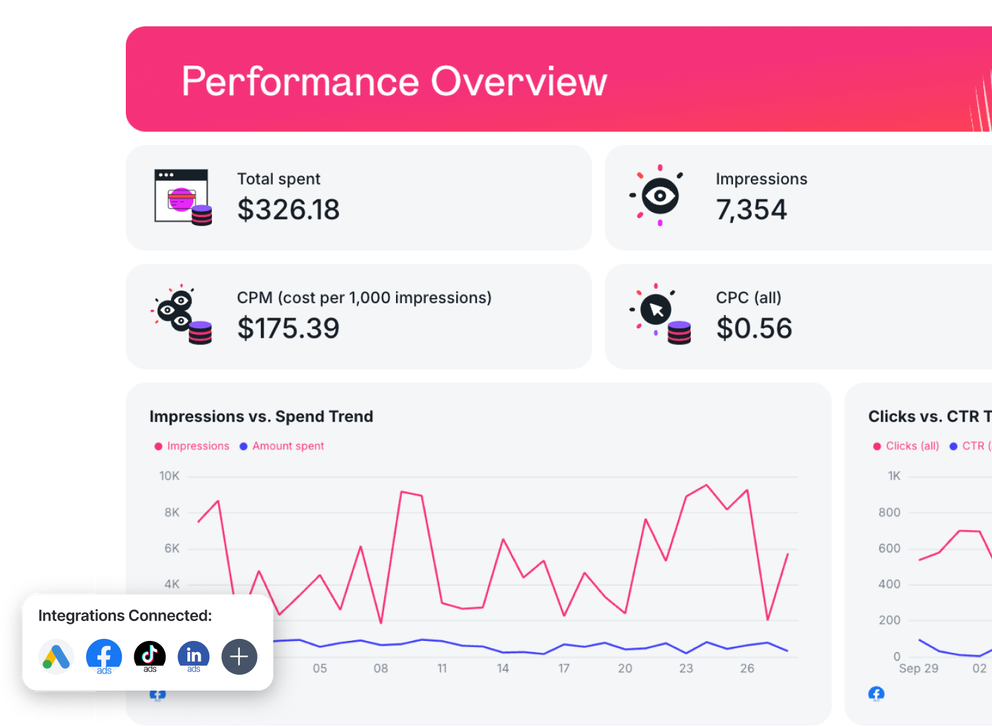
Single-value widgets provide concise key metrics that summarize campaign performance. You can include metrics such as:

  • Total Ad Spend
  • Impressions
  • Clicks
  • CTR (Click-through Rate)
  • CPC (Cost per Click)
  • Conversions
  • CPA (Cost per Acquisition)
  • ROAS (Return on Ad Spend)

This way, you can offer your clients clear numbers for each critical PPC metric, so they can assess performance quickly.

Single-value widgets - PPC report template

The best place for these widgets is at the beginning of your PPC campaign report template, after the executive summary and goals.  

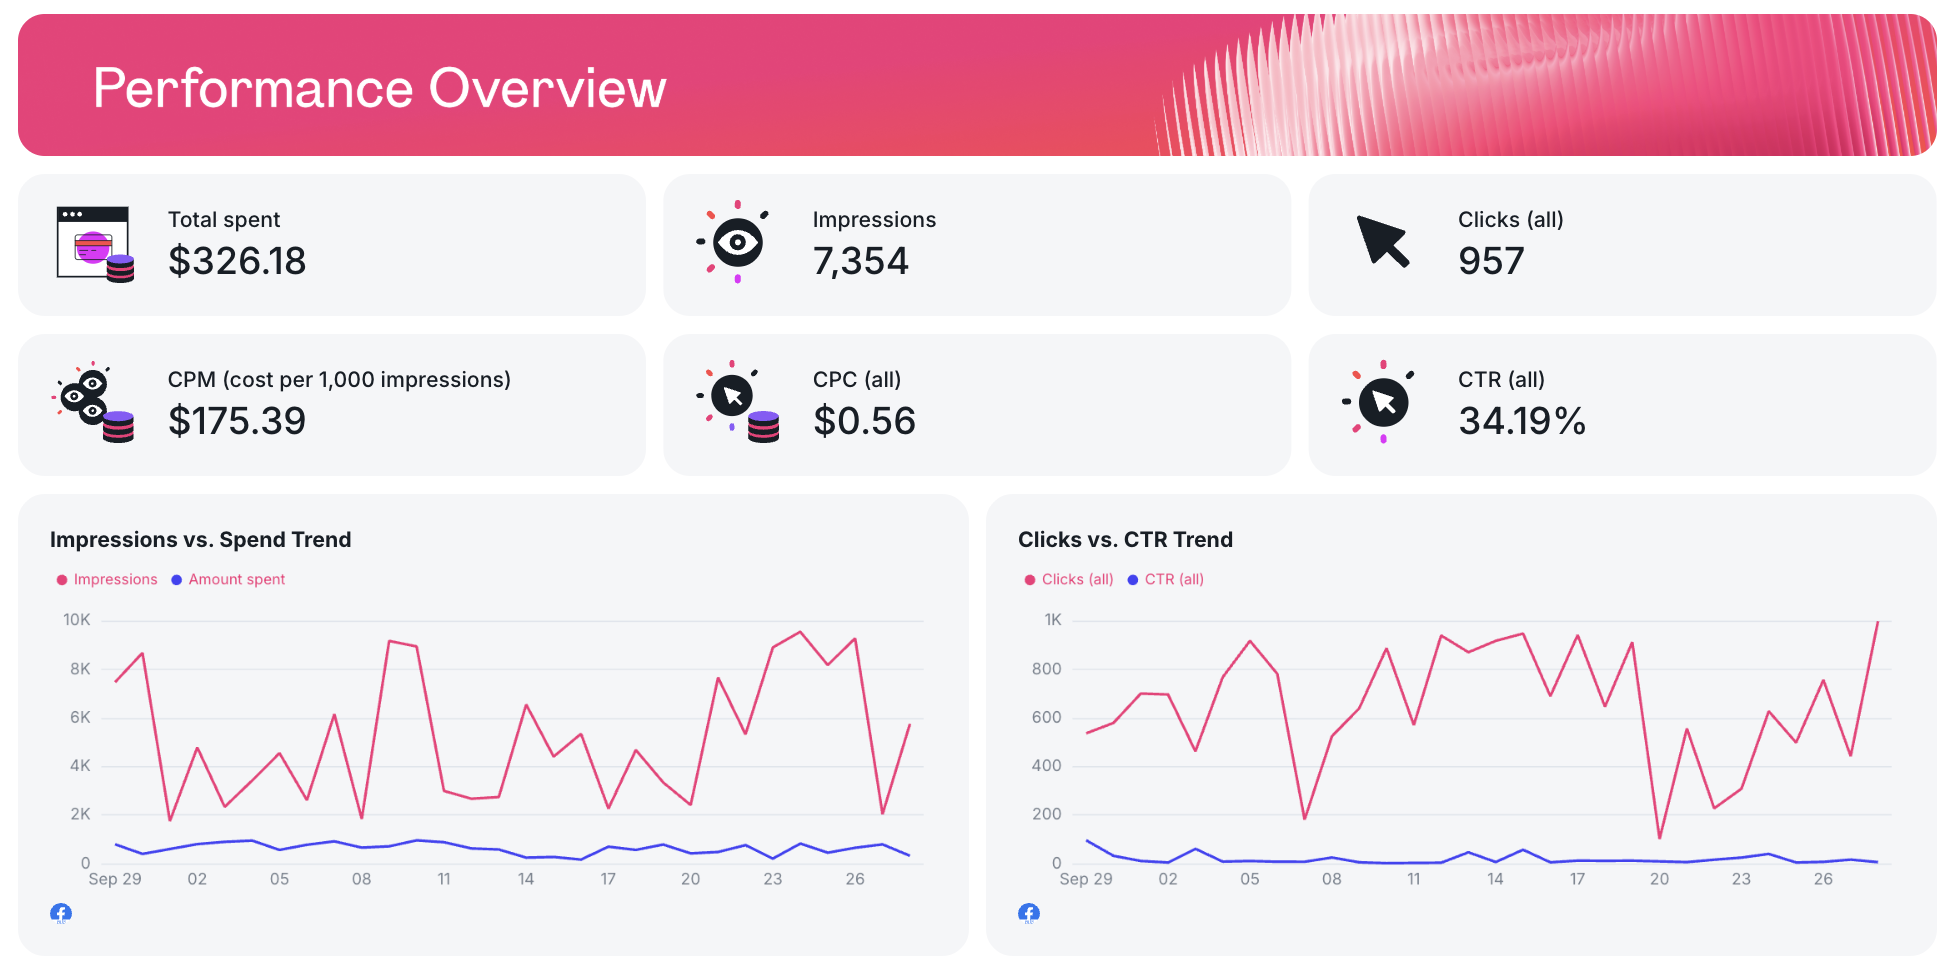
5. Conversion & traffic 

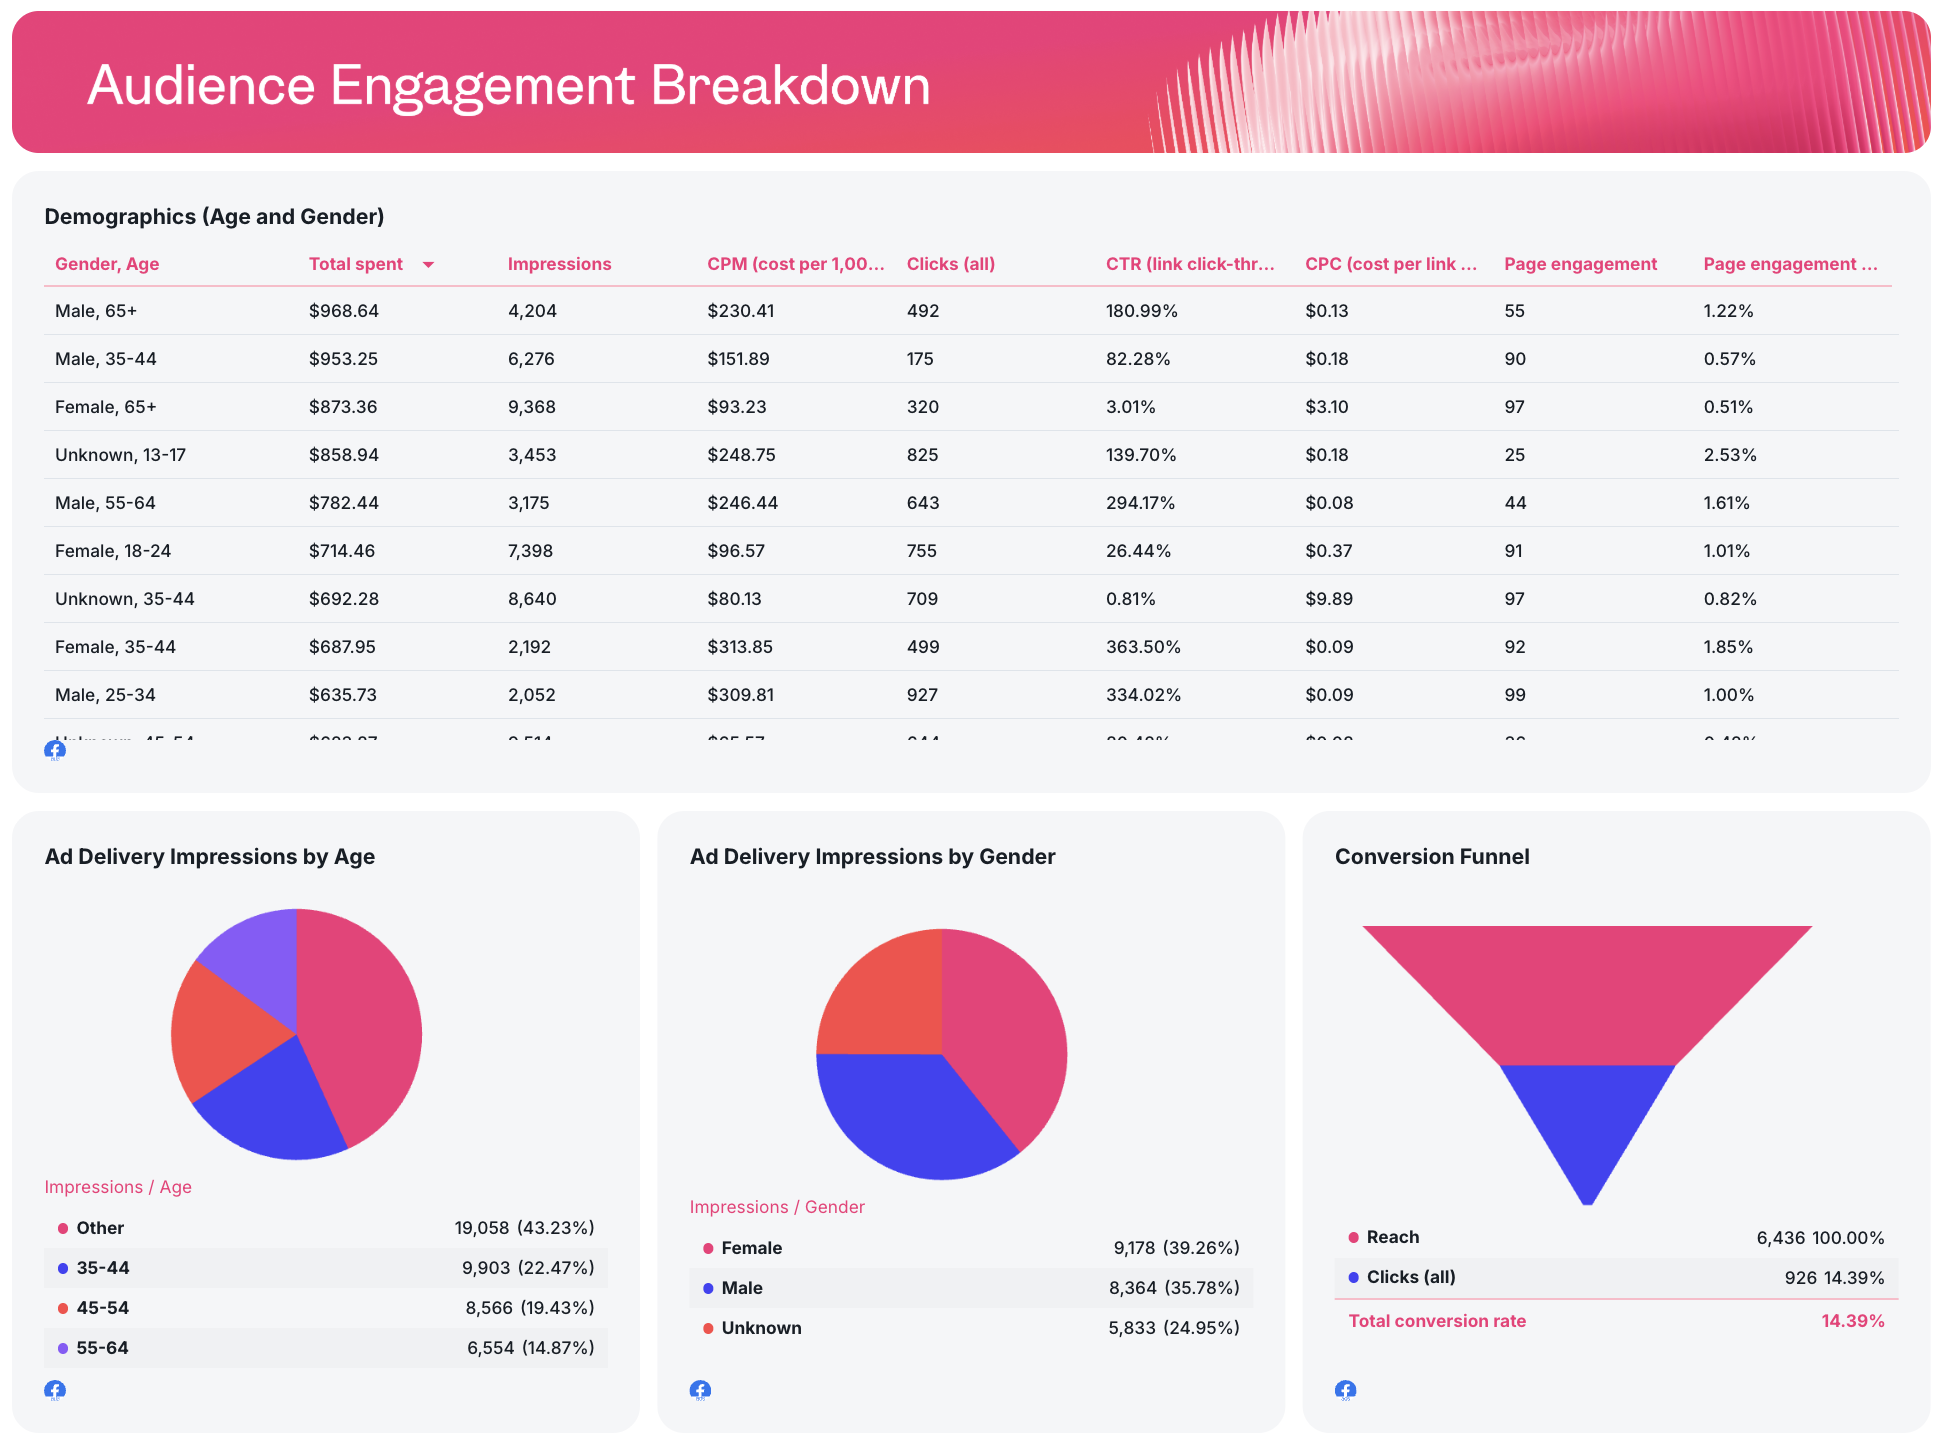
Conversion and traffic charts show key trends over the reporting period. You can use line graphs, bar charts, or pie charts to visualize:

  • Traffic Volume (e.g., total clicks, impressions)
  • Conversion Trends (e.g., monthly or weekly conversions)
  • Conversion Rate (percentage of clicks leading to conversions)
  • Cost Trends (e.g., CPC, CPA over time)

Customer actions and goals - PPC report template

Visualizations help clients understand how traffic and conversions have trended over time and pinpoint any spikes or dips in performance.

6. Insights

You should add the Insights section to go beyond data and highlight what worked well, what didn’t, and why.  

Here are two examples of insights:

Insights - PPC report template

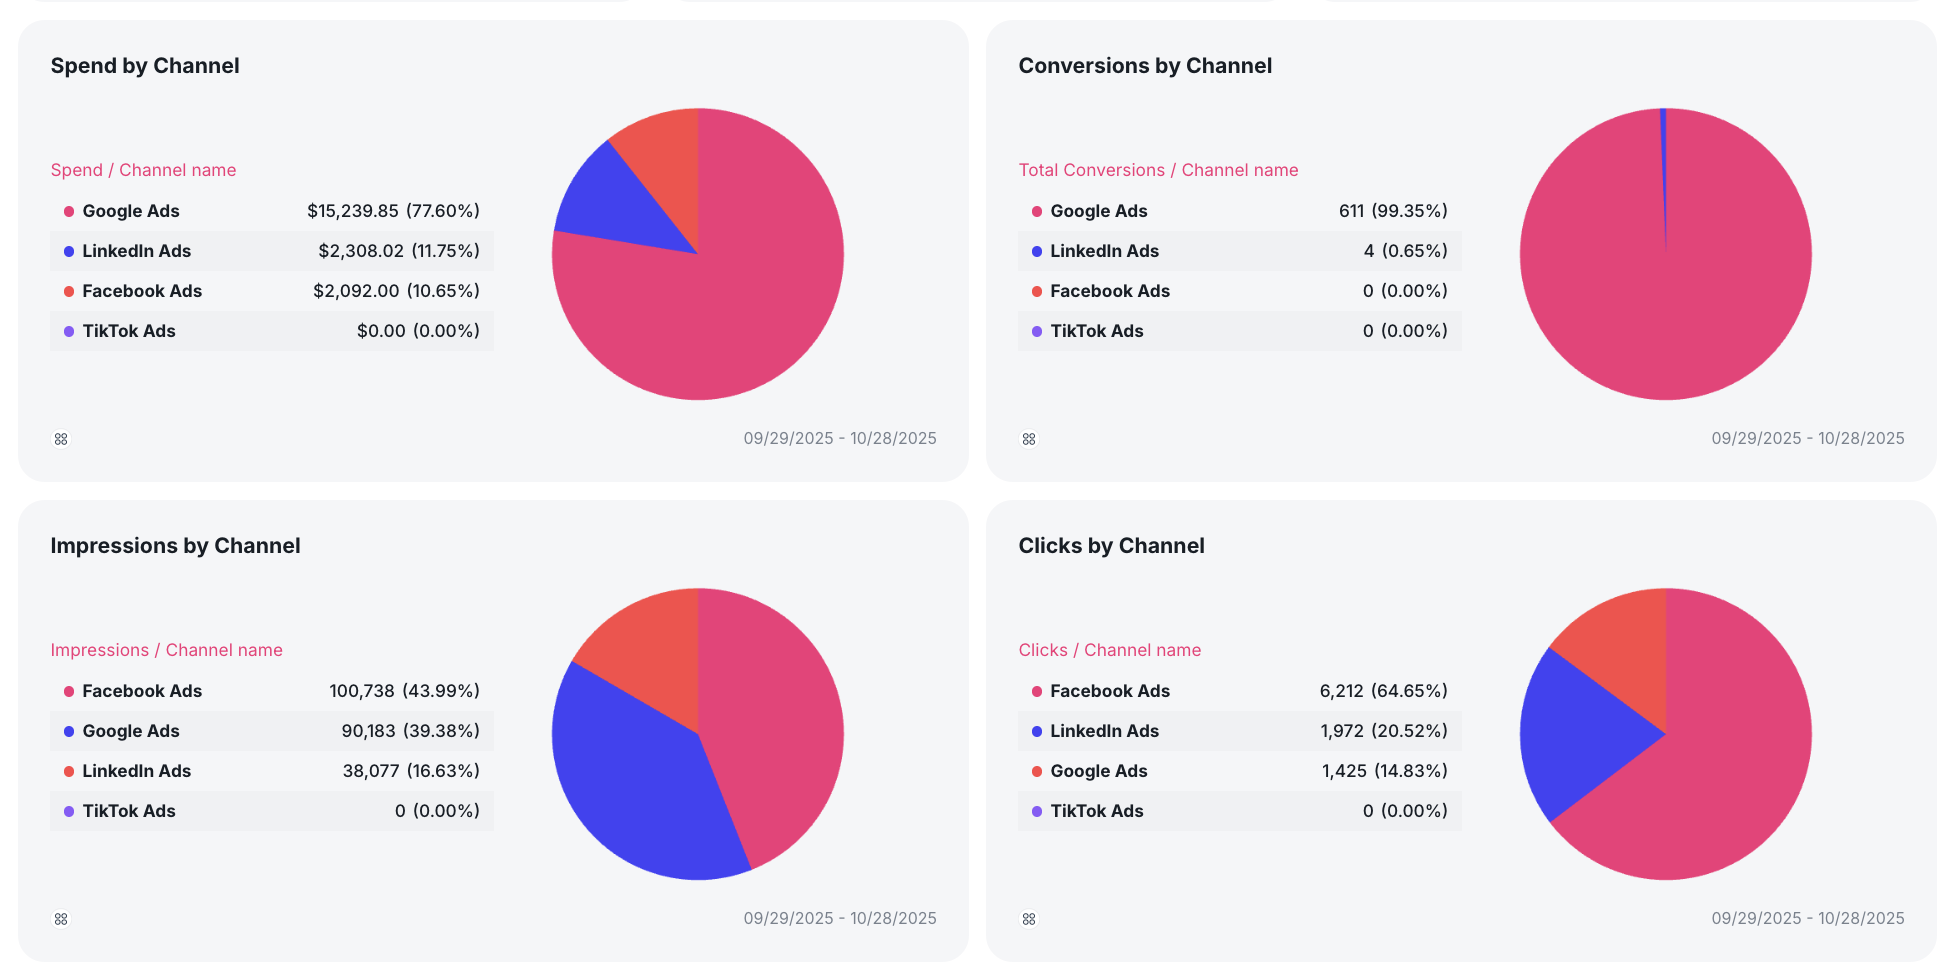
7. Channel split

The Channel split section breaks down performance by different advertising channels, such as:

  • Google Ads
  • Microsoft Ads
  • Facebook Ads
  • LinkedIn Ads

For each channel, include:

  • Time passed
  • Impressions
  • Conversions
  • Clicks
  • Spend

Channel split - PPC report template

This breakdown helps clients see which channels are performing best and where budget adjustments may be needed.

8. Further Actions

In the Further actions section, provide specific recommendations for optimizing future PPC campaigns. These should be your actionable insights based on the data from the report.

Further actions - PPC report template
 

FAQs

All your questions answered. And if you can’t find it here, chat to our friendly team.

What KPIs and metrics to track for PPC?

The specific metric will depend on what you agree with your client. However, these ones are the must-have on every PPC report example:


Clicks: The number of times users clicked on your ad. This shows the initial interest your ad is generating.

Impressions: The number of times your ad was displayed, helping you measure visibility.

Click-Through Rate (CTR): The ratio of clicks to impressions. A higher CTR indicates that your ad is relevant to the audience.

Cost Per Click (CPC): The average amount you pay for each click. Lower CPCs often indicate cost-efficient targeting.

Conversion Rate: The percentage of users who completed a desired action (e.g., purchase, form submission) after clicking your ad. It’s a key indicator of your campaign’s success.

Cost Per Acquisition (CPA): The amount spent to acquire one customer or lead. Keeping CPA low is crucial for profitability.

Return on Ad Spend (ROAS): The revenue generated for every dollar spent on ads. It helps you determine the effectiveness of your spending.

How do I share PPC reports in Whatagraph?

Once you’re happy with your PPC report, you can set up automated report generation at regular intervals (week, month, etc.) so clients can get them without your intervention. 


You can also share reports via a shareable link. 


Whatagraph generates a unique URL that you can send to clients, giving them instant access to the live, up-to-date version of the report.