TEMPLATE
Ecommerce Report Template
Use the template to connect marketing spend to revenue in one clear view
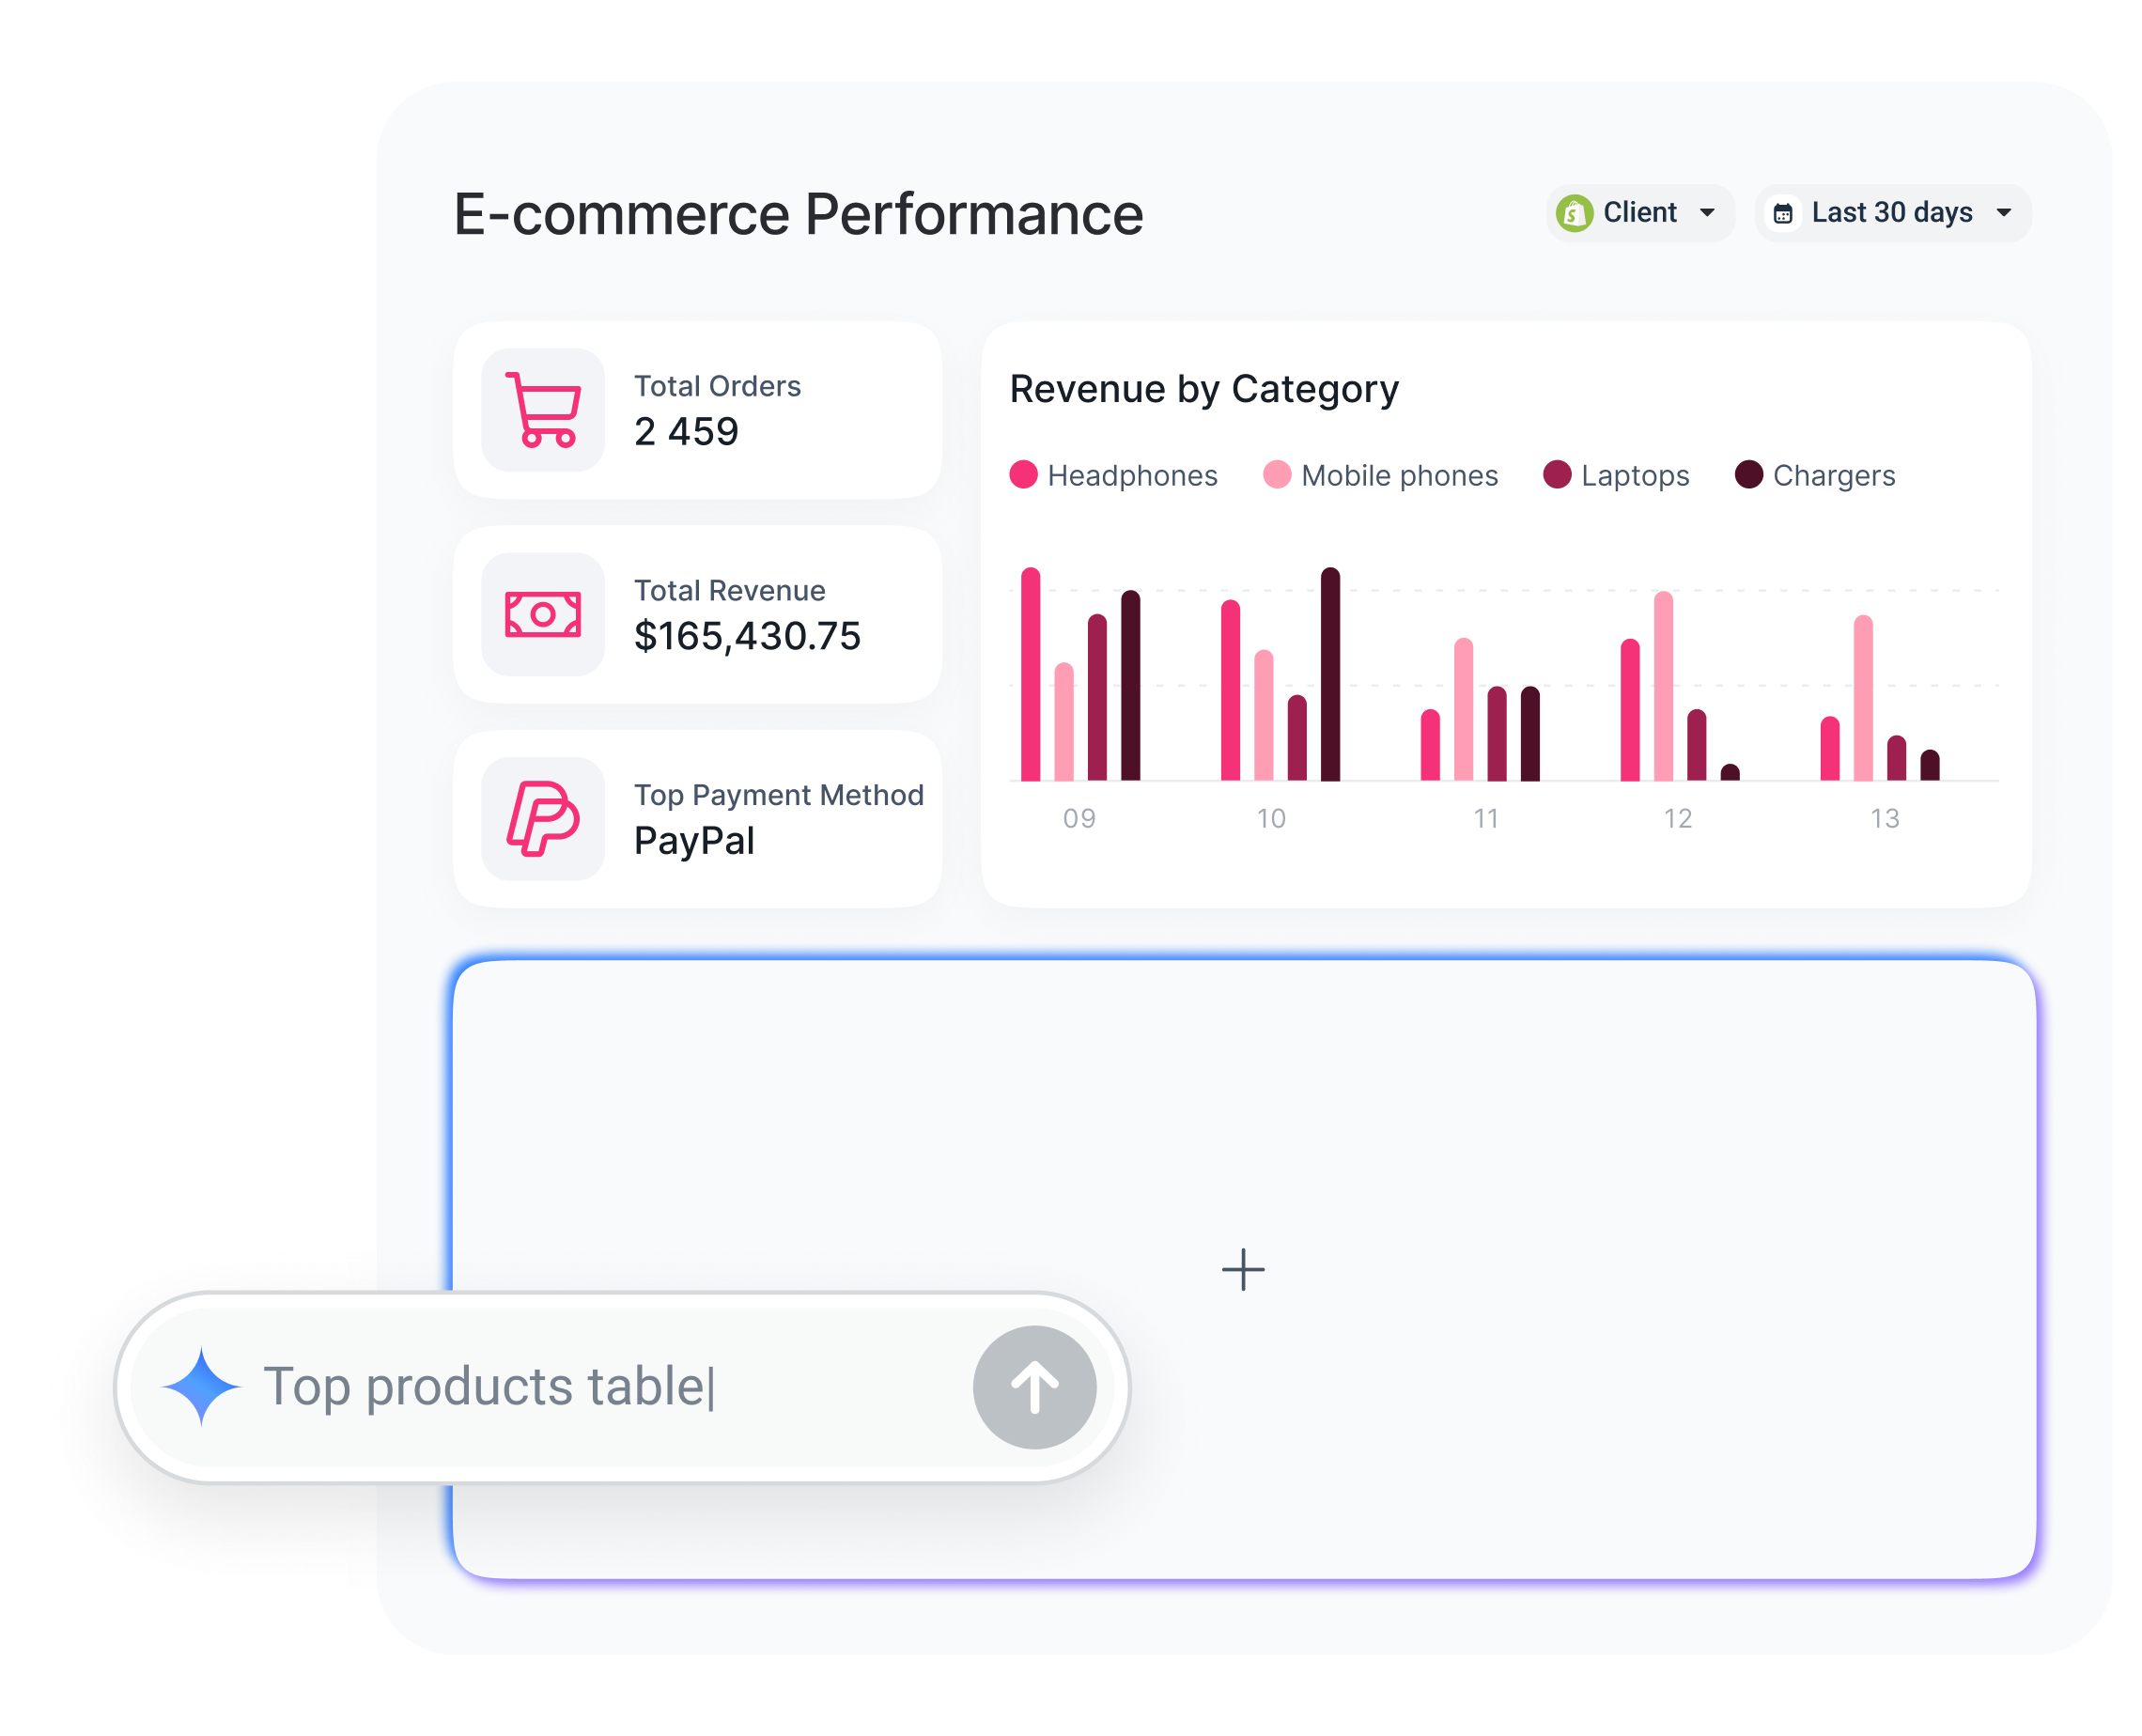


Blend all your ad spend and sales data into one clean view, from Meta to Google to Shopify and beyond. Finally understand true CAC, ROAS, and profit without stitching spreadsheets together.
Understand which products and campaigns drive the most revenue across every channel, so you can focus the spend where it matters. Blend various sources and use custom dimensions to categorize the products and get a clear full picture.
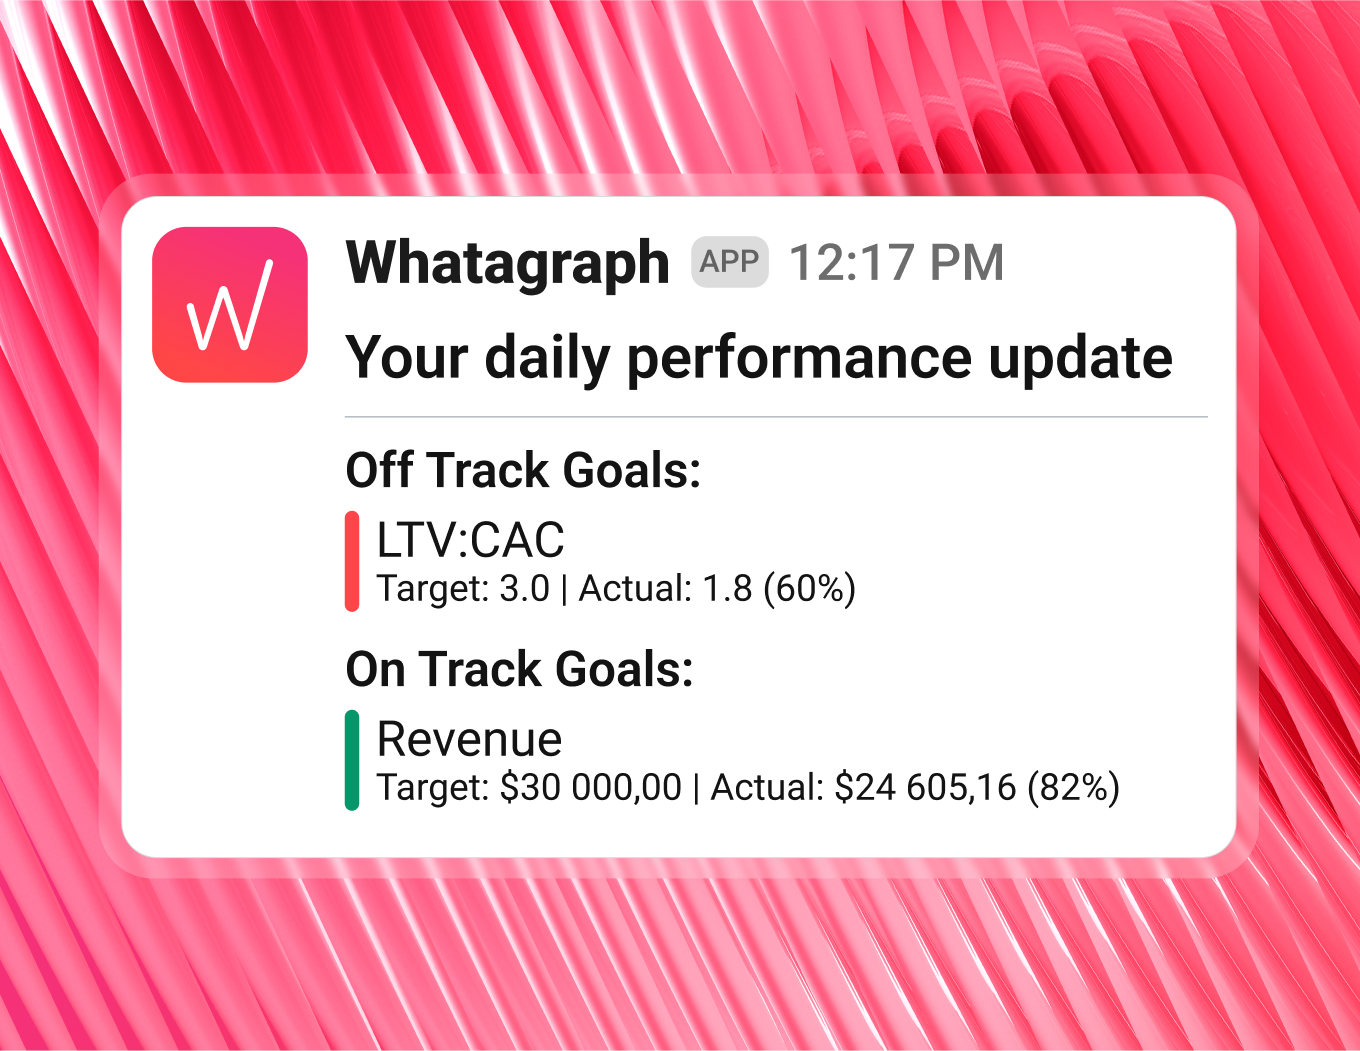
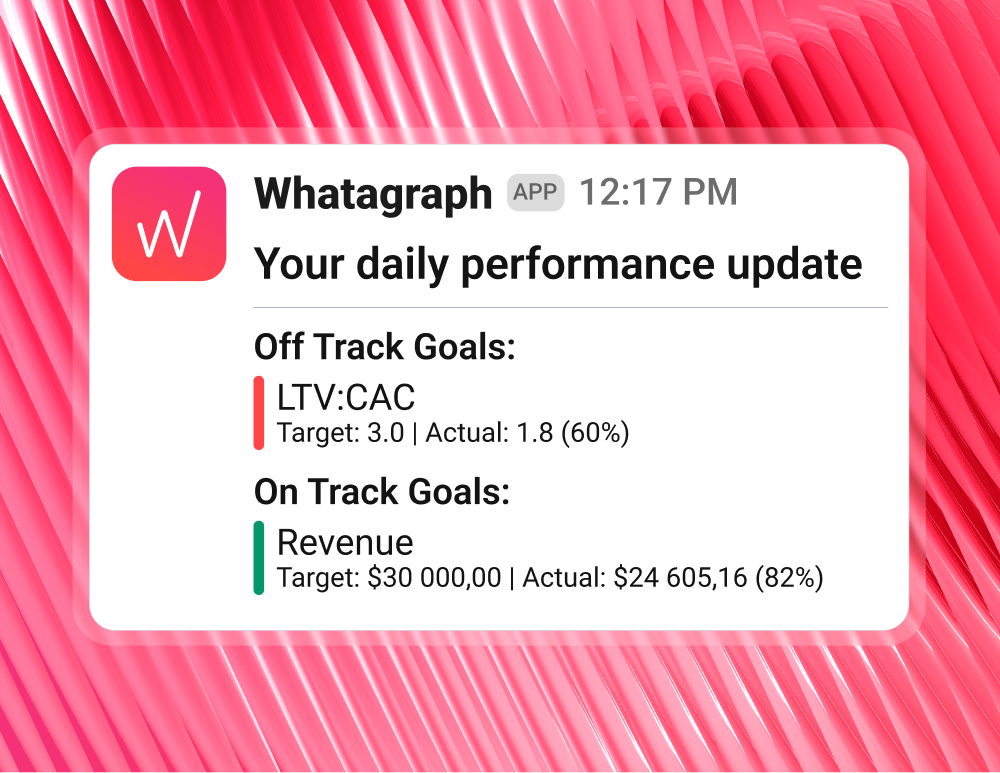
Automatic alerts and clean trend visualizations make it easy to catch product dips before they become major revenue problems.
Measure promotion effectiveness across all paid and organic touchpoints, so you can double down on what works, cut what doesn’t, and deliver clear ROI on every sale or discount event.
Standardize naming with custom dimensions to distinguish between new and returning customers across all channels, so you can fine-tune retention campaigns, optimize acquisition costs, and build sustainable lifetime value.
Stay ahead of holidays, sales periods, and category-specific events. Whatagraph alerts you about the unusual spikes and drops so you can act timely.

Chandhini Shivabalan
Senior Performance Marketing Associate @ Nothing
TEMPLATE
Use the template to connect marketing spend to revenue in one clear view

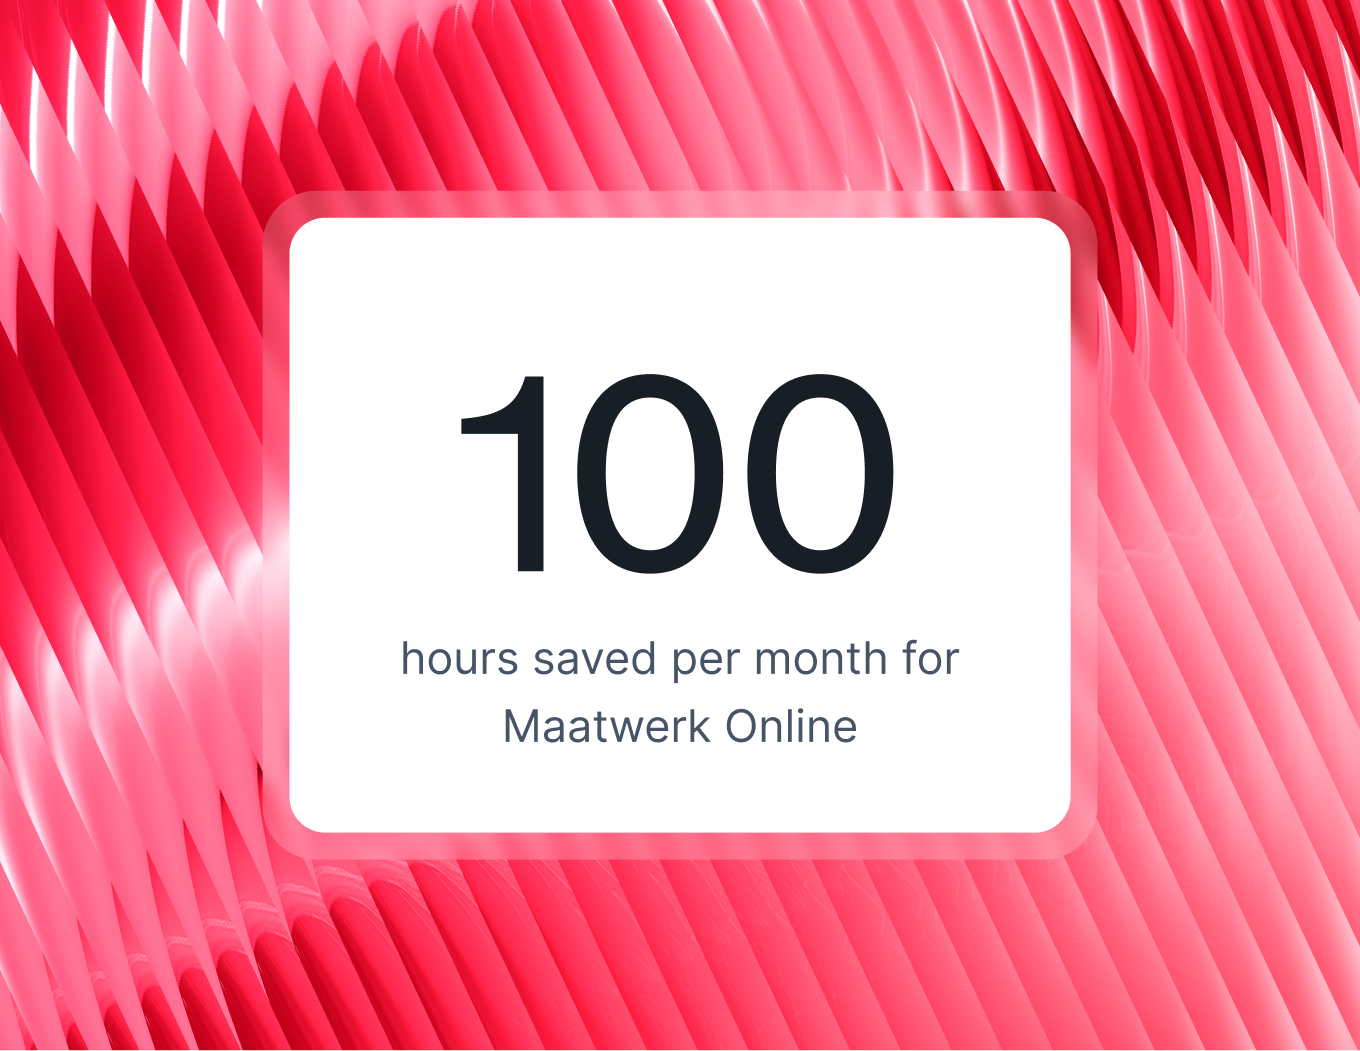
CUSTOMER STORY
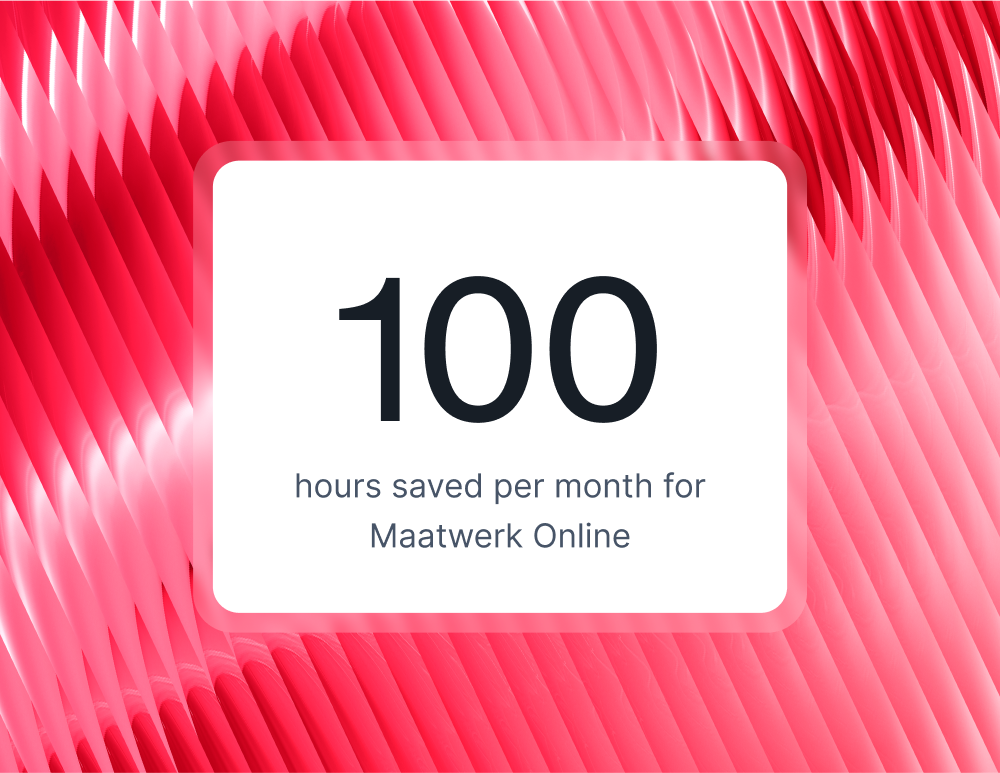
Hear from Mattwerk Online’s CEO on how the team is cutting reporting costs
ARTICLE
Your 2026 shortlist of the best reporting platforms built specifically for ecommerce teams