
Challenges
Outgrowing a reporting tool as the company scaled up
As Director of Implementation and Support at Rentable, Danielle Roberts oversees two critical engines:
- the Implementation team – onboards product and sets up reporting sets up reports for new customers
- the Support team – makes sure reports run smoothly at all times
Together, these teams manage 215 reports across 5,000+ Google Business data sources and thousands of property locations.
At first, their reporting setup worked well. But as Rentable’s customer base grew and reporting needs became more complex, it became clear they needed something more scalable.
“As we scaled, our reporting needs became more complex. We needed a tool that could grow with us and make reporting more efficient,” Danielle told us.
By the end of 2024, the team reached a tipping point: they wanted a solution that could handle large data sets, streamline reporting, and free up time for higher-value work.
As we scaled, our reporting needs became more complex. We needed a tool that could grow with us and make reporting more efficient.
Solution
Phase 1: Choosing Whatagraph
When Danielle began looking for a new solution, she wanted a platform that could scale with Rentable’s rapid growth and simplify complex reporting needs.
On her first product showcase call with Whatagraph, the fit was clear.
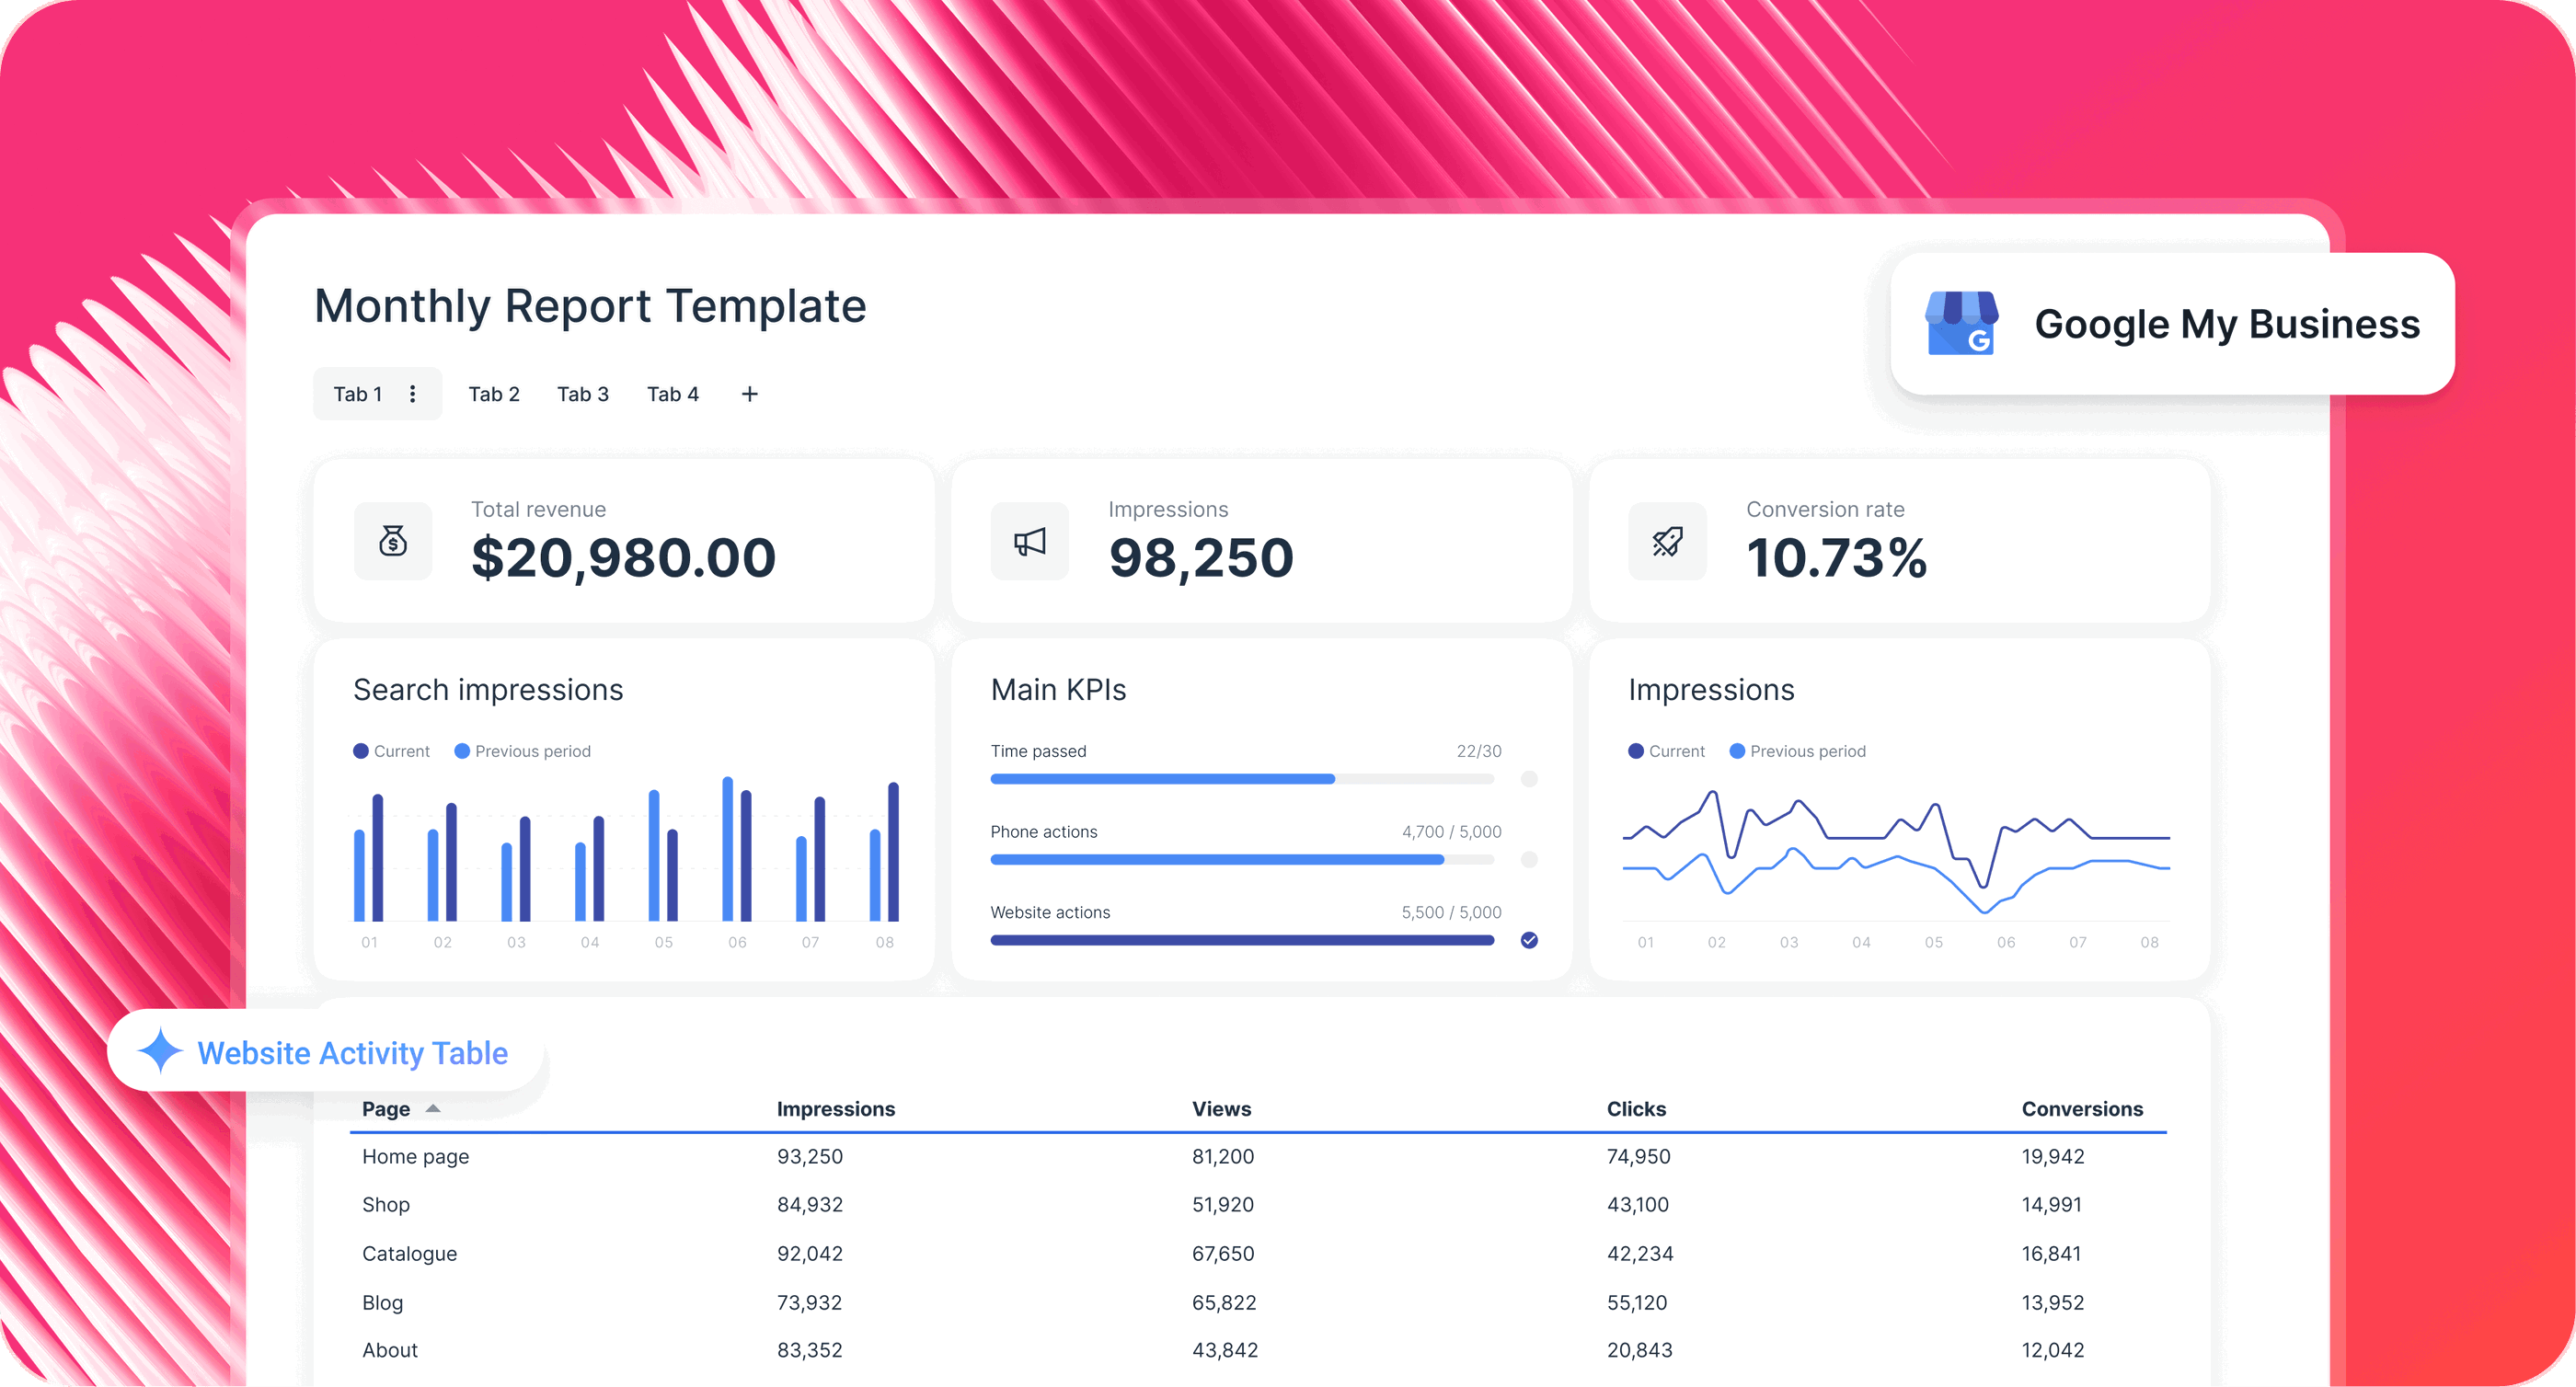
“Initially I was very impressed with Whatagraph,” she said. “The first thing that wowed me was that we could fit all locations and thousands of data points in one report—which is amazing, and what we needed.”
During the product showcase, she was also impressed with:
- Customization options and the ability to change branding colors
- Clean, professional visualizations
- The ability to send a live link to their customers vs. a PDF
Then, Danielle and her teams ran a Proof of Concept for two of their biggest customers and Whatagraph came out on top because of our fast Customer Support.
“We reached out to Whatagraph’s Support and they resolved a hiccup we had on the same day,” Danielle said.
This sold Danielle, and the team started onboarding Whatagraph.
Phase 2: Assisted onboarding and migration
With 215 reports, 5,000+ data sources, and thousands of property locations, Rentable had a huge use-case to build out.
But instead of going it alone, they had support from their dedicated Customer Success Manager, our lovely Misha.
Together, the team migrated the 60 highest-priority customers from the previous reporting tool to Whatagraph and then gradually rolled Whatagraph out the rest of their customer base.
After a few months of running both the old tool and Whatagraph in parallel to ensure the switch was successful, Danielle gave the previous tool their 30-day notice.
Phase 3: Streamlining reporting at scale
To speed up report creation, her Implementation team has built out a library of report templates, usually a full portfolio view or a location-specific version.
When they onboard a new customer, they choose an appropriate report template and switch out the data sources. That means no more rebuilding reports from scratch, and no more unnecessary manual steps.
“We’ve found it’s easier to just use a template and then customize as needed,” Danielle explained.
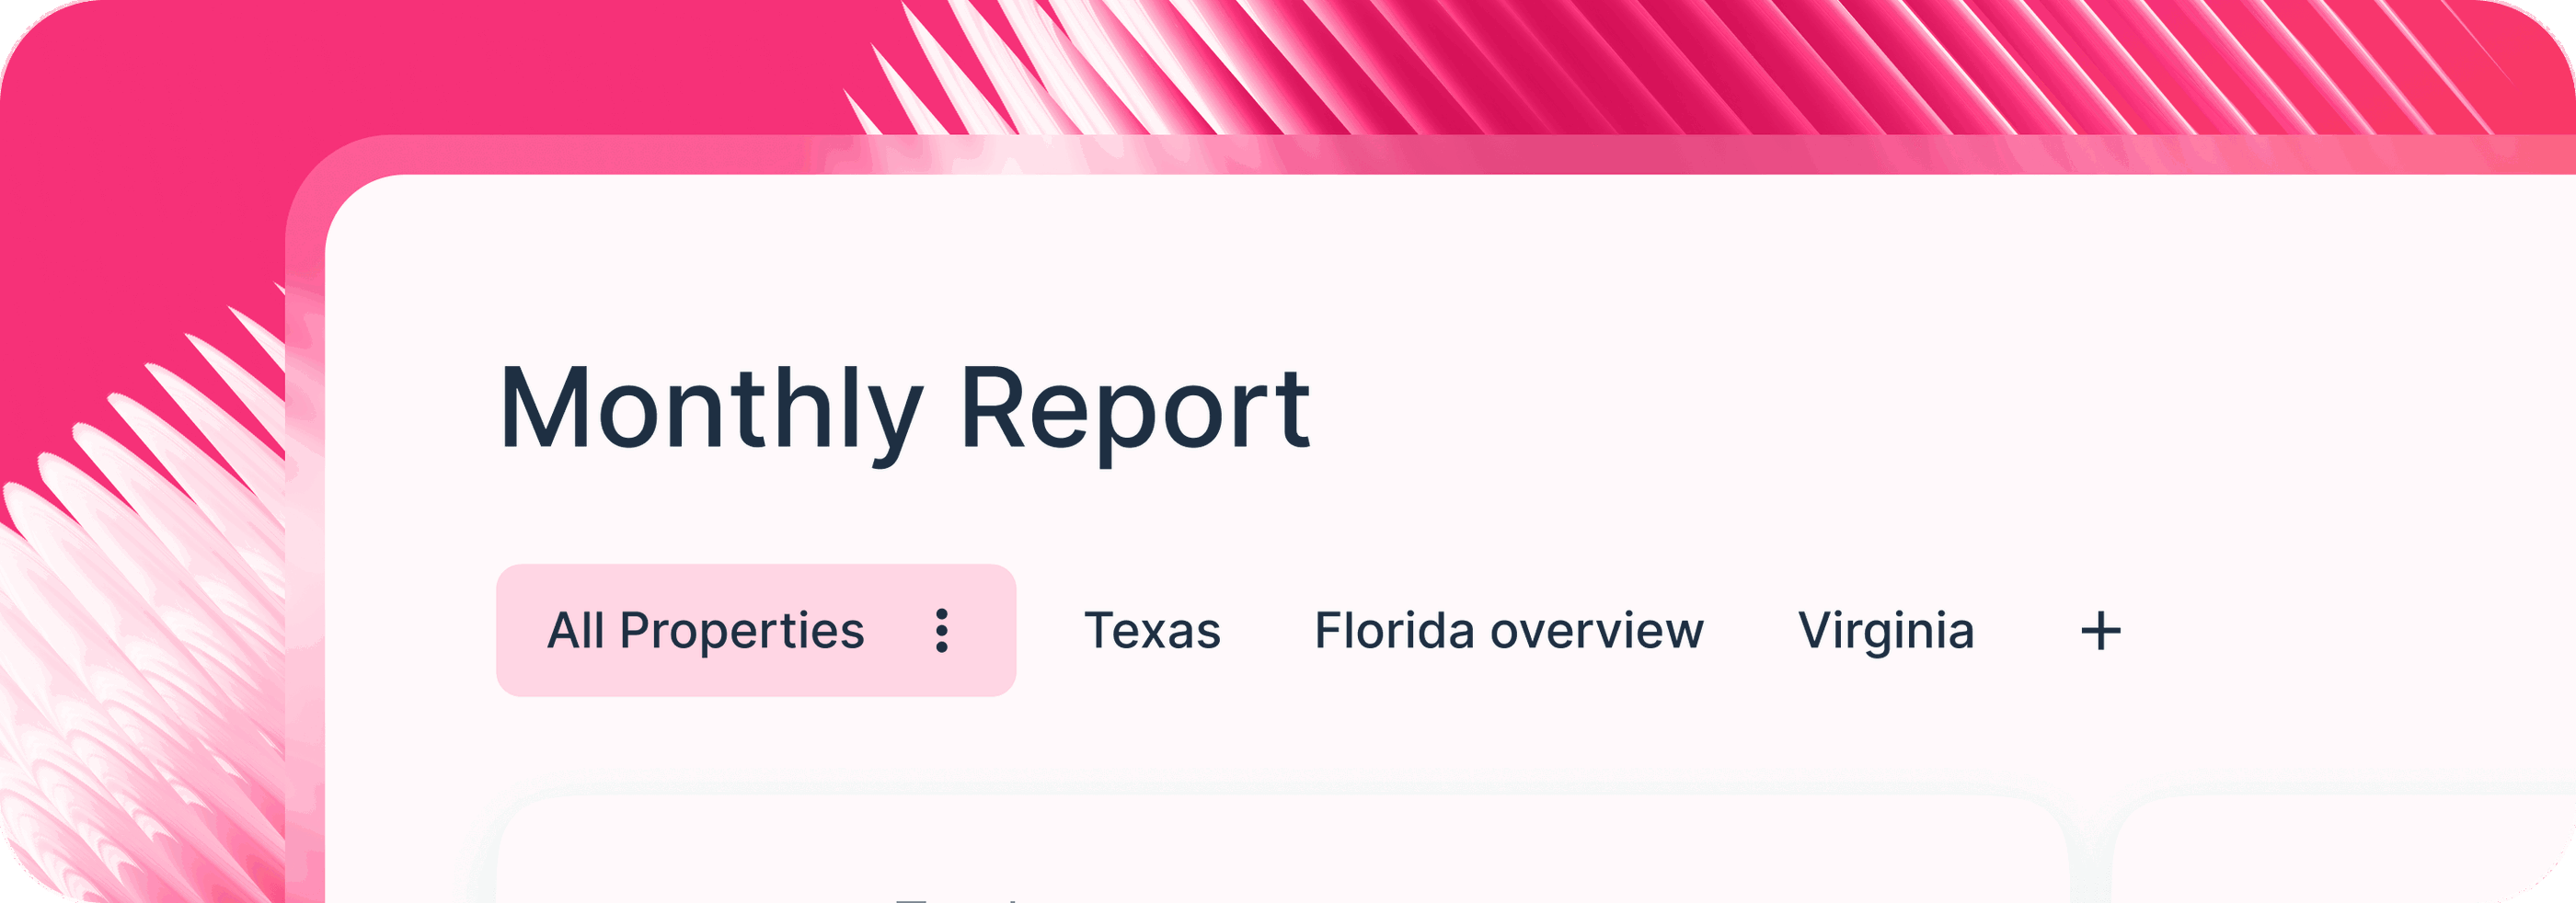
 Within each report, Danielle’s team uses tabs to break down performance by property, state, city, or onboarding date according to the customer's needs.
These tabs make it easy to tailor the experience without duplicating work. For example, if a customer wants to see only properties in Texas or New York City, the team creates tabs that filter by location, while still keeping a full overview in an “All Properties” tab.
“We’ve been breaking it down by things like ‘All Properties’ versus specific states or cities,” Danielle said. “So we can easily give customers exactly what they want to see—all in one report.”
When the reports are ready, the Customer Success Managers go through them with customers in bi-weekly or monthly calls. Customers also love that they get a live link to the reports that they can go in and check performance any time they want.
Phase 4: Testing and implementing AI
Since onboarding Whatagraph, Danielle has started exploring Whatagraph IQ: a suite of AI features to create, style, and extract insights from reports in seconds.
Specifically Danielle has been testing client-facing IQ Chat—Whatagraph’s built-in AI assistant that lets your customers chat with their data directly in the reports you share with them.
For instance, instead of having to scroll through the entire report, the customers can just ask a question like “What is the best performing property in these three categories?” in the chat and get answers instantly.
“The AI Chat cuts down the time our customers have to analyze reports,” Danielle said. “Say I send a report to a customer but they don’t really understand it, they can just ask a question and it spits out answers to them—that’s pretty useful.”
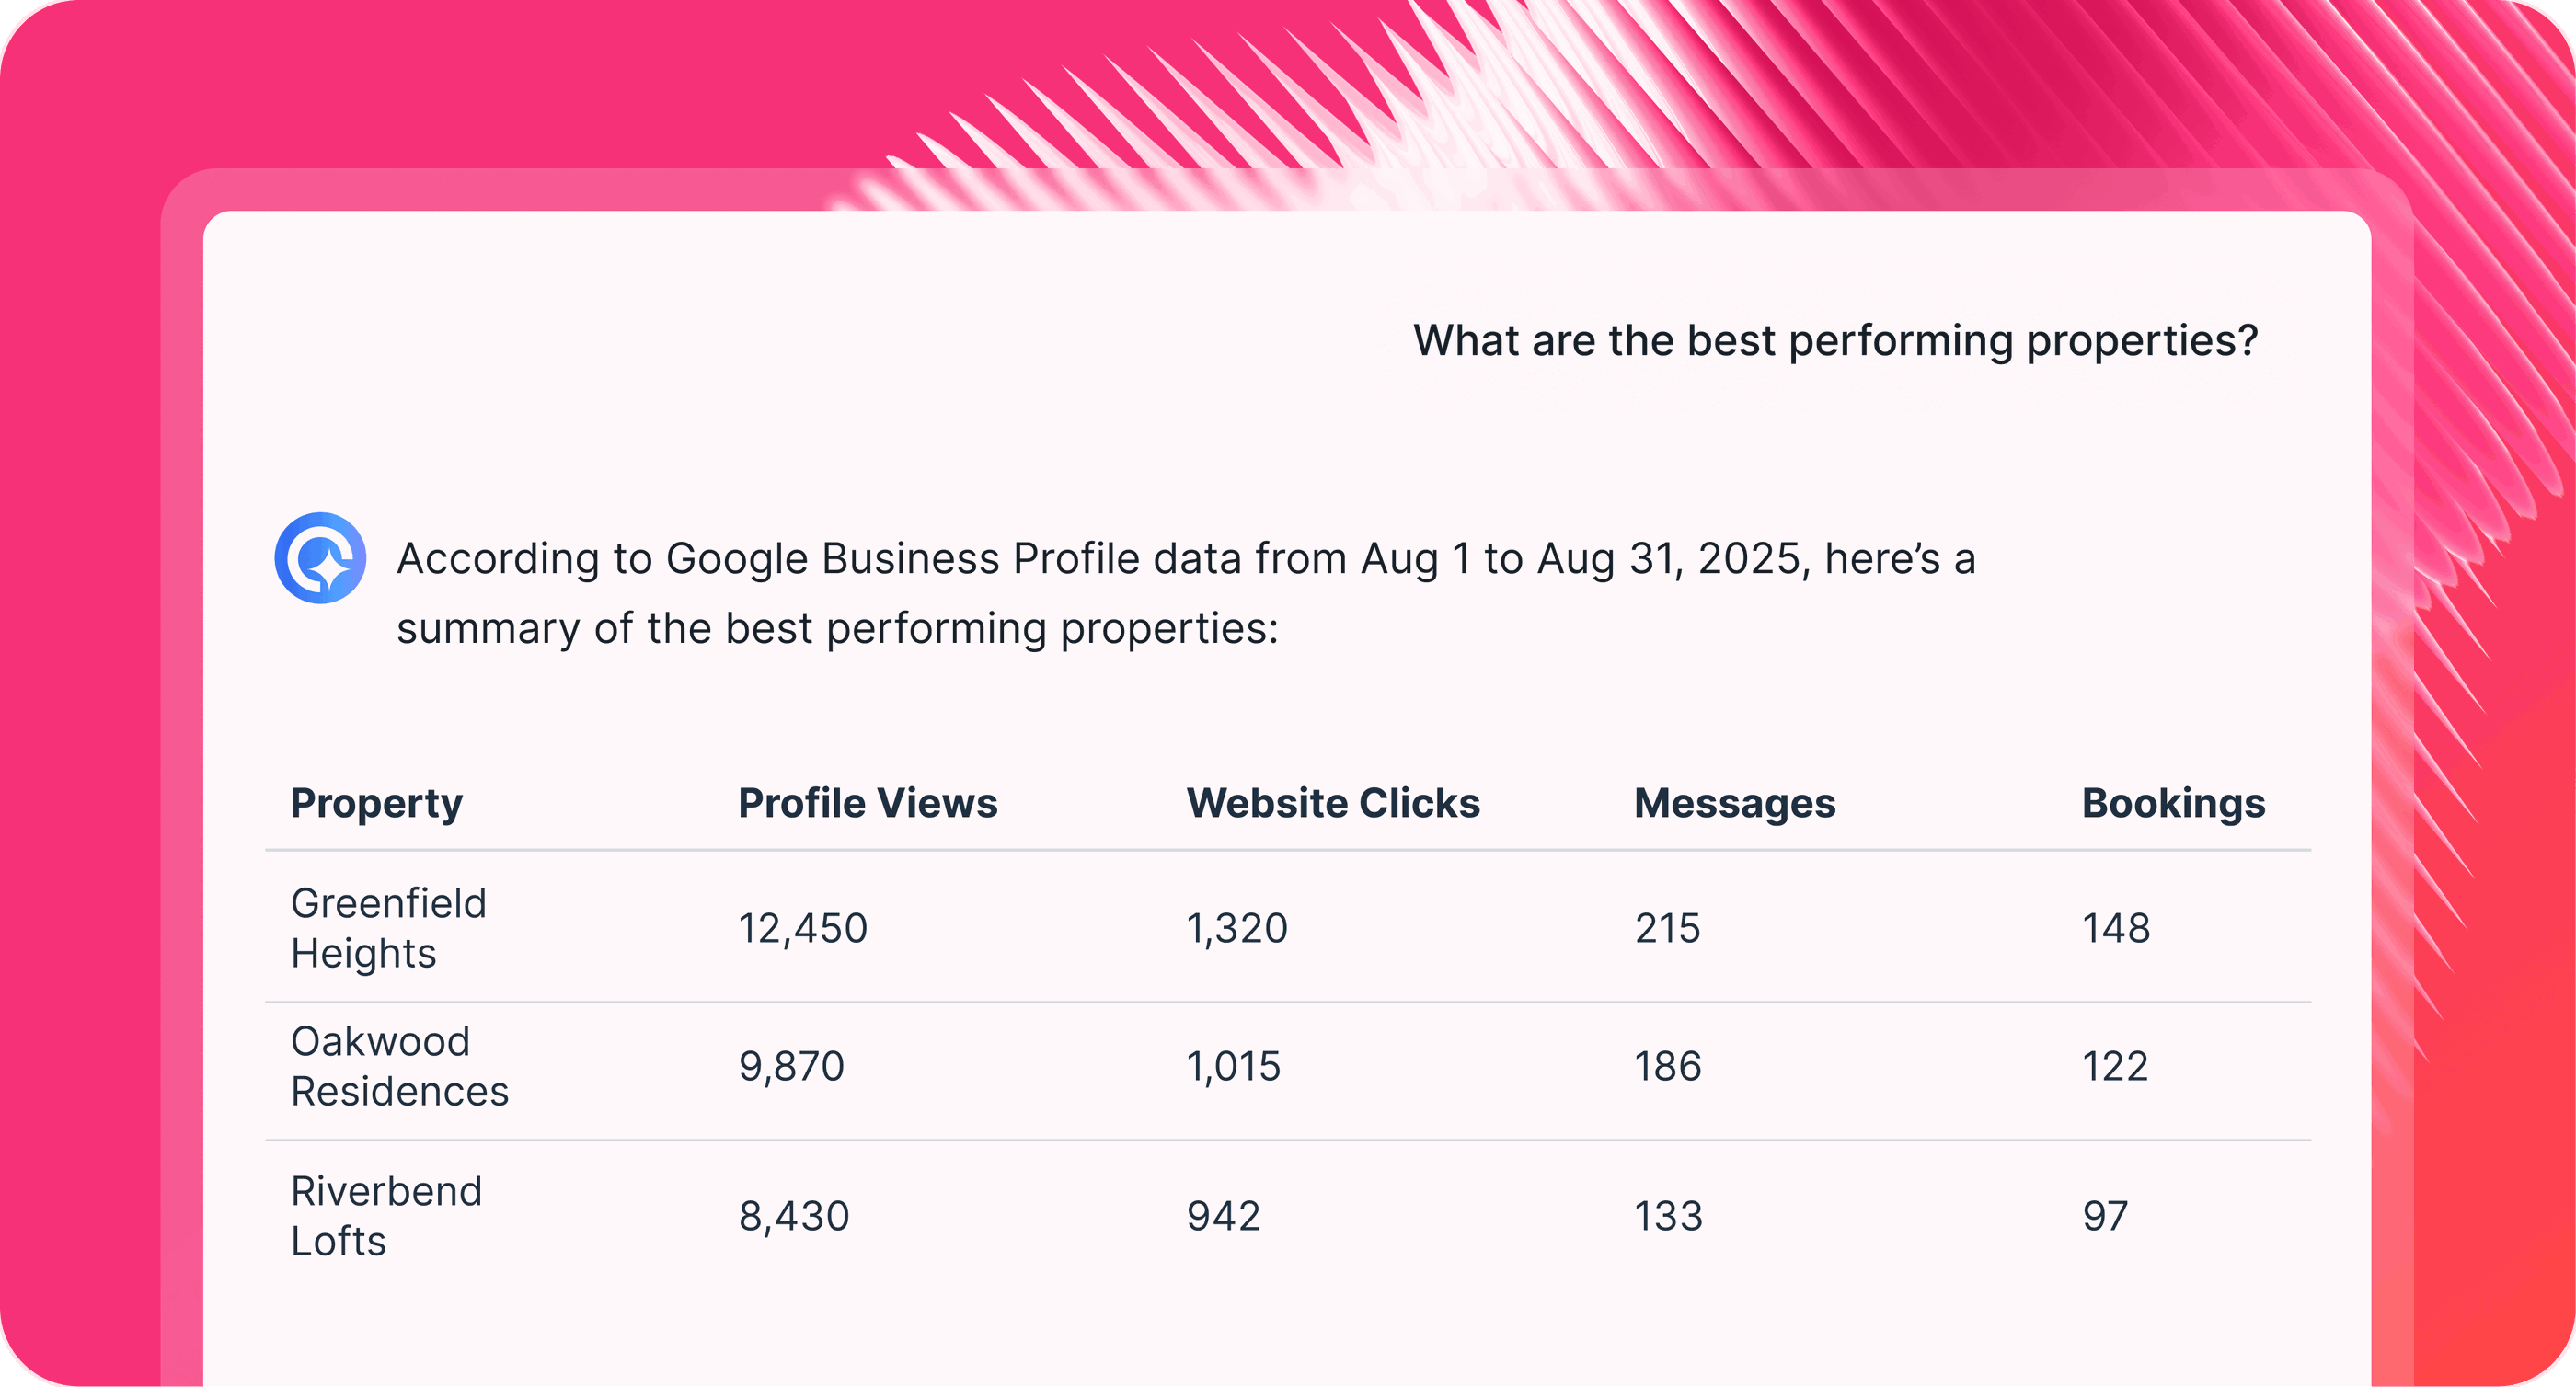
Whatagraph’s AI cuts down the time our customers have to analyze reports. Say I send a report to a customer but they don’t really understand it, they can just ask a question and Whatagraph spits out answers to them right away.
Results
Happier teams, time-saved on reporting
Since switching to Whatagraph, Danielle’s Implementation and Support teams have reported major time savings—and a lot less stress.
It used to take 2 hours to create a report with 200+ locations with the previous reporting tool. But with Whatagraph, this is cut down to 20-30 minutes, translating into 1.5 hours saved per report.
“Whatagraph did the bulk of the onboarding for us, so we haven’t had to build out a report with 200+ locations on it from scratch,” Danielle said. “But even if we need to make adjustments, we’re saving hours per week with Whatagraph.”
With Whatagraph, Danielle’s team finally found a tool that saves them time and frustration every day..
“I’m hearing a lot less complaining from my team, and the functionality is just so much better,” she said.
For Danielle, the biggest win has been both productivity and morale.
“My teams love Whatagraph,” she shared. “They’re saving so much time and I’ve only heard positive feedback since onboarding like… ‘It’s so great. We’re saving so much time. It’s so easy to onboard.’”
Danielle also sees promise in Whatagraph’s AI features, particularly as Rentable explores automation across the business.
“Utilizing AI is a big talking point in our company right now,” she said. “So being able to use that in the software we already work in is really beneficial—saving time for my team and the customers when they’re looking at the reporting.”
Dedicated Customer Success
From the very beginning, Danielle knew her team wasn’t going to be left to figure things out alone.
Whatagraph’s Customer Success Manager, Misha, partnered closely with Rentable during onboarding—and quickly became an essential part of their success.
“We’ve been so impressed with Misha and her help,” Danielle said. “She’s just so knowledgeable. Even if we have a unique use case that you haven’t seen before, she’s able to figure out a solution or a workaround.”
That kind of hands-on support made a big difference, especially with a use case as complex as Rentable’s.
The Rentable team now works with Whatagraph through a dedicated Slack channel, where Misha and other Product team members are always within reach.
“Misha responds within a couple of hours, more or less,” Danielle noted. “And the support team through live chat is very responsive as well.”
She’s even encouraged her own team to use the live chat more now that they’re fully onboarded, but for the more unique, complex requests, the Slack channel remains the go-to.
“Anything we’ve raised a flag for has been addressed promptly and smoothly,” she said. “This wasn’t an easy undertaking for onboarding, and Misha did it so quickly.”
Danielle’s recommendation
When asked if Danielle would recommend Whatagraph to other companies like Rentable, she didn’t hesitate:
“Yes, I would recommend it. Whatagraph has become an essential partner for scaling our reporting. We’d recommend it to any team looking to automate data reporting and use AI for insights.”
My teams love Whatagraph. They’re saving so much time and I’ve only heard positive feedback since onboarding like… ‘It’s so great. We’re saving so much time. It’s so easy to onboard.’