Adform Integration
A fully managed Adform integration pulls data directly from your Adform API to help you demonstrate how your agency is turning your clients’ digital advertising budget into conversions. Blend your Adform source data with other advertising platforms to present a holistic image. Share insights from your marketing data automatically as scheduled emails or live links.


Visualize all your metrics via a direct Adform connector

Pull your campaign performance data directly from your Adform account
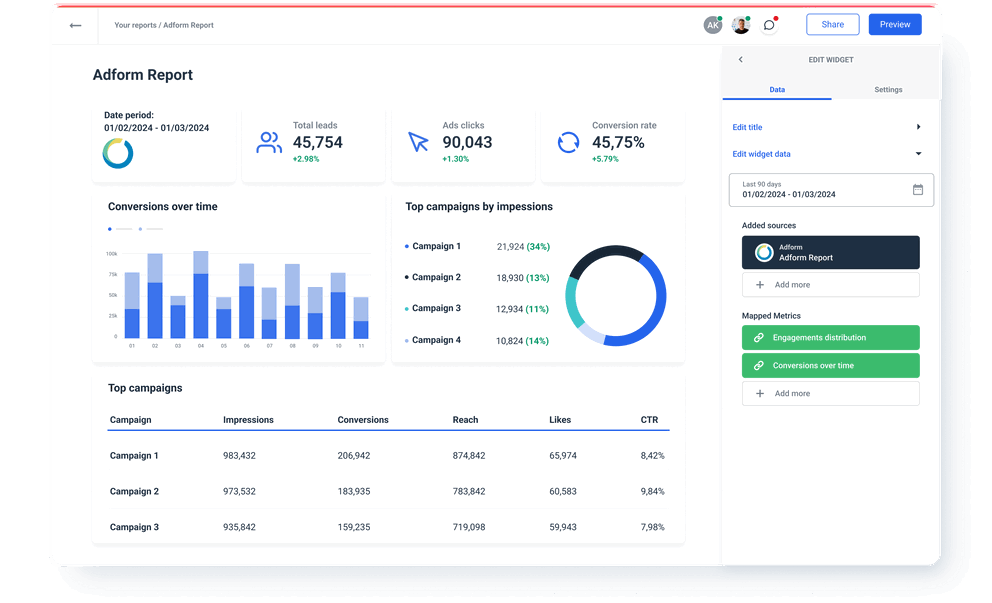
Adform metrics available instantly in Whatagraph
All
Adform
119Search...

eCPC
Cost
Cost (Non-Viewable)
Cost (Post Click)
Cost (Viewable)
Cost/Sales
eCPA (ID Fusion)
eCPA
eCPA (SE)
eCPI
eCPM
eCPM (Viewable)
eCPP
ROI (%)
RTB Media Cost
RTB Adform Included Fee
RTB Rich Media Fee
RTB Trading Desk Fee
RTB Contextual Targeting Cost
RTB Brand Safety Cost
Sales/Cost
SE Avg. CPC
DMP Data Cost (DSP)
DMP Data Cost (Creative)
RTB ID Fusion Cost
DMP ID Fusion Extension Cost
DMP Lookalike Extension Cost
Tracked Ads
Clicks Unique (%)
Impressions Unique (%)
Avg. Frequency
Blocked Impressions
Blocked Impressions (%)
Clicks
CTR (Viewable, %)
CTR (%)
CTR (%) (adjusted)
CTR Unique (%)
RTB Bids
RTB Win Rate (%)
SE Avg. Position
Product Retargeting Item Views
CTR (Product Retargeting item, %)
Impressions (%)
Impressions (ID Fusion)
Clicks (ID Fusion)
CTR (ID Fusion, %)
Avg. Frequency (ID Fusion)
Rendered Impressions
RTB Lost Bids
RTB Loss Rate (%)
Eligible Impressions
Banner Click Interactions
Verified Tracked Ads
Impressions (1st party)
Clicks (1st party)
Avg. Frequency (1st party)
CTR (1st party, %)
Video Completions
Avg. Engagement Time (sec.)
Avg. Expansion Time (sec.)
Avg. Mouse Over Time (sec.)
Avg. Video Play Time (sec.)
Engagement Rate (%)
Engagements
Engaging Impressions
Events
Expansion Rate (%)
Mouse Over Rate (%)
Mouse Overs
Video Completion Rate (%)
Video Events
Video Events (Play Time, %)
Video Start Rate (%)
Video Starts (all)
Video Plays (user initiated)
Delivered Clicks (%)
Delivered Conversions (%)
Delivered Impressions (%)
Overdelivered (%)
Amount
Booked units
Booked Clicks
Booked Conversions
Booked Impressions
Booked Time units
Delivered
Delivered (%)
Delivered Clicks
Delivered Conversions
Delivered Cost (%)
Delivered Impressions
Delivered Time units
Price
Overdelivered units
Overdelivered Clicks
Overdelivered Impressions
Viewable Rate (%) for IAB Viewability
Viewable Rate (%) for Custom Viewability #1
Viewable Rate (%) for Custom Viewability #2
Avg. Brand Exposure Duration (sec.)
Avg. Viewability Time (sec.)
Measurable Impressions
Impression Distribution (Measurable, %)
Viewable Impressions for IAB Viewability
Viewable Impressions for Custom Viewability #1
Viewable Impressions for Custom Viewability #2
Non-Viewable Impressions for IAB Viewability
Non-Viewable Impressions for Custom Viewability #1
Non-Viewable Impressions for Custom Viewability #2
Undetermined Impressions
Impression Distribution (Non-Viewable, %) for IAB viewability
Impression Distribution (Non-Viewable, %) for Custom Viewability #1
Impression Distribution (Non-Viewable, %) for Custom Viewability #2
Impression Distribution (Undetermined, %)
Impression Distribution (Viewable, %) for IAB viewability
Impression Distribution (Viewable, %) for Custom Viewability #1
Impression Distribution (Viewable, %) for Custom Viewability #2
Measurable Rate (%)
Check out related integrations:


Explore marketing automation and custom report features


Frequently Asked Questions
What is Adform used for?
Adform is a media buying platform that allows advertisers, publishers, and agencies to create, buy, and sell digital advertising at scale across a range of internet-connected devices. The Adform FLOW technology uses augmented intelligence to allow users seamless management over the whole campaign life cycle across all digital media channels. Adform is a data management platform that not only grants campaign managers full ownership of the data but also ensures seamless integration across various channels.
How to connect Adform data to Whatagraph?
Whatagraph has a pre-built Adform connector, so you don’t have to purchase and configure third-party data connectors, as you’d do with Looker Studio and many other marketing analytics solutions. Adding a new Adform source is simple:
1. Go to the Data Sources menu and locate Adform among the channels
2. Click Connect an account
3. Give your Adform account a name and choose a currency for the dashboards
4. From there, you’ll be redirected to login to your Adform account
5. All done. Create a custom report or dashboard and add your Adform account as a source
Once you connect Adform data to Whatagraph, you can organize datasets to get more granular insights by device, campaign ID, date, etc. You can visualize data in various widgets and share the insights via automated email attachments or live links for near real-time access.
Is Adform a DSP?
Adform is a DSP (Demand Side Platform) that allows you to reach your desired audience with highly intelligent targeting using formats of choice and advanced algorithms across a wide range of media.
What does Ad Server do?
The Adform Ad Server provides enhanced connectivity across the entire life cycle of your campaigns for better insights, superior control, and improved creative capabilities.
What others think about Whatagraph
I made a switch from GDS and Sheets for reporting to Whatagraph, and I am saving literal hours each week on performance report creation. Our small firm actually managed to onboard 2 new clients as a result of all the time we saved on managing data and reporting. The customer service is also really helpful and easy to reach.

Capterra verified review by
Mindaugas S., Marketing Consultant
Having active customer support to help fix any issues was a big contributor, but we also really liked the ability to save templates and connect sources to multiple charts/widgets at once without having to edit them individually. And having the grid layout is much easier to stay consistent with than the free form setup that Data Studio has.

Capterra verified review by
Nico T., Media Planner
The system has standard templates that are easy and fast to use. Also you can build your own report with lightning speed. It is very easy to use, has a lot of integration, and let get started very fast.

Capterra verified review by
Rasmus Bernt K., External Senior Management Consultant
We love Whatagraph - we would definitely recommend and our account manager is great! I love how easy this tool is to use, everyone on the team finds it much more user-friendly than other dashboards. Integration was easy, we sent some example reports to the team who duplicated these for us. We literally had to log in and send it to our clients!

Capterra verified review by
Stephanie S., Digital Director
We are showing our clients the work that we're doing for them and this is incredibly important for our clients ROI. They want to see results and having a tool like Whatagraph that can show data from virtually every source we use is hugely important.

Capterra verified review by
John S., SEO Strategist
The tool is easy to use; you do not need to have development resources. Even my junior project managers are capable of making campaign reports in minutes. There are a lot of pre-made templates you can use as well as many pre-made widgets.

Capterra verified review by
Erman E., Marketing Specialist
Really easy to connect data sources within the tool. The library of report templates has been helpful. The customer support team has been responsive to all of our needs. Our team enjoys the simplicity of setting up the reports and how the data is presented.

Capterra verified review by
Brent N., Director of Operations
Easy to create really beautiful graphs and reports which can help other team members to understand the most important takeaways. I especially like the automated report function, so I don't have to check on the same thing repeatedly.

Capterra verified review by
Orsolya S., Online Marketing Manager