Discover a Powerful ReportGarden Alternative
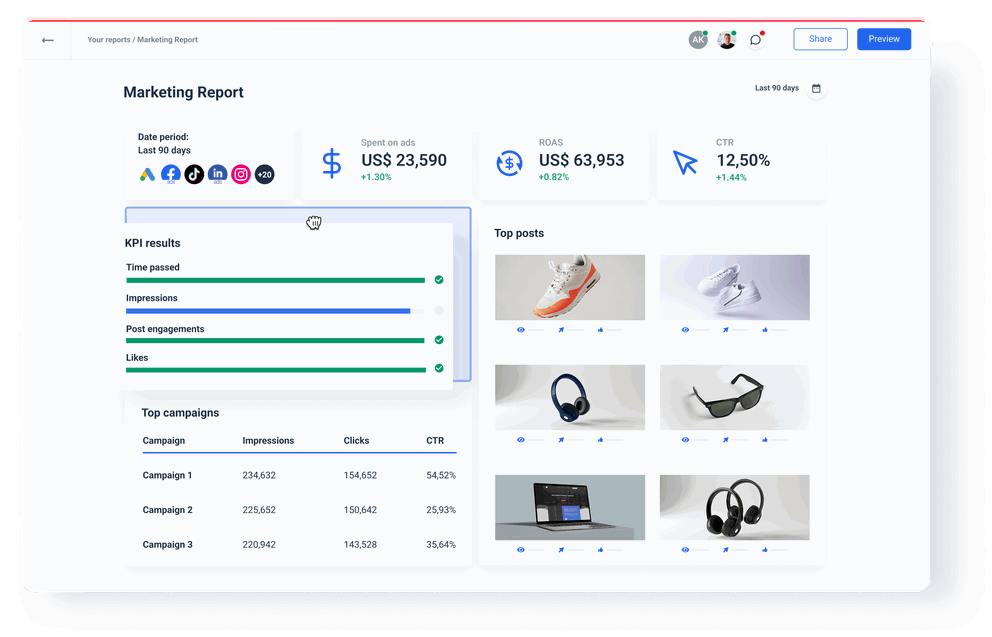
Whatagraph offers an all-inclusive platform to connect, organize, visualize, and share your marketing data, with excellent support and automation features. An easy-to-use ReportGarden alternative with a simple drag-and-drop dashboard builder, with pre-made widgets, and a ton of customization features. Share live dashboard links so your clients and stakeholders can explore data on their side.
- Live chat customer support
- 55+ marketing channels
- Built-in integrations


3 Reasons to Choose Whatagraph as Your ReportGarden Alternative
Organize data before visualizing it
Whatagraph allows you to get insights faster and provide more engaging and clear reporting to clients or stakeholders. Using Whatagraph, you can unify, rename, and translate data outputs at scale, aggregate data to create tiers or totals, and blend cross-channel data into one source.
Get tasks done faster
With Whatagraph, you can link any number of reports to a template and edit them at once. Save and reuse almost anything as a template, down to a single calculation or a filter. Create cross-channel overviews with key metrics to track reaching targets or limits.
Intuitive out-of-the-box solution
Whatagraph will increase the efficiency and quality of your reporting through its ease of use, great UX/UI, and seamless experience. You can work with data connection, custom metrics, and sharing without leaving the report-building environment.
A One-stop Shop Alternative to ReportGarden
No additional tools. No extra payments. A single platform for all your marketing reporting marketing reporting needs with timesaving features to manage tons of data and execute cross-channel monitoring.
 | ||
|---|---|---|
| Connect | ||
| Native integrations with all popular marketing sources | ||
| All integrations available in all plans | ||
| Data warehouse as a source | ||
| Custom API | ||
| Organize | ||
| Custom formulas/metrics | ||
| Advanced data organization capabilities | ||
| Make your reports easier to read and analyze, get insights faster | ||
| Data blending | ||
| Combining data from multiple channels to use as a single source | ||
| Aggregate data from various sources | ||
| Unify and group cross-channel data | ||
| Visualize | ||
| Data visualization | ||
| Pre-made widgets configured out of the box for different integrations for you to drag and drop | ||
| Media widgets display ad creatives with relevant metrics in one click | ||
| Linked templates | ||
| Cross-channel Overviews | ||
| User-friendly UI | ||
| Share | ||
| Sharing PDF, sending out report emails | ||
| Live links to dashboards | ||
| Data export in spreadsheet format | ||
| Data transfer to a warehouse | ||
| Support | ||
| Live chat support | ||
ReportGarden Pros and Cons – What Do Users Say?
We have been using this tool in our marketing department, and we are really happy with it. It helps us easily create reports for our online and social media campaigns. The user interface of this tool is excellent, and we can even download the PDF reports and send them to our higher management.
The GMB widgets usually can show data for the last 18 months. If someone wants older data it has to be added manually. Also I would prefer if they could offer more variety in table colours.
It pulls in data from everywhere you need it to – Search Console, Analytics, Google Ads, Facebook, etc.
The only thing we dislike about the software is that the reports page can get very messy if you have weekly campaign reports being sent out, the previous weeks campaigns do not get deleted but they just continue to generate new reports in the report list.
I love the customer support. They can take a little to get back but have been able to resolve every question or issue I have raised. I believe they would benefit immensely from a live chat.
Frequently Asked Questions
Is Whatagraph a good ReportGarden alternative?
Yes, Whatagraph is one of the best alternatives to ReportGarden, for several reasons:
1. First, unlike ReportGarden, Whatagraph is an all-in-one digital marketing platform, which means you don’t need to use any other tools to connect, organize, visualize, and share your data, as Whatagraph does it all.
2. Second, ReportGarden doesn’t allow you to batch-edit the reports you’ve created and saved. Whatagraph has this feature, which significantly speeds up the updating process, as well as eliminates the possibility of human error, especially if you have hundreds of reports for different clients.
3. Whatagraph allows you to blend, aggregate, and unify your data, through its Organize feature, while ReportGarden has very basic custom formula functions.
4. Also, Whatagraph has a custom API so you can directly connect sources that are currently not included in the native integrations.
5. Whatagraph has a no-code data transfer enabled, so you can easily schedule data transfers to your Google BigQuery data warehouse.
6. Finally, Whatagraph allows you to export data as CSV files or Excel spreadsheets, in case you want to use it in another business intelligence tool.
How does ReportGarden pricing work?
ReportGarden has four pricing plans based on the number of sources and users. However, the ReportGarden pricing page has a comparison table showing that the number of integrations increases with the plan, with only the custom plan having access to all integrations. With Whatagraph, all integrations are available from the basic pricing plan onwards.
What does ReportGerden do?
The ReportGarden product details from GetApp describe it as a “reporting and dashboard platform that helps small to large online ad agencies create analysis and performance reports for clients.” It’s more of a reporting tool than an all-in-one marketing data platform, like Whatagraph, that combines data management and reporting roles.


