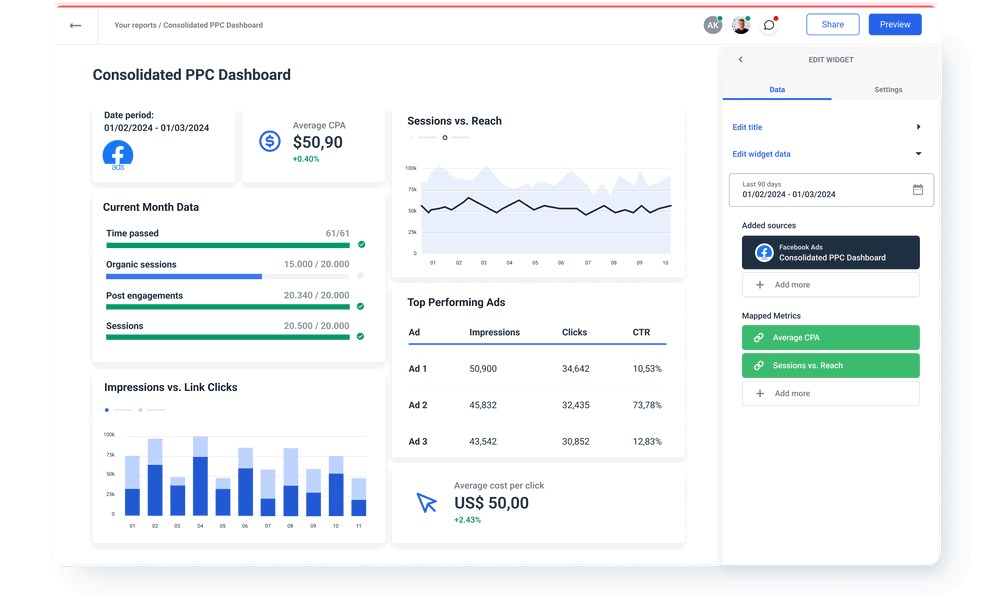
Facebook Ads Integration
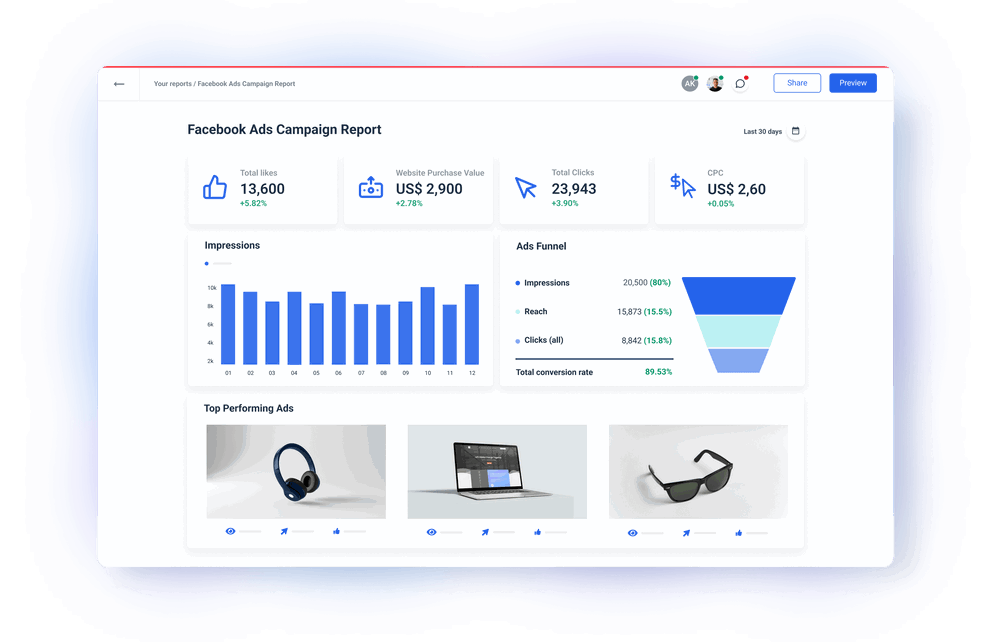
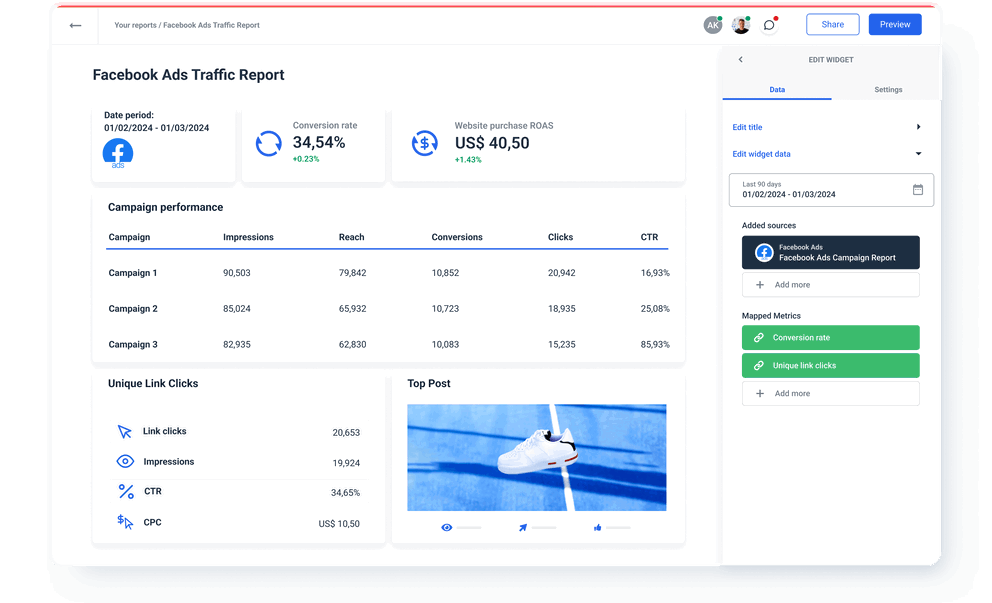
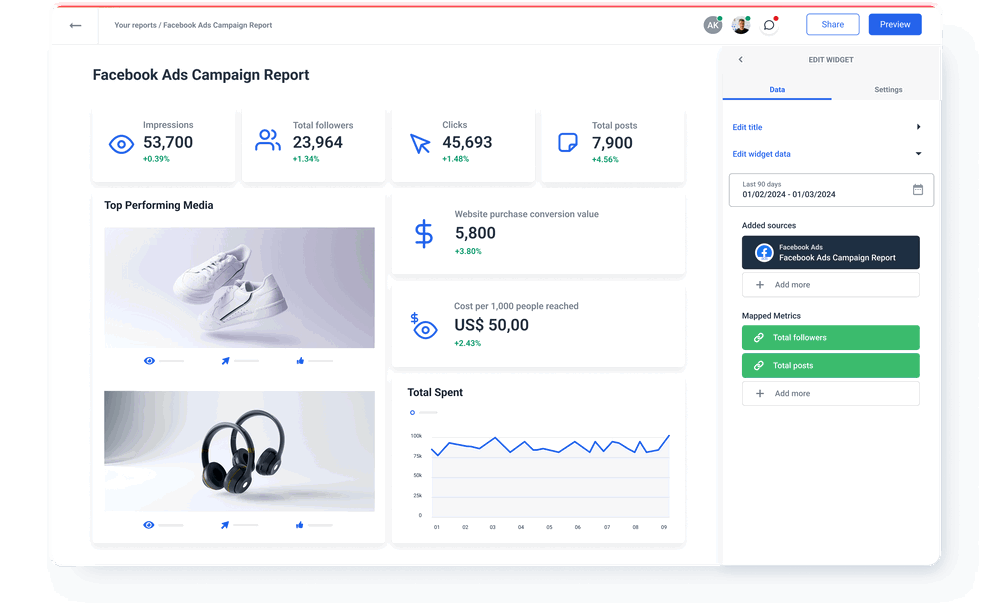
Connect your Facebook Ads data and use Whatagraph’s advanced visualization to analyze and share the performance of your Facebook Ads campaigns. A fully managed Facebook Ads integration pulls data directly from your Facebook Ads account to stunning custom reports. Effortlessly analyze the attribution and demographics that engage with your ad creative. Blend and organize Facebook Ads metrics before visualization to present only the most impactful data points. Share insights from your marketing data automatically as scheduled emails or live links.
Manage all your Facebook Ads metrics via a direct connection to Facebook Ads API

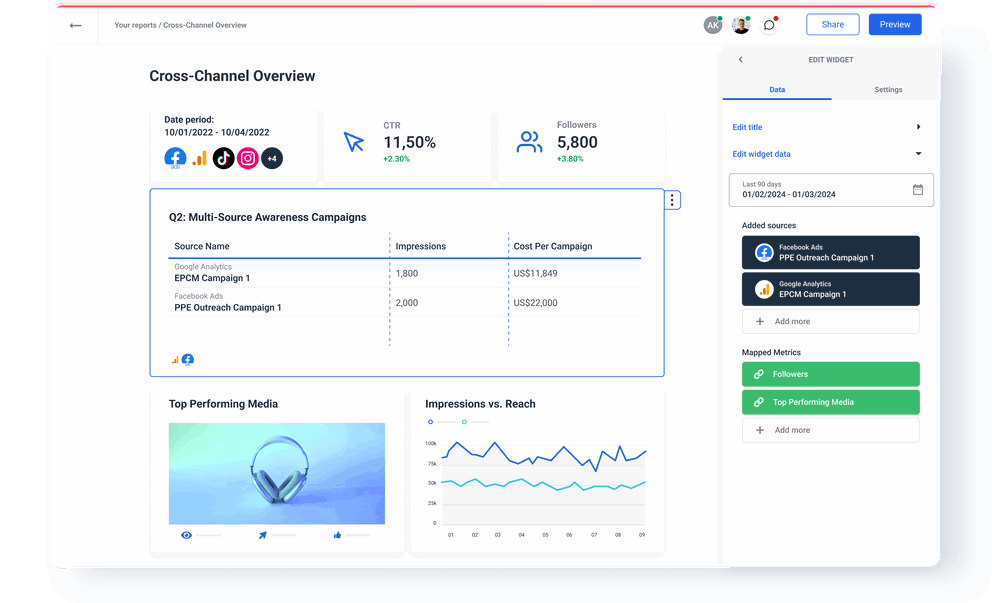
Blend your Facebook Ads performance data with insights from other advertising platforms
Facebook Ads metrics available instantly in Whatagraph
All
Facebook Ads Performance
10Facebook Ads Conversions
175Facebook Ads Engagament
105Facebook Ads Catalog Segments
23Facebook Ads Converted Products
20Search...

Reach
Frequency
Impressions
Amount spent
Clicks (all)
CPC (all)
CTR (all)
Social amount spent
CPM (cost per 1,000 impressions)
Cost per 1,000 people reached
Conversions (164)expand_less
Offsite conversions
Unique purchases
Unique website content views
Unique landing page views
Unique registrations completed
Unique website leads
Unique On-Facebook leads
Cost per unique landing page view
Cost per unique custom event
Cost per unique lead
Cost per unique registrations completed
Cost per unique purchase
Cost per unique On-Facebook lead
Unique website adds to cart
Website unique checkouts initiated
Unique custom events
Offline unique checkouts initiated
On-facebook unique checkouts initiated
Mobile app unique checkouts initiated
Unique checkouts initiated
On-Facebook leads
Cost per On-Facebook leads
Cost per adds to wishlist
Unique content views
Cost per purchase
Location searches
Donations
Website donations
On-Facebook donations
Mobile app donations
Offline donations
Donate conversion value
Website donate conversion value
On-Facebook donate conversion value
Mobile app donate conversion value
Offline donate conversion value
Cost per donation
Phone number clicks
Phone number clicks value
Find location conversion value
Cost per phone number clicks
Cost per find location
Purchases conversions value
Purchases
Purchase ROAS
Offline adds to cart
On-Facebook adds to cart
Adds to cart
Custom event value
Website location searches
Calls placed
20-seconds call
60-seconds call
Unique leads
Unique offsite conversions
Leads
Mobile app purchase ROAS
Contacts
Appointments scheduled
Applications submitted
Offsite conversions value
Trials started
Conversion rate
Subscriptions
Products customized
Website products customized
Subscription value
Cost per subscriptions
Website purchase ROAS
Mobile app achievements unlocked
Mobile app activations
Mobile app adds of payment info
Mobile app adds to cart
Mobile app adds to wishlist
Mobile app registrations completed
Cost per mobile app registrations completed
Mobile app content views
Mobile app checkouts initiated
Mobile app levels achieved
Mobile app purchases
Mobile app ratings submitted
Mobile app searches
Mobile app credits spent
Mobile app tutorials completed
Other events
App installs
Desktop app engagements
Desktop app story engagements
Desktop app uses
Commerce adds to cart
Commerce message to buy
Commerce purchases
Commerce content views
Credit spends
Game plays
Landing page views
Leads (Form)
Mobile app installs
Custom events
Adds of payment info
Website adds to cart
App adds to wishlist
Adds to wishlist
Registrations completed
Website checkouts initiated
Offline checkouts initiated
On-facebook checkouts initiated
Checkouts initiated
Cost per registrations completed
Website leads
Website purchases
Searches
Website content views
Offline content views
Content views
On-Facebook workflow completions
On-Facebook purchases
Mobile app achievements unlocked value
App activation value
Mobile app Adds of payment info value
Mobile app adds to cart conversion value
Mobile app adds to wishlist value
Mobile app registrations completed value
Mobile app checkouts initiated conversion value
Mobile app levels achieved value
Mobile app purchases conversion value
Mobile app ratings submitted value
Mobile app searches value
Mobile app credits spent value
Mobile app Tutorials completed conversion value
Other events value
App install value
Desktop app uses value
Commerce adds to cart value
Commerce message to buy value
Commerce purchases value
Commerce content views value
Credit spends value
Game plays value
Landing page views value
Leads (Form) value
Mobile app install value
Adds of payment info value
Website adds to cart conversion value
App adds to wishlist value
Registrations completed value
Website checkouts initiated conversion value
Offline checkouts initiated conversion value
On-facebook checkouts initiated conversion value
Checkouts initiated conversion value
Website leads value
Website purchases conversion value
Searches value
On-Facebook workflow completions conversion value
On-Facebook purchase conversion value
Cost per lead
Cost per app installs
Cost per landing page view
Offline purchases conversion value
Offline adds of payment info value
Offline adds to cart conversion value
Offline registrations completed conversion value
Offline purchases
Offline other conversions
Unique post reactions
Unique post saves
Unique post shares
Unique comments
Unique likes
Unique link clicks
Cost per unique post save
Cost per unique link click
Cost per unique like
Cost per unique content view
CPC (cost per link click)
Page engagement
Unique page engagement
Estimated call confirmation clicks
Instant Experience view percentage
Instant Experience view time
Cost per estimated ad recall lift (people)
Cost per outbound click
Cost per 15-second video plays
Cost per unique click (all)
Cost per unique outbound click
Cost per 2-second continuous video play
Estimated ad recall lift rate
Estimated ad recall lift (people)
CTR (link click-through rate)
Cost per thruplay watched videos
Instant experience clicks to open
Instant experience clicks to start
Outbound clicks
Unique outbound clicks
Outbound CTR
Instant experience outbound clicks
Unique CTR (link click-through rate)
15-second video plays
2-second continuous video plays
Video plays
Thruplay watched videos
Unique clicks (all)
Unique CTR (all)
Unique outbound CTR
30-second video plays
Video average play time
Video plays at 100%
Video plays at 25%
Video plays at 50%
Video plays at 75%
Video plays at 95%
Post engagement
Unique post engagement
Check-ins
Post comments
Post full views
Page likes
Page mentions
Newly purchased mobile devices
Blocked messaging connections
Messaging conversations started
New messaging connections
Messaging replies
Page photo views
Unique page photo views
Post shares
Post reactions
Receive Offers
Event responses
Page tab views
3-second video plays
Mobile app content views value
Check-ins value
Post comments value
Post full views value
Page likes value
Link click value
Page mentions value
Newly purchased mobile devices value
Content views value
Blocked messaging connections value
Messaging conversations started value
New messaging connections value
Messaging replies value
Outbound clicks value
Page photo views value
Post shares value
Post reaction value
Receive Offers value
Event responses value
Page tab views value
Cost per 3-second video plays
Cost per page like
Cost per post engagement
Cost per page engagement
Page engagement rate
Cost per new messaging connections
Cost per messaging conversation started
Cost per messaging replies
Post LIKE reactions
Post LOVE reactions
Post WOW reactions
Post HAHA reactions
Post SAD reactions
Post ANGRY reactions
Cost per event responses
Post saves
Link clicks
10-second video plays
Purchase ROAS with shared items value
Website purchase ROAS with shared items value
Mobile app purchase ROAS with shared items value
Adds to cart with shared items value
Website adds to cart with shared items value
Offsite conversions with shared items value
Mobile app adds to cart conversion with shared items value
Custom events with shared items value
Purchases with shared items value
Website purchases with shared items value
Content views with shared items value
Website content views with shared items value
Mobile app content views with shared items value
Mobile app purchases conversion with shared items value
Website purchases with shared items
Adds to cart with shared items
Website adds to cart with shared items
Mobile app adds to cart with shared items
Content views with shared items
Website content with shared items views
Mobile app content views with shared items
Purchases with shared items
Mobile app purchases with shared items
Website purchases converted value
Adds to cart value
Website adds to cart value
Custom events value
Website content views value
Purchases converted value
Mobile app purchases converted value
Total custom conversions
view_cart
sign_up
login
add_shipping_info
add_to_cart
sim_validation
purchase
Total actions
The number of action that was attributed to your ads
Total action values
Total cost per action
Total unique actions
Total conversion values
SeeResultsClick
CalculatorClicks
SeeResultsClick value
Cost per SeeResultsClick
CalculatorClicks value
Cost per CalculatorClicks
Cost per thruplay
Check out related integrations:


Scalable Facebook Ads reporting with features built for agencies like yours


Pick a template and start reporting


Frequently Asked Questions
Do I need Looker Studio to visualize Facebook Ads data?
No, you don’t need Looker Studio (Google Data Studio) or any other tool to visualize your Facebook Ads data. Whatagraph is an all-in-one marketing data platform to connect, organize, visualize, and share all your data. This makes Whatagraph a better choice than other data platforms that provide only the connection or ETL functionality, requiring users to use a separate visualization tool.
How to connect Facebook Ads data to Whatagraph?
Whatagraph has a pre-built Facebook Ads connector, so you don’t have to purchase and configure third-party data connectors. Adding a new Facebook Ads source is simple:
1. Go to the Data Sources menu and locate Facebook Ads among the channels.
2. Click Connect an account.
3. From there, you’ll be redirected to log in to your Facebook Ads account.
4. Once forwarded to Facebook, choose "Edit settings" and make sure to choose the first option on all of the pages — all current and future accounts.
5. The new Facebook Ads source will appear.
You have successfully created a connection to your Facebook Ads API. Create a custom report or dashboard and add your Facebook Ads account as a source.
When you connect Facebook Ads data to Whatagraph, you can organize datasets to get more granular insights by device, campaign ID, date, etc. You can visualize data in various widgets and share the insights via automated email attachments or live links for near real-time access.
Can I export data from Facebook Ads reports?
Yes, you can export data as Excel spreadsheets or CSV files. This way, you can easily move it to Tableau, Power BI, or other data destinations for further analysis.
What other marketing data sources can I connect with Whatagraph?
You can connect a range of popular marketing platforms like Google Analytics 4, social media like Facebook Page and Instagram, PPC like Google Ads, Microsoft Advertising, Amazon Ads, CRMs like Salesforce and HubSpot, as well as email marketing and e-commerce platforms.
What is the difference between data connectors and fully managed Whatagraph integrations?
A data connector is a piece of software, typically built by a third party, to connect two different platforms.
On the other hand, Whatagraph’s integration directly connects to Facebook Marketing API with no third-party software in the middle. As a result, the data flow is more stable and secure, and the connection performance doesn’t depend on the policies of third-party vendors.
Effortlessly create reports and dashboards

What others think about Whatagraph
I made a switch from GDS and Sheets for reporting to Whatagraph, and I am saving literal hours each week on performance report creation. Our small firm actually managed to onboard 2 new clients as a result of all the time we saved on managing data and reporting. The customer service is also really helpful and easy to reach.

Capterra verified review by
Mindaugas S., Marketing Consultant
Having active customer support to help fix any issues was a big contributor, but we also really liked the ability to save templates and connect sources to multiple charts/widgets at once without having to edit them individually. And having the grid layout is much easier to stay consistent with than the free form setup that Data Studio has.

Capterra verified review by
Nico T., Media Planner
The system has standard templates that are easy and fast to use. Also you can build your own report with lightning speed. It is very easy to use, has a lot of integration, and let get started very fast.

Capterra verified review by
Rasmus Bernt K., External Senior Management Consultant
We love Whatagraph - we would definitely recommend and our account manager is great! I love how easy this tool is to use, everyone on the team finds it much more user-friendly than other dashboards. Integration was easy, we sent some example reports to the team who duplicated these for us. We literally had to log in and send it to our clients!

Capterra verified review by
Stephanie S., Digital Director
We are showing our clients the work that we're doing for them and this is incredibly important for our clients ROI. They want to see results and having a tool like Whatagraph that can show data from virtually every source we use is hugely important.

Capterra verified review by
John S., SEO Strategist
The tool is easy to use; you do not need to have development resources. Even my junior project managers are capable of making campaign reports in minutes. There are a lot of pre-made templates you can use as well as many pre-made widgets.

Capterra verified review by
Erman E., Marketing Specialist
Really easy to connect data sources within the tool. The library of report templates has been helpful. The customer support team has been responsive to all of our needs. Our team enjoys the simplicity of setting up the reports and how the data is presented.

Capterra verified review by
Brent N., Director of Operations
Easy to create really beautiful graphs and reports which can help other team members to understand the most important takeaways. I especially like the automated report function, so I don't have to check on the same thing repeatedly.

Capterra verified review by
Orsolya S., Online Marketing Manager