Marketing Report Examples

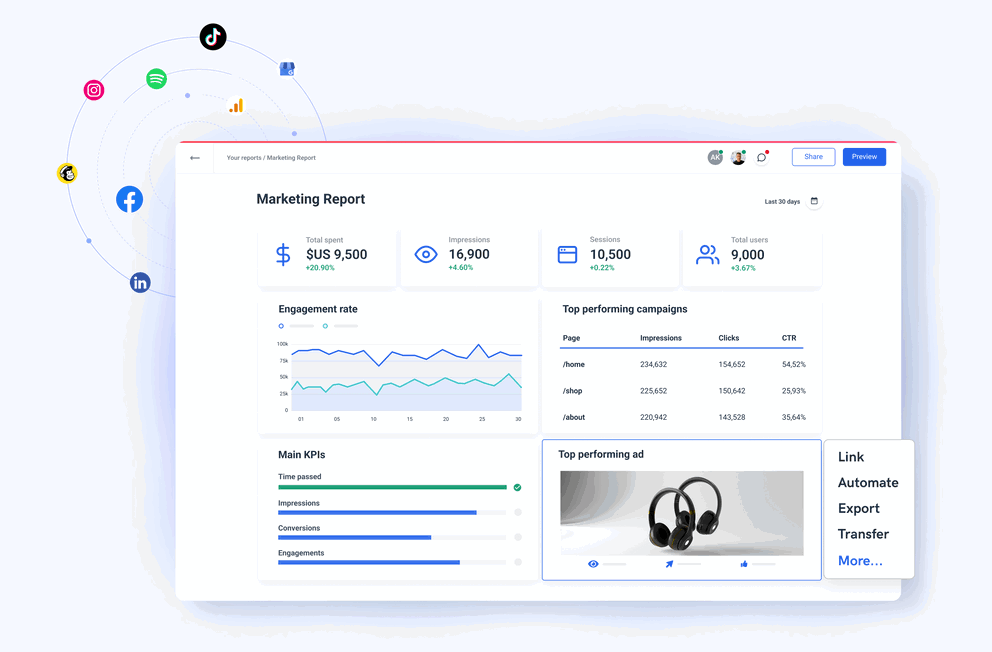
Save hours of work every month and share insights with clients or stakeholders in a few clicks. No matter what type of marketing reports you’re looking for, we have it. Monitor your entire digital marketing performance with our stunning marketing report examples that pull data from your Google Analytics, socials, PPC, e-commerce platforms, and more. Track all the essential KPIs and let us get the data for you. Combine, organize, and visualize data from multiple channels in one report and automate sending through a scheduled mailing list or live links.

    Top-Performing Marketing Report Examples
    Join marketing agencies and teams worldwide who use Whatagraph to work with marketing data!
    Ogilvy logo
    n365 logo
    House dentsu logo
    upstick logo
    thrive logo
    Power digital logo
    havas logo
    mc cann logo

    45+ pre-built digital marketing report examples to choose from

    SVG image

    Find a dashboard for you

    CallRail Analytics Reporting Tool icon

    CallRail Analytics Reporting Tool

    Stay on top of your call-tracking campaign performance with our CallRail analytics reporting tool. Get all your KPIs in one place and transform them into actionable insights with Whatagraph. Easily visualize caller names, phone numbers, and more.
    See more
    Adroll Reporting Tool icon

    Adroll Reporting Tool

    Our Adroll reporting tool lets you capture your clients’ conversions, ad group performance, click-through rate, cost per acquisition, (ROAS), view-through, and many other engagement metrics that show the performance of your Adroll campaigns.
    See more
    Simpli.fi Reporting Tool icon

    Simpli.fi Reporting Tool

    Create live visual reports using Simpli.fi data with our Simpli.fi reporting tool. Optimize your ad audiences based on local needs to provide customized content for different locations. Share custom reports as automated emails in seconds.
    See more
    Basis (Formerly Centro) Reporting Tool icon

    Basis (Formerly Centro) Reporting Tool

    Automatically generate engaging Centro reports that clients find easy to understand. Monitor changes over time for custom date range analytics and compare line items’ impressions and clicks. Try the go-to Centro reporting tool for agencies.
    See more
    Google Search Ads 360 Reporting Tool icon

    Google Search Ads 360 Reporting Tool

    Whatagraph helps agencies create awesome visual Google Search Ads 360 reports in mere minutes. Drag and drop pre-made widgets to visualize Google Search Ads 360 performance across different campaigns, ad groups, keywords, and ads.
    See more
    Semrush Reporting Tool icon

    Semrush Reporting Tool

    Send your clients automated SEO reports with accurate Semrush data insights with one click. Use an intuitive Semrush Reporting Tool to create an easy overview of your most important backlinks, keywords, top pages, and more.
    See more
    Ahrefs Reporting Tool icon

    Ahrefs Reporting Tool

    Analyze the effectiveness of your SEO and content strategy with our comprehensive Ahrefs reporting tool. Get an in-depth look at the backlink profile and search traffic of any website or URL and compare your keyword research results.
    See more
    Campaign Monitor Reporting Tool icon

    Campaign Monitor Reporting Tool

    If your clients use Campaign Monitor, you can use Whatagraph to create intuitive, automated reports with ease. Effortlessly share Campaign Monitor insights pre-loaded with the KPIs that clients want to see in their email campaign reports.
    See more
    Google My Business Reporting Tool icon

    Google My Business Reporting Tool

    Capture valuable search traffic with the Google My Business report from Whatagraph. Find out how many customers directly searched for your business, and how many total views and actions you receive monthly.
    See more
    Snapchat Reporting Tool icon

    Snapchat Reporting Tool

    Break your Snapchat data down into subscribes, conversions, purchases, or demographic sections to get a better view of how your Snapchat campaigns are performing. Turn your client’s Snapchat data into stunning visual reports.
    See more
    Shopify Reporting Tool icon

    Shopify Reporting Tool

    Shopify is a phenomenal platform for anyone looking to build an ecommerce business. However, managing and growing your online store is no easy feat. Whatagraph is the go-to solution that simplifies the data tracking and analysis process.
    See more
    ActiveCampaign Reporting Tool  icon

    ActiveCampaign Reporting Tool

    Replace slides and pixelated screenshots with stunning ActiveCampaign reports that will impress your clients. Save billable hours by using professional pre-made reports to quickly visualize and share your email marketing strategy metrics.
    See more
    Google Sheets Reporting Tool icon

    Google Sheets Reporting Tool

    Spreadsheets play a huge role in many agencies. Yet, it’s not an efficient tool to deal with huge volumes of data. Visualize your data with our Google Sheets reporting tool. No more manual data entry - Whatagraph does the heavy lifting!
    See more
    Twitter Reporting Tool icon

    Twitter Reporting Tool

    Do you need to find out how your Twitter account is performing? Grab yourself a Twitter report tool and start tracking real-time data. With Whatagraph, you can pull any data from Twitter and get all vital KPIs and metrics.
    See more
    LinkedIn Analytics Reporting Tool icon

    LinkedIn Analytics Reporting Tool

    Get all your KPIs in one place and transform them into actionable insights with Whatagraph Analytics reporting software. Easily visualize your LinkedIn audience growth, interactions, engagement metrics, and more.
    See more
    YouTube Reporting Tool icon

    YouTube Reporting Tool

    Create a master YouTube report and efficiently track KPIs and goals. Get timely channel and video performance data about your clients’ likes, comments, views, and subscribers. Send customized and automated YouTube reports to your client.
    See more
    Search Query Reports icon

    Search Query Reports

    Find new keyword opportunities with our Search Query Reports for agencies. Get all your KPIs in one place and transform them into actionable insights with Whatagraph. Easily visualize your CTR, conversions, conversion rate, and more.
    See more
    Google Analytics 4 Reporting Tool icon

    Google Analytics Reporting Tool

    Stay on top of your website performance with our Google Analytics reporting tool. Get all your KPIs in one place and transform them into actionable insights. Create your own GA report in minutes, without complex spreadsheets and graphs.
    See more
    Google Ads Reporting Tool icon

    Google Ads Reporting Tool

    Powerful Google Ads reporting tool for digital marketing agencies. Design your Google Ads reports according to your clients’ needs. Get access to accurate PPC metrics like CPC, click-through rate, conversion rate, impressions, and more.
    See more
    Facebook Ads Reporting Tool icon

    Facebook Ads Reporting Tool

    Stay on top of your paid campaign performance with our Facebook Ads reporting tool. Get all your KPIs in one place and transform them into actionable insights. Easily track and analyze your conversion metrics based on campaign, ad set, and ad.
    See more
    Facebook Reporting Tool icon

    Facebook Reporting Tool

    Gather all your social media data with our automated Facebook reporting tool. Whatagraph’s comprehensive reports measure your Facebook strategy success, collect all your critical KPIs, and monitor your campaign performance.
    See more
    Instagram Reporting Tool icon

    Instagram Reporting Tool

    Keep your clients updated on their business account performance at any time. Track audience behavior, content trends, and the effectiveness of the whole strategy. Set up the email cadence once and automate your Instagram reporting.
    See more
    TikTok icon

    TikTok Reporting Tool

    Connect, visualize, and share TikTok data with your clients in a few clicks. Add essential TikTok page metrics to any cross-channel report. Keep your client informed with minimal manual inputs from your side.
    See more
    Google Analytics 4 Reporting Tool icon

    Google Analytics 4 Reporting Tool

    Report on essential Google Analytics 4 metrics for a 360-degree view. Connect, organize, visualize, and share Google Analytics 4 data with your clients in a few clicks. Engaging GA4 reports only a few clicks away.
    See more
    Wthie label tool icon

    White Label Reporting Tool

    Change your report's whole theme, structure, and logos with our White Label reporting tool. Easily replicate and show off your brand colors or impress clients with a custom report domain that matches theirs.
    See more
    Marketing Reporting Software icon

    Marketing Reporting Software

    Quickly generate reports to summarize key marketing metrics such as website traffic, leads generated, and conversion rate. Automatically pull data from connected marketing channels to measure success and make data-driven decisions.
    See more
    Keyword Ranking Reporting Tool icon

    Keyword Ranking Reporting Tool

    Pull accurate SEO data and report on the performance of your optimization efforts. Use graphs, tables, and charts to show the progress of your SEO campaigns to your clients and update them automatically with scheduled emails or live links.
    See more
    Social Media Reporting Tool icon

    Social Media Reporting Tool

    Keep your clients informed on their social media performance with a powerful social media reporting tool. Pull data from multiple social media platforms and present cross-channel insights. All your social media campaigns’ results in one clear report.
    See more
    Web Analytics Reporting Tool icon

    Web Analytics Reporting Tool

    Create and send a web analytics report for your client’s website using cross-channel insights from 45+ marketing data integrations. Pick among professionally-built widgets preloaded with optimal dimensions and metrics for every marketing channel.
    See more
    Drag and Drop Report Builder icon

    Drag and Drop Report Builder

    Start from a clean slate and create any kind of marketing report using our intuitive drag-and-drop builder. Arrange the widgets any way you like, change the pre-set dimensions and metrics, or create new custom widgets and save them as templates.
    See more
    SEM Reporting Tool icon

    SEM Reporting Tool

    Report on the results of your clients paid marketing and organic search campaigns with Whatagraph’s SEM reporting tool. Connect their Google Ads, GA4, Bing Ads, Facebook Ads, Semrush, or Ahrefs to report on both paid and organic efforts.
    See more
    Google Analytics PDF Reporting Tool icon

    Google Analytics PDF Reporting Tool

    Whether you use the tool for just Google Analytics or cross-channel reporting, sometimes the most convenient way to keep the stakeholders informed is by sending a weekly or monthly PFD report they can download, print, or share.
    See more
    KPI Reporting Tool icon

    KPI Reporting Tool

    Deliver top-level KPIs to your clients in a few clicks with our marketing KPI reporting tool. Replace Excel and manual reporting with stunning visualizations and automated data refresh rates. Customize every graph and table to your reporting needs.
    See more
    Custom Reporting Software icon

    Custom Reporting Software

    Present your marketing results in a clear and understandable way with our custom reporting software. Create customized report templates for specific departments or clients using data from a variety of marketing sources.
    See more
    White-label SEO Reporting Tool icon

    White-label SEO Reporting Tool

    Create white-label SEO reports that look like they are hosted on your website. Customize the whole look and feel of your SEO report. Apply custom branding to use your company logo and colors. Send each report using a custom email domain.
    See more
    PPC Reporting Tool icon

    PPC Reporting Tool

    Automatically pull data from all your PPC platforms to track impressions, click-through rate, ROAS, and overall campaign costs for different paid advertising campaigns. Keep an eye on vital PPC KPIs and present them in one detailed report.
    See more
    Advertising Reporting Tool icon

    Advertising Reporting Tool

    Report on the results of all your digital advertising campaigns in one place. Connect your advertising channels, and the widgets will come to life with fresh KPIs. Organize the source data to visualize only the points that make the most impact.
    See more
    SEO Rank Reporting Tool icon

    SEO Rank Reporting Tool

    Visualize the impact of your SEO strategy on clients’ keyword and page ranking with Whatagraph’s SEO rank report. Integrate data from Ahrefs, Semrush, and Google Search Console to show how individual page positions have improved over time.
    See more
    Call Monitoring Reporting Tool

    Call Monitoring Reporting Tool

    Give call center managers an easy way to monitor actionable insights about their call agents’ performance in near real-time. Connect your CallRail and Call Tracking Metrics accounts for easy access to the most important call center KPIs.
    See more
    E-commerce Reporting Software icon

    E-commerce Reporting Software

    Create seamless e-commerce reports for your clients using accurate data from their e-commerce platforms. Connect each account and create stunning reports using data from Shopify, BigCommerce, and 45+ other integrations.
    See more
    Local SEO Reporting Tool icon

    Local SEO Reporting Tool

    Gather your local SEO performance data into one local SEO report with stunning visuals and automated sharing options. Present your clients’ search rankings, mobile searches, and keyword performance, along with the conversion rate of individual pages.
    See more
    Sales Reporting Software icon

    Sales Reporting Software

    Report on all your sales channels' performance in one location. Show which marketing channels drive the most sales opportunities. Compare the performance of each channel on your bottom line – PPC, social media, organic, and cold calls.
    See more
    Agency Analytics Reporting Tool icon

    Agency Analytics Reporting Tool

    Our time-saving reporting tool has everything a marketing agency needs: No-code marketing data integrations, a user-friendly report builder, cross-channel data, pre-made templates, white-labelling, report sharing automation, and more.
    See more
    Advanced Reporting Software icon

    Advanced Reporting Software

    Transform the stream of marketing data into actionable insights with Whatagraph’s advanced reporting software. Blend metrics from multiple sources, group data points from different campaigns, or create custom calculations to visualize deep data.
    See more
    Automated SEO Reporting Tool icon

    Automated SEO Reporting Tool

    Connect the relevant SEO platform accounts and create an engaging SEO report that has all the essential backlinks, keywords, page ranking, and organic sessions in one place. Automate the report sharing via live links or scheduled emails.
    See more
    SEO report icon

    SEO Reporting Tool

    The easiest way to create an SEO report for your clients. Organic traffic, new keywords, top-ranking pages and keywords, backlinks, and much more. Aggregate data from different SEO sources and present it in a way your clients understand.
    See more

    FAQs

    All your questions answered. And if you can’t find it here, chat to our friendly team.

    What is a marketing report?

    A marketing report is an organized presentation of data from different marketing sources. It presents the performance of your marketing efforts by visualizing your marketing KPIs. A good marketing report should give you data to make a decision and take action to improve your marketing campaigns. 

    How do you write a marketing report?

    To write a marketing report you need to go through several steps:
     

    1. Define the purpose of your marketing report. 


    2. Consider your audience — who will read your report and what information they need.


    3. Gather your data — the best way is to use a marketing reporting platform that automatically pulls data from connected sources via native integrations.


    4. Build your report — you can use a range of tools from Excel and PowerPoint to advanced BI tools, but again, the quickest and easiest way is to use analytics reporting software with pre-built marketing reporting examples.  
     

    5. Visualize your data — a good reporting software allows you to easily create custom visualizations or edit existing ones. 


    Pro tip: Remove the unnecessary metrics from your tables and aggregate related metrics from different tools in one widget, making them easier to analyze. 


    6. Customize the report design — depending on your audience, you may want to customize the look and feel of your report. Marketing agency reporting tools usually have white-label and custom options to easily change the logo, colors, and other branding elements of your report. 


    7. Save the report as a template — Whatagraph allows you to save any report you create from scratch or templates as your team template. Even link reports together and edit more of them at once. 

    What are some key elements to include in a marketing report?

    A marketing report should include a general overview of the key areas of your marketing efforts such as content marketing, SEO marketing, social media channels, etc.  Depending on your marketing activities, your report may include:
     

    Strategy overview: a high-level summary to catch the reader up and provide a context for the information that the report includes. This section should include goal completions, channels, and the Date Range that the report includes. 


    Website overview: Page views, Unique page views, Top landing pages, Traffic Channels, New vs. returning users, Paid vs. organic, Bounce rate, Conversion rate.


    Blog overview: Page views, Top posts, Top categories, Traffic by source, Referral source.


    SEO overview: Top ranking pages/keywords, keyword movement, snippets.


    Paid overview: Goal, Ad spend, Conversion (CTR, Download, Signup, Views, Actions), Cost per Conversion, ROI (return on investment).


    Email overview: Most popular email, New Subscribers, Unsubscribers, Emails sent, CTR, Sales, Email open rate, Email deliverability.


    Social overview: Followers, Engagement (Shares, Comments, Etc.), Engagement rate, Reach, Top converting channels.


    Leads: Marketing Qualified leads, Sales Qualified Leads, Total number of leads, Average Customer Acquisition Cost, Average Opportunity Value, Lead Conversion Rate, Close Rate, Leads by Channel/Source.


    These categories and the choice of key metrics will depend on the target audience and the type of report you are creating. Also, keep in mind the frequency of sending. A weekly marketing report, for example, should focus more on day-to-day changes than a monthly marketing report, which should prioritize strategic key performance indicators. 

    What are the essential marketing report examples?

    The essential marketing report examples are: 


    - Web analytics report 


    - PPC report


    - SEO (search engine optimization) report 


    - Social media marketing report 


    - Email marketing report 


    - E-commerce report 


    However, this doesn’t mean your marketing team needs to create six or more different reports for your clients. Whatagraph allows you to aggregate multiple marketing sources into one marketing analytics report with separate pages or tabs for different categories.