


- First, what should you look for in an AgencyAnalytics alternative?
- What are the 11 best AgencyAnalytics alternatives and competitors in 2026?
- 1. DashThis
- 2. Whatagraph
- 3. Geckoboard
- 4. Klipfolio
- 5. Databox
- 6. Tableau
- 7. Google Data Studio (formerly Looker Studio)
- 8. Grow
- 9. NinjaCat
- 10. Cyfe
- 11. TapClicks
- Summary: which AgencyAnalytics alternatives is right for you?
AgencyAnalytics is a great marketing agency reporting tool, but users say it can be unstable, rigid, and limited.
As of 2026, we've also heard multiple complaints around AgencyAnalytics' StackAdapt connector issues and pricing jumps.
The best AgencyAnalytics alternatives in 2026 are Whatagraph for mid-size agencies and multi-location operators, DashThis for small agencies and freelancers, Data Studio (formerly Looker Studio) for Google-centric teams on a budget, Geckoboard for live TV dashboards, and NinjaCat or TapClicks for large agencies with dedicated data teams.
To help you find the best AgencyAnalytics alternative, I did three things in this article:
- Spoke with our customers who previously used AgencyAnalytics.
- Scoured online reviews and community forums to find the best alternatives.
- Tested tools that offer free trials.
Full disclosure: one of these tools, Whatagraph, is ours. But that’s because we genuinely believe Whatagraph reduces the pains of AgencyAnalytics.
But we’re also not here to bash our competitors. We researched them thoroughly (and even tried them out) so you can really understand what they’re great at and if they’re best for you.
By the end of the article, we hope you’ll find an AgencyAnalytics alternative that fits your needs, whether it’s us or not.
TLDR
- Users look for AgencyAnalytics alternatives mostly because of unstable connectors, rigid reports, and pricing that “punishes” you for onboarding more clients.
- Whatagraph is the best AgencyAnalytics alternatives for mid-size agencies and multi-location operators that need a governed data foundation, with fully managed connectors, linked templates, autonomous agents, and MCP access for Claude and ChatGPT.
- DashThis is the best pick for small agencies and freelancers, from $44 per month billed annually for 3 dashboards and 15 sources.
- Data Studio (formerly Looker Studio) is free for Google-centric teams, but Meta, TikTok and LinkedIn data needs a paid partner connector such as Supermetrics or Power My Analytics, at $25 to $400+ per month.
- Databox (free plan, paid plans from $71 per month billed annually) suits growing teams that want a conversational AI analyst on top of KPI dashboards, while Grow (custom pricing through Epicor) suits enterprise teams that need one source of truth across business data.
- Geckoboard (from $79 per month, billed annually) and Cyfe (from $29 per month) suit live KPI dashboards on office TVs, while Tableau (from $15 per user per month) and Klipfolio (from $120 per month) suit data teams that need formula-level control.
- NinjaCat (custom contracts, from about $1,500 per month) and TapClicks (quote-based, 250+ integrations) suit large agencies with dedicated data teams.
First, what should you look for in an AgencyAnalytics alternative?
A good AgencyAnalytics alternative meets five criteria: connector stability, data organization, AI-powered reporting, scalable client reporting, and white-label and sharing options.
Before you evaluate Whatagraph, DashThis, Databox or any other tool on this list, it helps to know what actually matters at agency scale.
1. How stable are its connectors?
Stable connectors keep your data sources connected and syncing without manual fixes. A reporting tool is only as reliable as its integrations. If your data sources, Google Ads, Meta, LinkedIn, TikTok, HubSpot, and CRM platforms, disconnect without warning, you're spending time debugging instead of reporting.
Look for fully managed connectors with high uptime and a team that fixes integration issues directly, not through a third-party data pipeline like Supermetrics.
2. What data organization capabilities does it offer?
Data organization capabilities are the features that let you blend data sources, create custom metrics, and define what your KPIs actually mean. Without them, cross-channel reporting means nothing.
The ability to build custom dimensions, aggregations, and formulas separates platforms built for real marketing data from platforms built for simple dashboards.
3. Does it offer AI-powered reporting?
AI-powered reporting is now part of daily marketing work: 88% of marketers use AI in their day-to-day roles, according to SurveyMonkey research published in January 2026.
The best alternatives now offer AI features that go beyond chatbots: automated report generation from prompts, performance summaries that write themselves, anomaly detection, and workflows that connect your reporting tool to Claude or ChatGPT via MCP.
4. Does client reporting scale?
Client reporting scales when you can update every client report from one place. For agencies managing dozens of clients, linked templates are non-negotiable. Edit one master report and changes cascade across every client report instantly. Without that, every design update means opening 50 dashboards individually.
5. What white-label and sharing options does it offer?
White-label options mean clients see your agency's brand, not the reporting tool's. Custom domain, branded report URLs, client-facing filters, scheduled PDF and email delivery, and live link sharing are table stakes.
Data warehouse exports to BigQuery or Snowflake are increasingly important for agencies with data-mature clients.
Here are 11 AgencyAnalytics alternatives that fit these criteria.
What are the 11 best AgencyAnalytics alternatives and competitors in 2026?
Here are the 11 best AgencyAnalytics alternatives and competitors in 2026 I’ll review in this article:
Tool | Best for | Integrations | Pricing |
| DashThis | Small agencies and freelancers who need fast, template-based client reports | 30+ | From $44/mo (billed annually) |
| Whatagraph | Mid-size agencies and multi-location operators that need a governed data foundation, AI reporting, and scale without adding headcount | 60+ native integrations, build custom API integrations with agents | Annual plans, pricing based on source credits. |
| Geckoboard | Teams that need live KPI dashboards on office TVs or shared links | 90+ | From $79/mo (billed annually) |
| Klipfolio | Data teams that need formula-level control and centralized metric governance | 130+ (Klips) | From $120/mo (billed annually) |
| Databox | Mid-sized marketing teams that want AI-assisted analysis, goal tracking, and KPI dashboards | 130+ | Free plan available; paid plans from $71/mo (billed annually) |
| Tableau | Enterprise data teams with complex, multi-source analytics and visualization needs | 90+ | From $15/user/mo (billed annually) |
| Data Studio (formerly Looker Studio) | Freelancers and Google-centric marketing teams on a tight budget | Free Google connectors; 1,300+ community connectors | Free; Pro at $9/user/project/mo |
| Grow | Operations and data teams that need a no-code BI platform with built-in data storage | 150+ | Custom, contact sales |
| NinjaCat | Large agencies and enterprise brands with dedicated data teams | 150+ | From ~$1,500/mo (enterprise contracts) |
| Cyfe | Small businesses and boutique agencies needing an affordable all-in-one monitoring hub | 100+ | From $29/mo |
| TapClicks | Large agencies needing a full marketing operations platform beyond just reporting | 250+ | From $199/mo (SmartStory); other plans custom |
1. DashThis
Best for: Small agencies, freelancers, and in-house marketing teams who need fast, template-based client reporting without a heavy setup.
DashThis is probably the closest equivalent to AgencyAnalytics in terms of pricing and capabilities. It’s a simple marketing reporting tool that connects to 30+ marketing platforms and visualizes KPIs on dashboards.
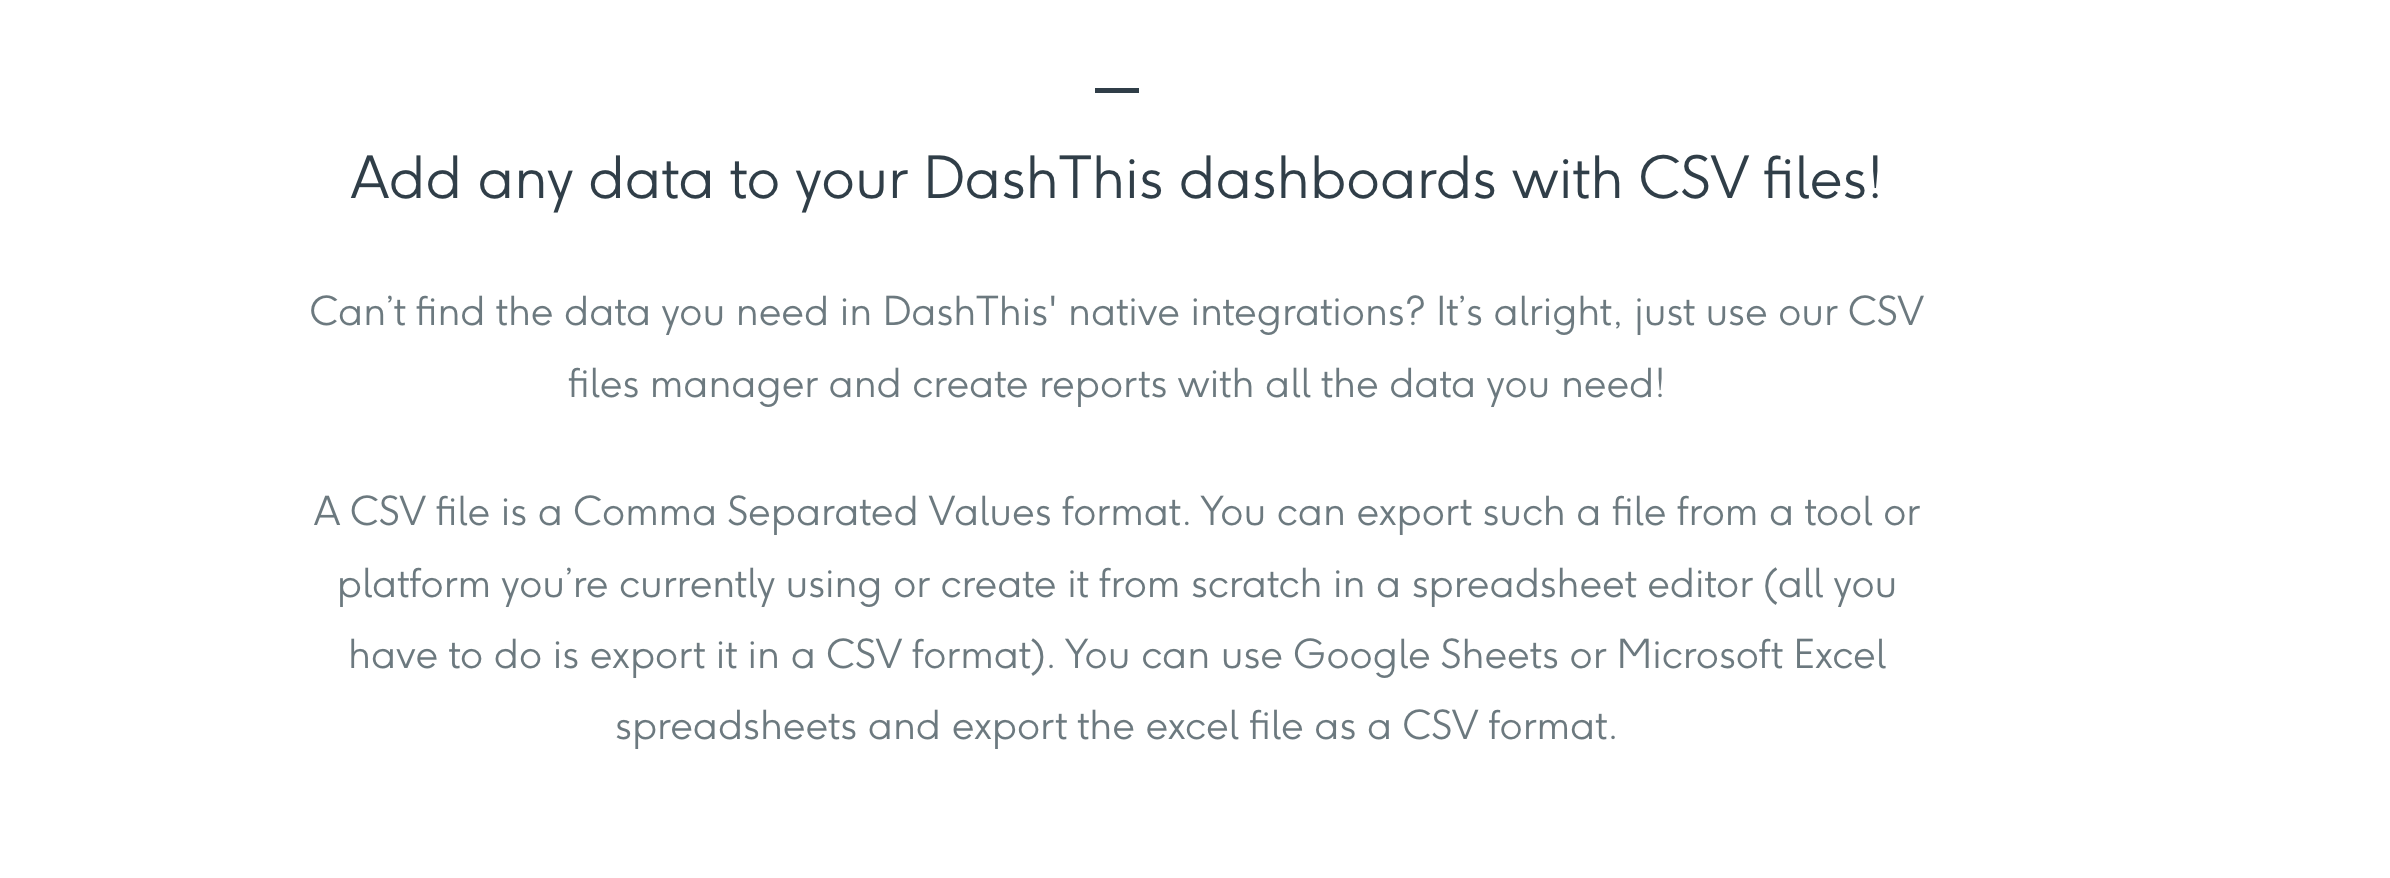
If you don’t see a built-in integration you need, you can also upload your own data using a nifty CSV file or a Google sheet.
I signed up for a free trial on DashThis again in November 2026, and the platform has changed a lot, for the better.
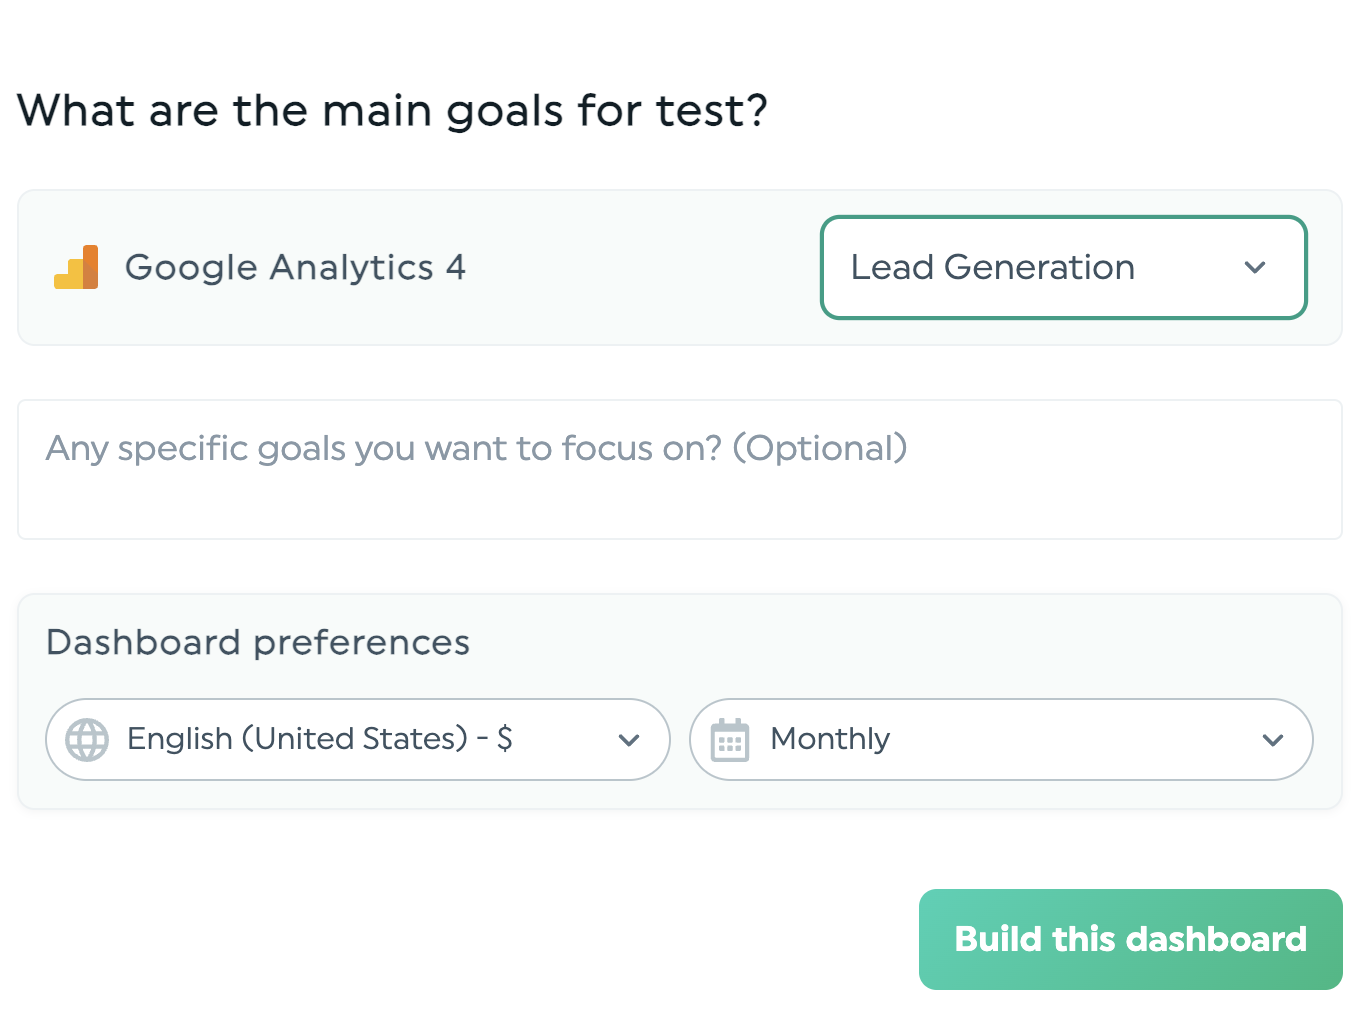
When you signup, DashThis asks you what your goal is and what kind of dashboard you want to create for your chosen data source (e.g. Google Analytics):
Then you get a sample dashboard, like so:
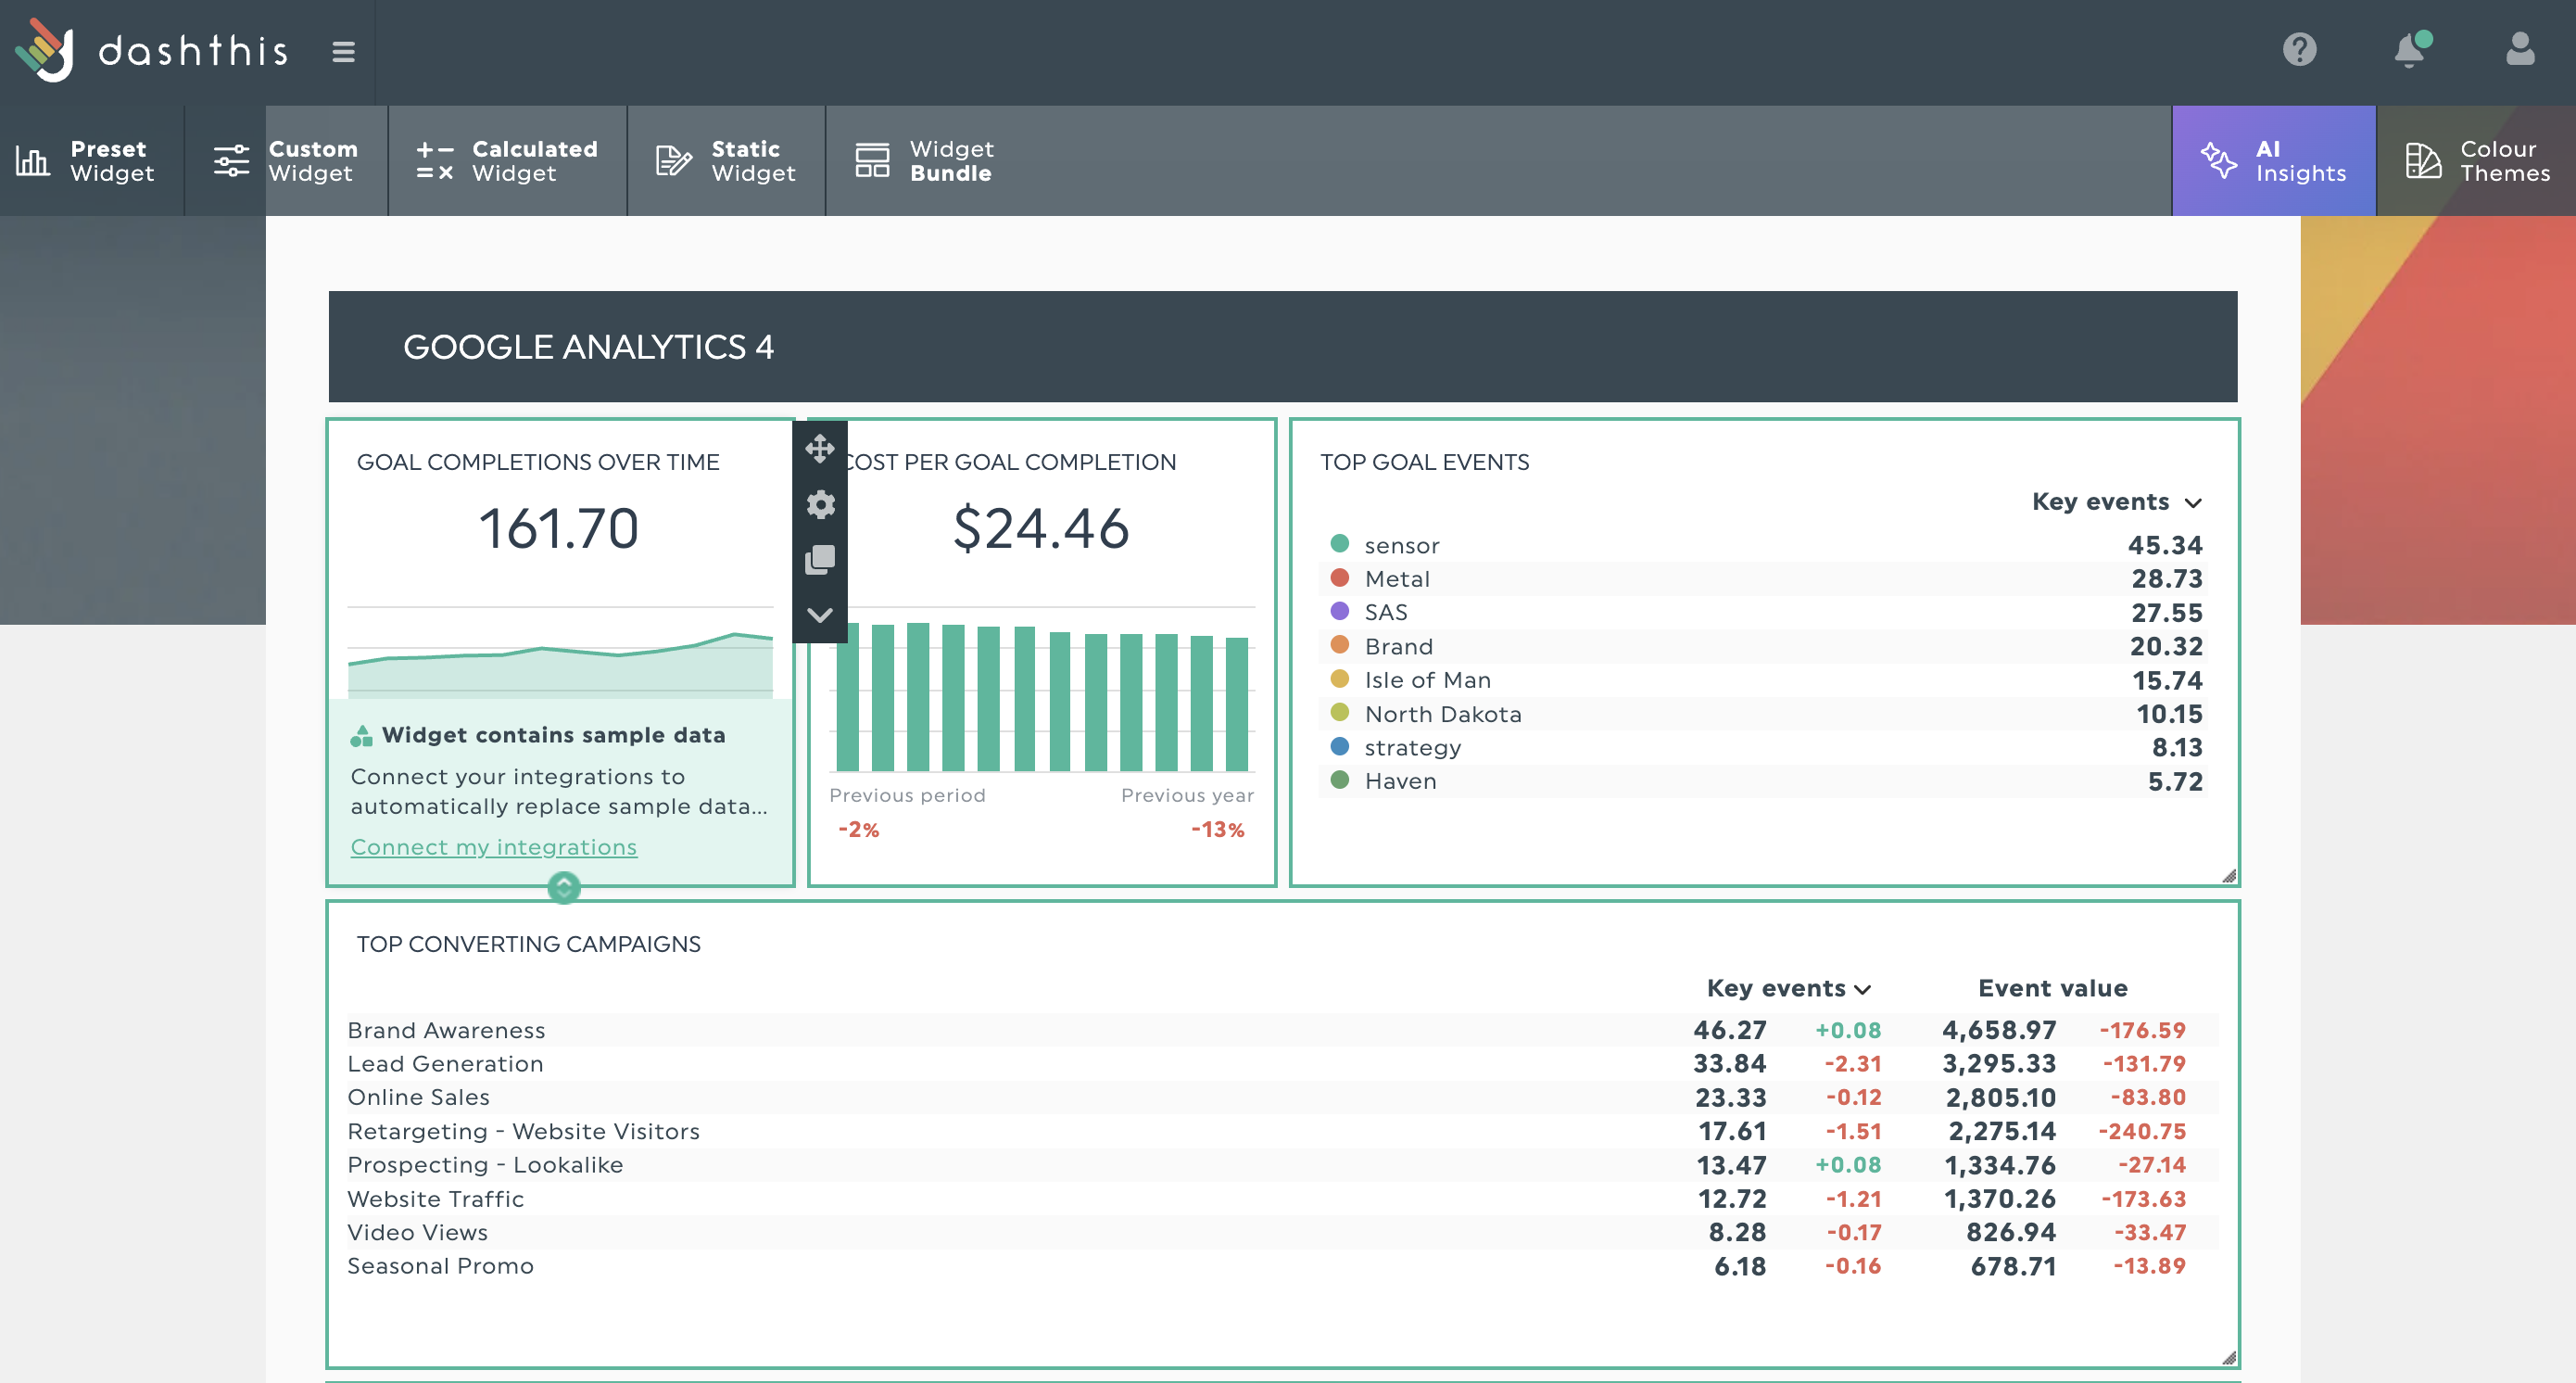
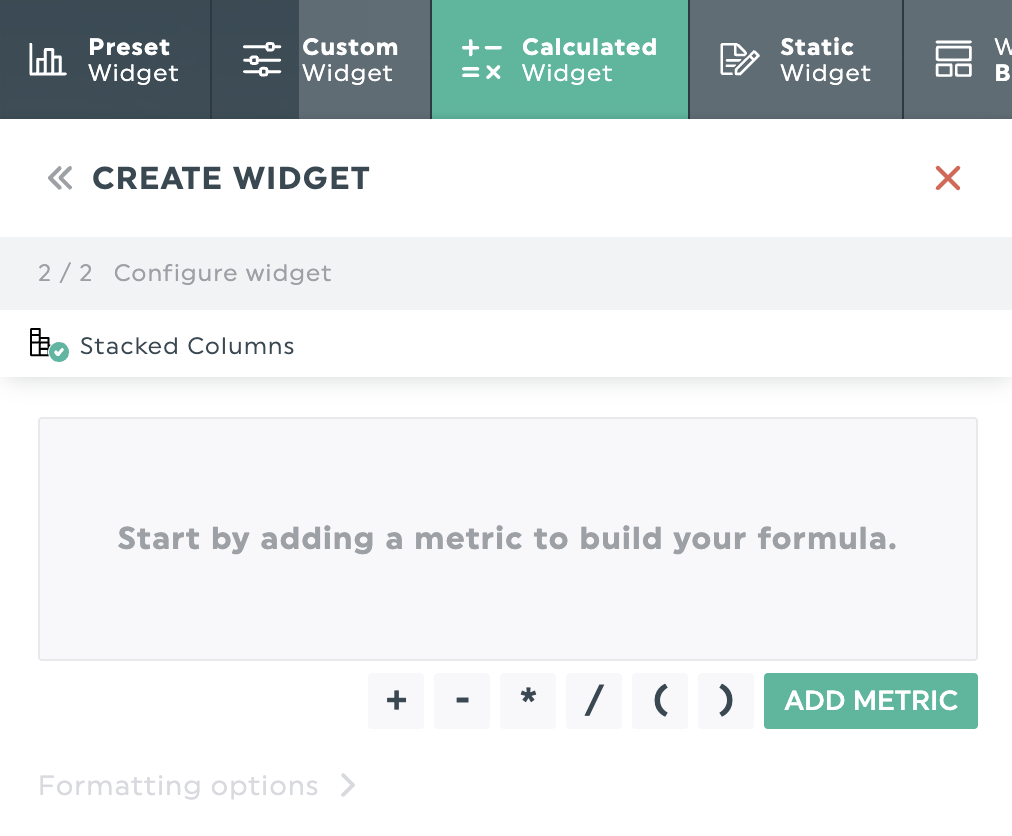
You can then add pre-set widgets, custom widgets like pie charts and stacked charts, and calculated widgets where you create a custom metric.
But those calculations live in individual widgets, and DashThis doesn’t offer custom dimensions or a shared metric layer you define once for every dashboard.
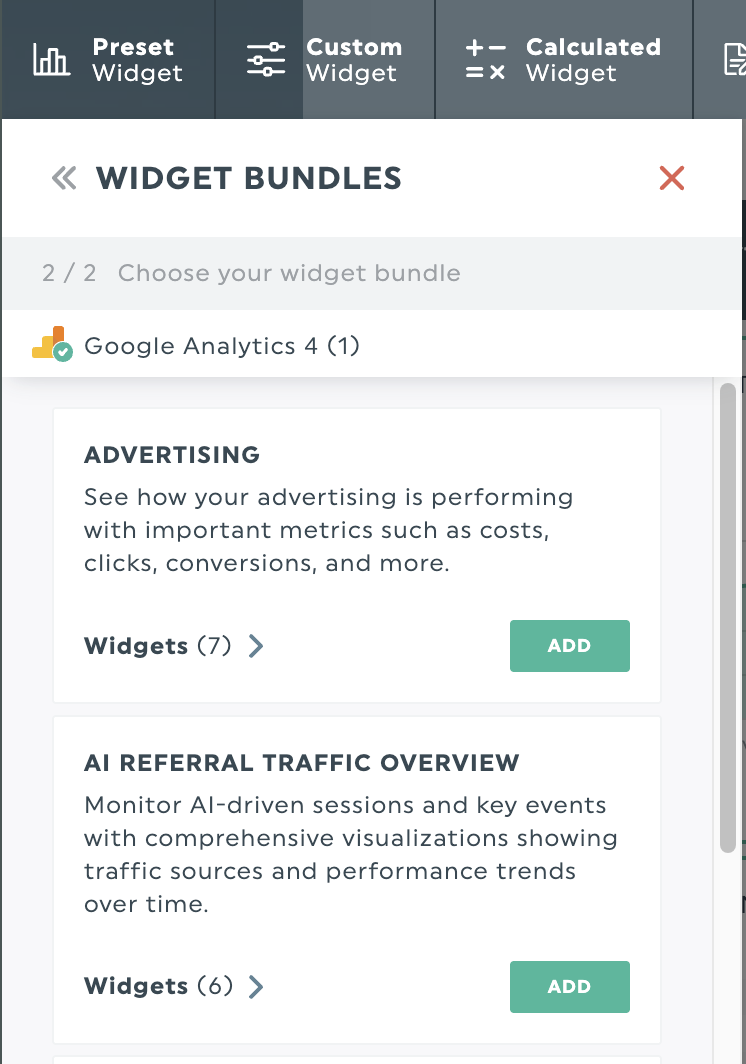
There are also “Widget bundles” which are premade widgets that you can add to your dashboard instantly.
DashThis now includes AI Insights on every plan: four preset insights (Summary, Opportunities, Wins and Issues) that analyze your dashboard data in plain language.
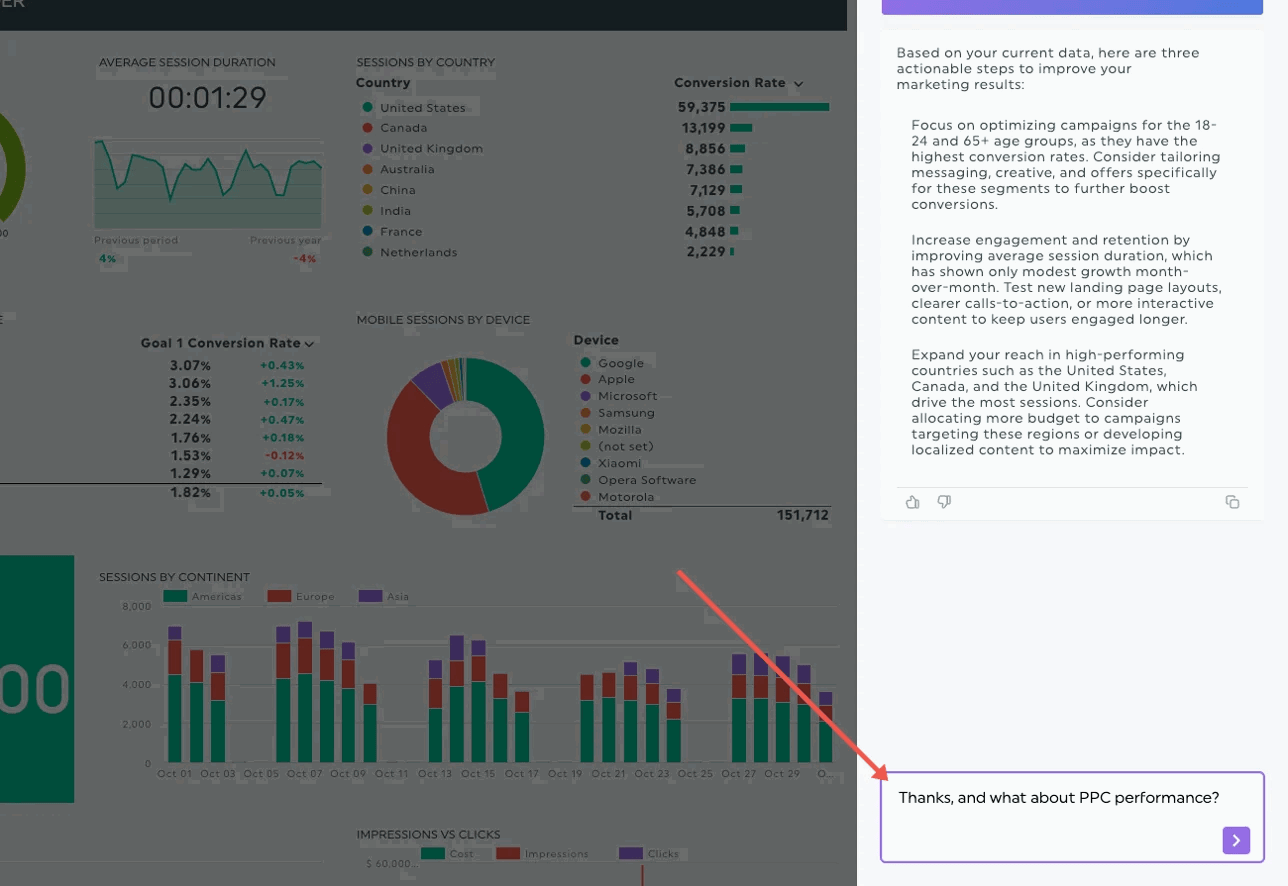
The AI Insights Pro add-on adds Chat Mode, where you ask questions about specific metrics, and Dashboard Context, which tunes insights to each client's goals and reporting style. Reddit Ads and Pinterest Ads integrations were added in 2026, broadening the PPC and social media channel coverage.
DashThis also has an MCP connector on every plan that lets Claude, ChatGPT, Gemini, GitHub Copilot and n8n read your dashboards. With your approval, it can write commentary into a dashboard comment box, create a dashboard or add a data source, but it can't delete anything.
White-label reporting is now included on every plan, including Individual: white-labeled dashboards, a custom domain, custom color themes, and your own email address for scheduled report delivery.
Key features:
- 30+ native integrations including Google Analytics, Google Ads, Meta, LinkedIn, TikTok, YouTube, HubSpot, and Ahrefs
- AI Insights on every plan, with chat in the AI Insights Pro add-on
- 50+ preset report templates and 1,000+ widget templates
- White-label reporting on every plan
- Custom domain and branded email delivery
- Automated email, PDF, and live link sharing
- CSV custom data import
- Calculated widgets and data source aggregation
- MCP connector for Claude, ChatGPT and Gemini
- Unlimited users on all plans
DashThis reviews from real users
“Very easy to use and visually appealing dashboard.” (Source)
“One downside is the pricing; it can be a bit steep for smaller teams. Also, some of the advanced features are a little tricky to set up without some prior knowledge.” (Source)
“The weakness of DashThis is that it requires knowledge of the other programs it's pulling information from. If someone on our team is unfamiliar with one of the programs that DashThis is presenting, it can lead to some reporting issues. So, it's more of a knowledge failing rather than a performance.” (Source)
DashThis pricing 2026
Every plan includes unlimited users, all 30+ integrations, white-labeled dashboards and the MCP connector, and you can try 10 dashboards free for 14 days. Each connected data account, such as a Google Analytics property or an ad account, counts as one source, no matter how many dashboards use it.
Plan | Billed annually | Billed monthly | Dashboards | Sources | What's included |
| Individual | $44/mo | $54/mo | 3 | 15 | AI Insights, MCP connector, white-labeled dashboards, custom domain and email, calculated widgets, automated email, link sharing, PDF export |
| Professional | $139/mo | $164/mo | 10 | 40 | Same features as Individual |
| Business | $279/mo | $324/mo | 25 | 100 | Everything in Professional plus priority support |
| Standard | From $429/mo | From $499/mo | 50 to 1,500+ | 200+ | Everything in Business, scaled to your dashboard and source count |
| AI Insights Pro (add-on) | $15/mo | $19/mo | n/a | n/a | Chat Mode and Dashboard Context for AI Insights |
2. Whatagraph
Best for: Mid-size marketing agencies and multi-location operators running multi-channel campaigns for 10+ clients that have outgrown AgencyAnalytics
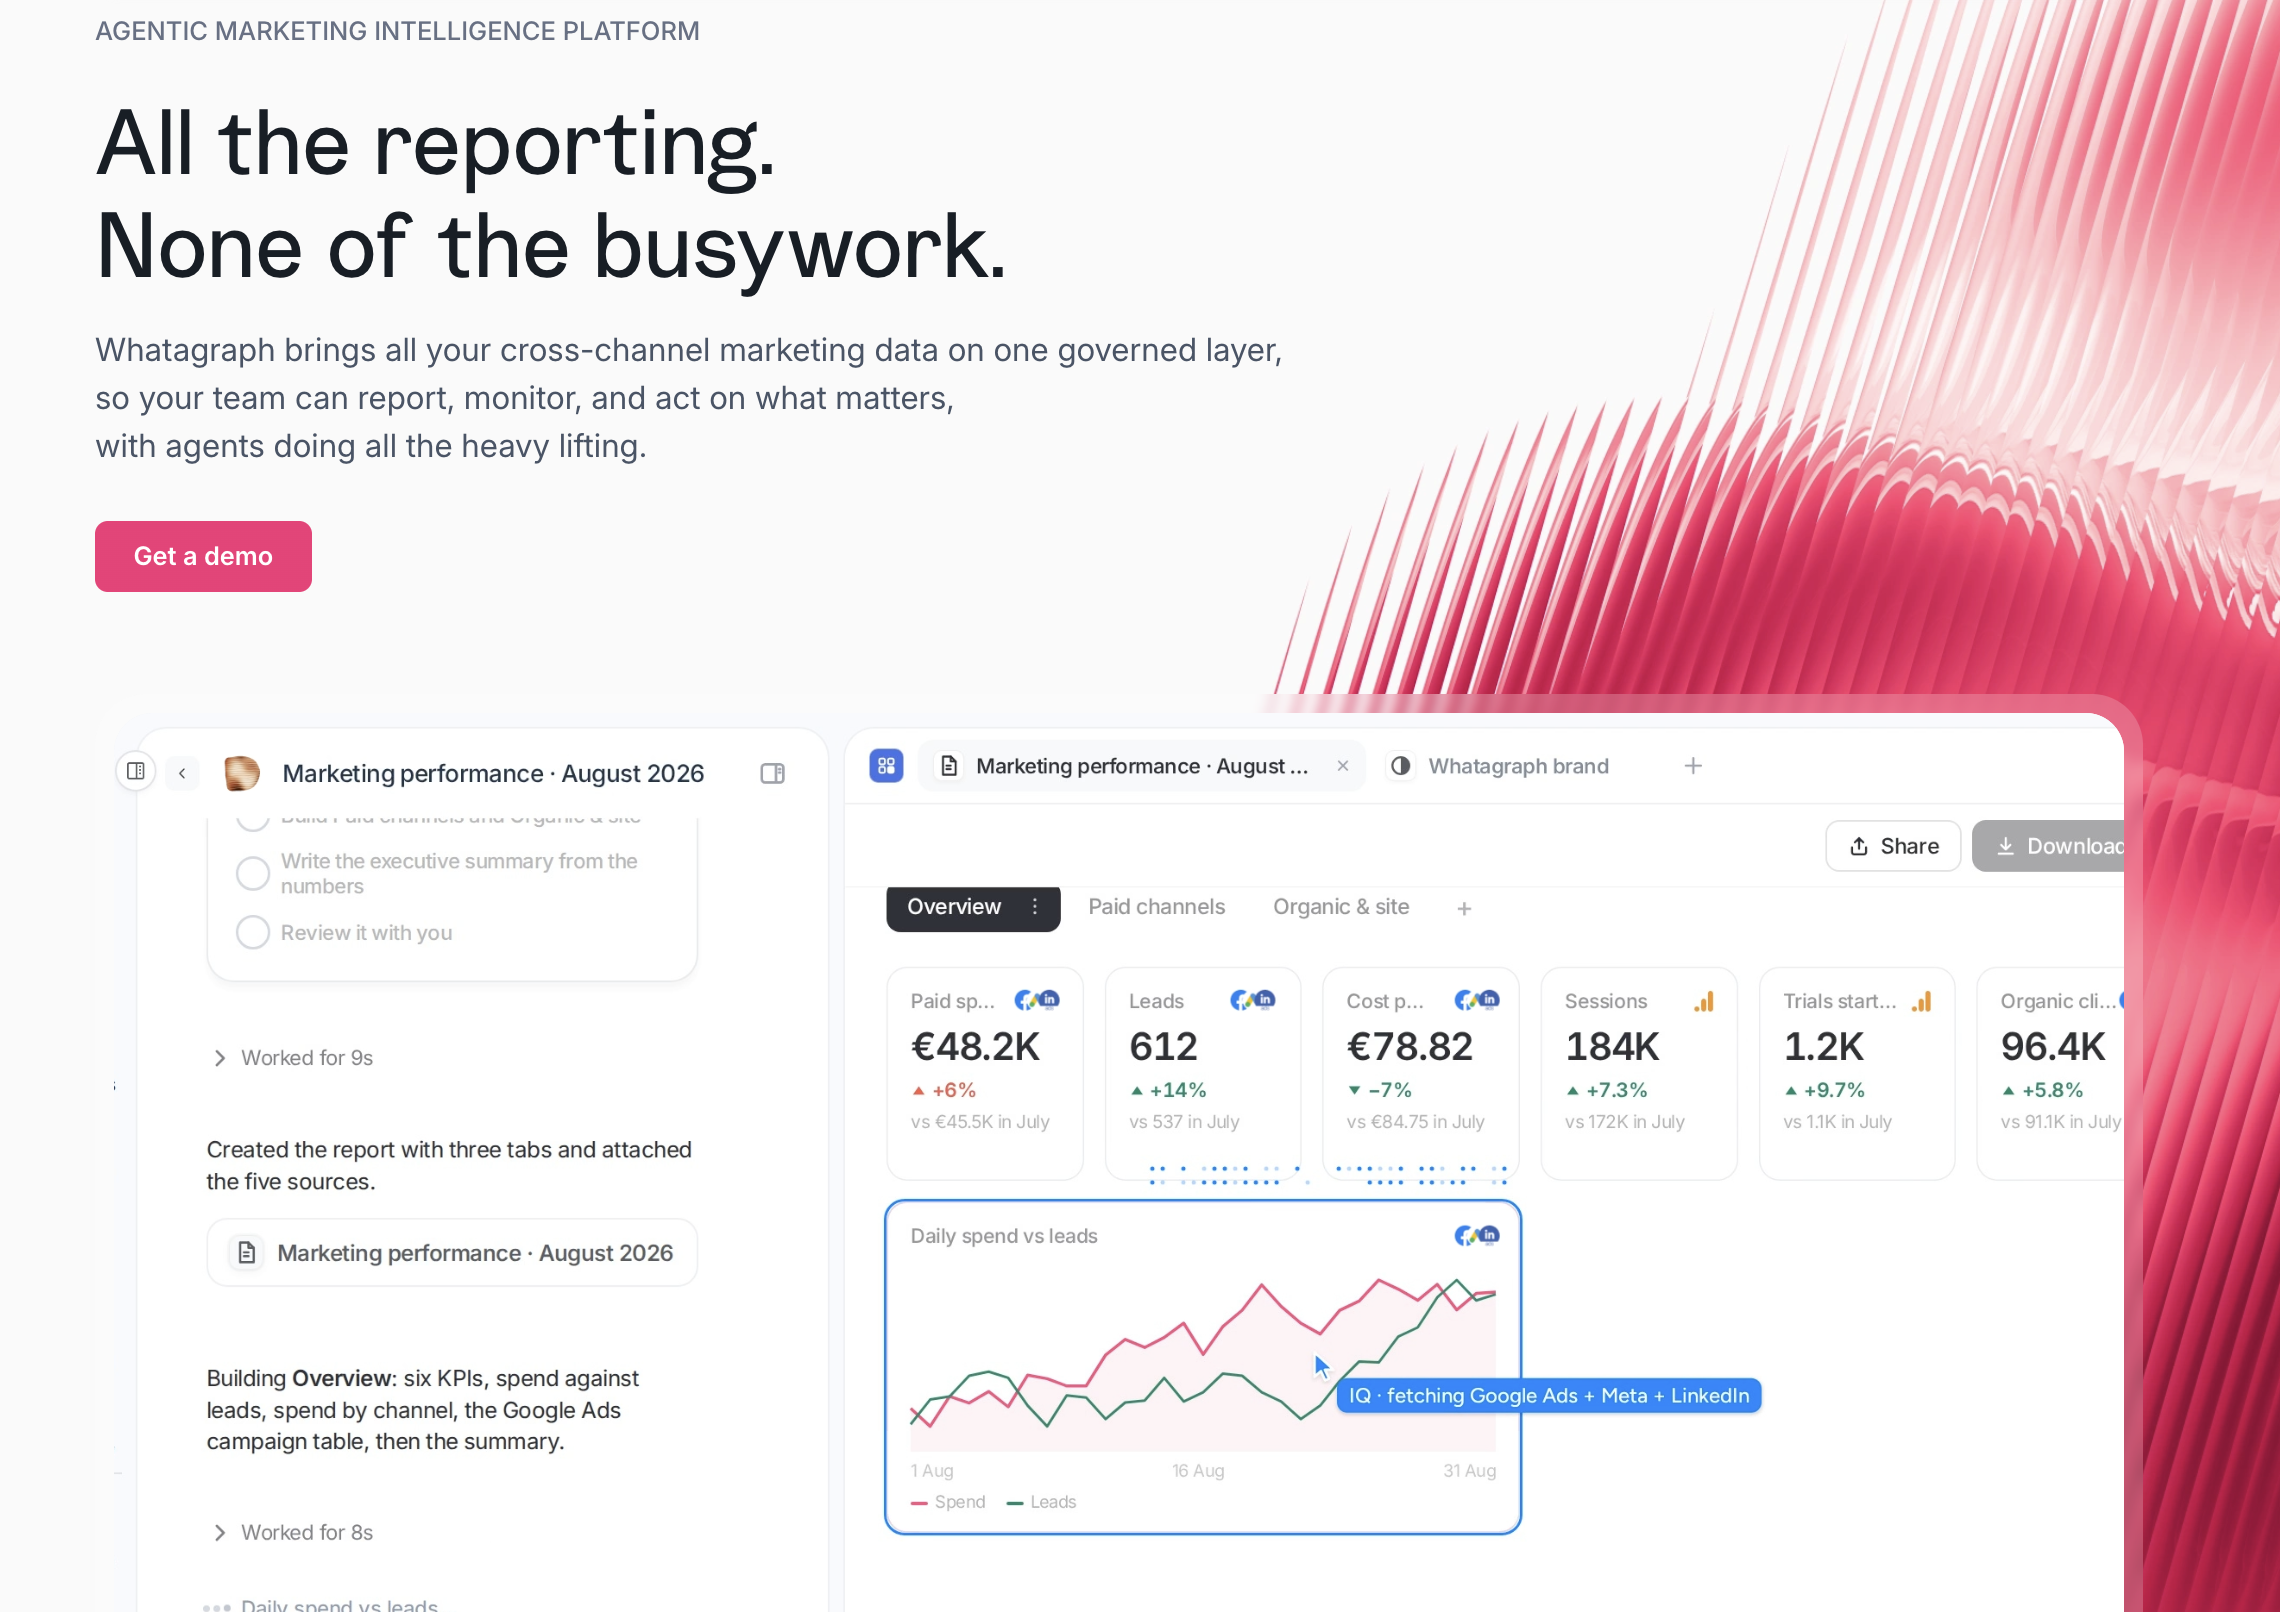
If you’re switching from AgencyAnalytics because sources kept disconnecting, reports felt rigid, or pricing jumped without warning, Whatagraph is built for exactly that problem.
Whatagraph is an agentic marketing intelligence platform built for agencies reporting at scale. Everything runs on one governed data foundation: you define each metric once, and the same numbers power your client reports, dashboards, and AI tools.
On top of that foundation, IQ Agents do the busywork for your team, from connecting sources and building reports to monitoring accounts and drafting commentary.
Here's how it works:
1. Bring data from 60+ marketing platforms via fully managed native connectors: Unlike AgencyAnalytics, where users report sources disconnecting due to bandwidth issues and platforms like TikTok and X causing data discrepancies, Whatagraph's integrations are maintained by our Product engineers, so bugs get resolved without a third-party company involved.
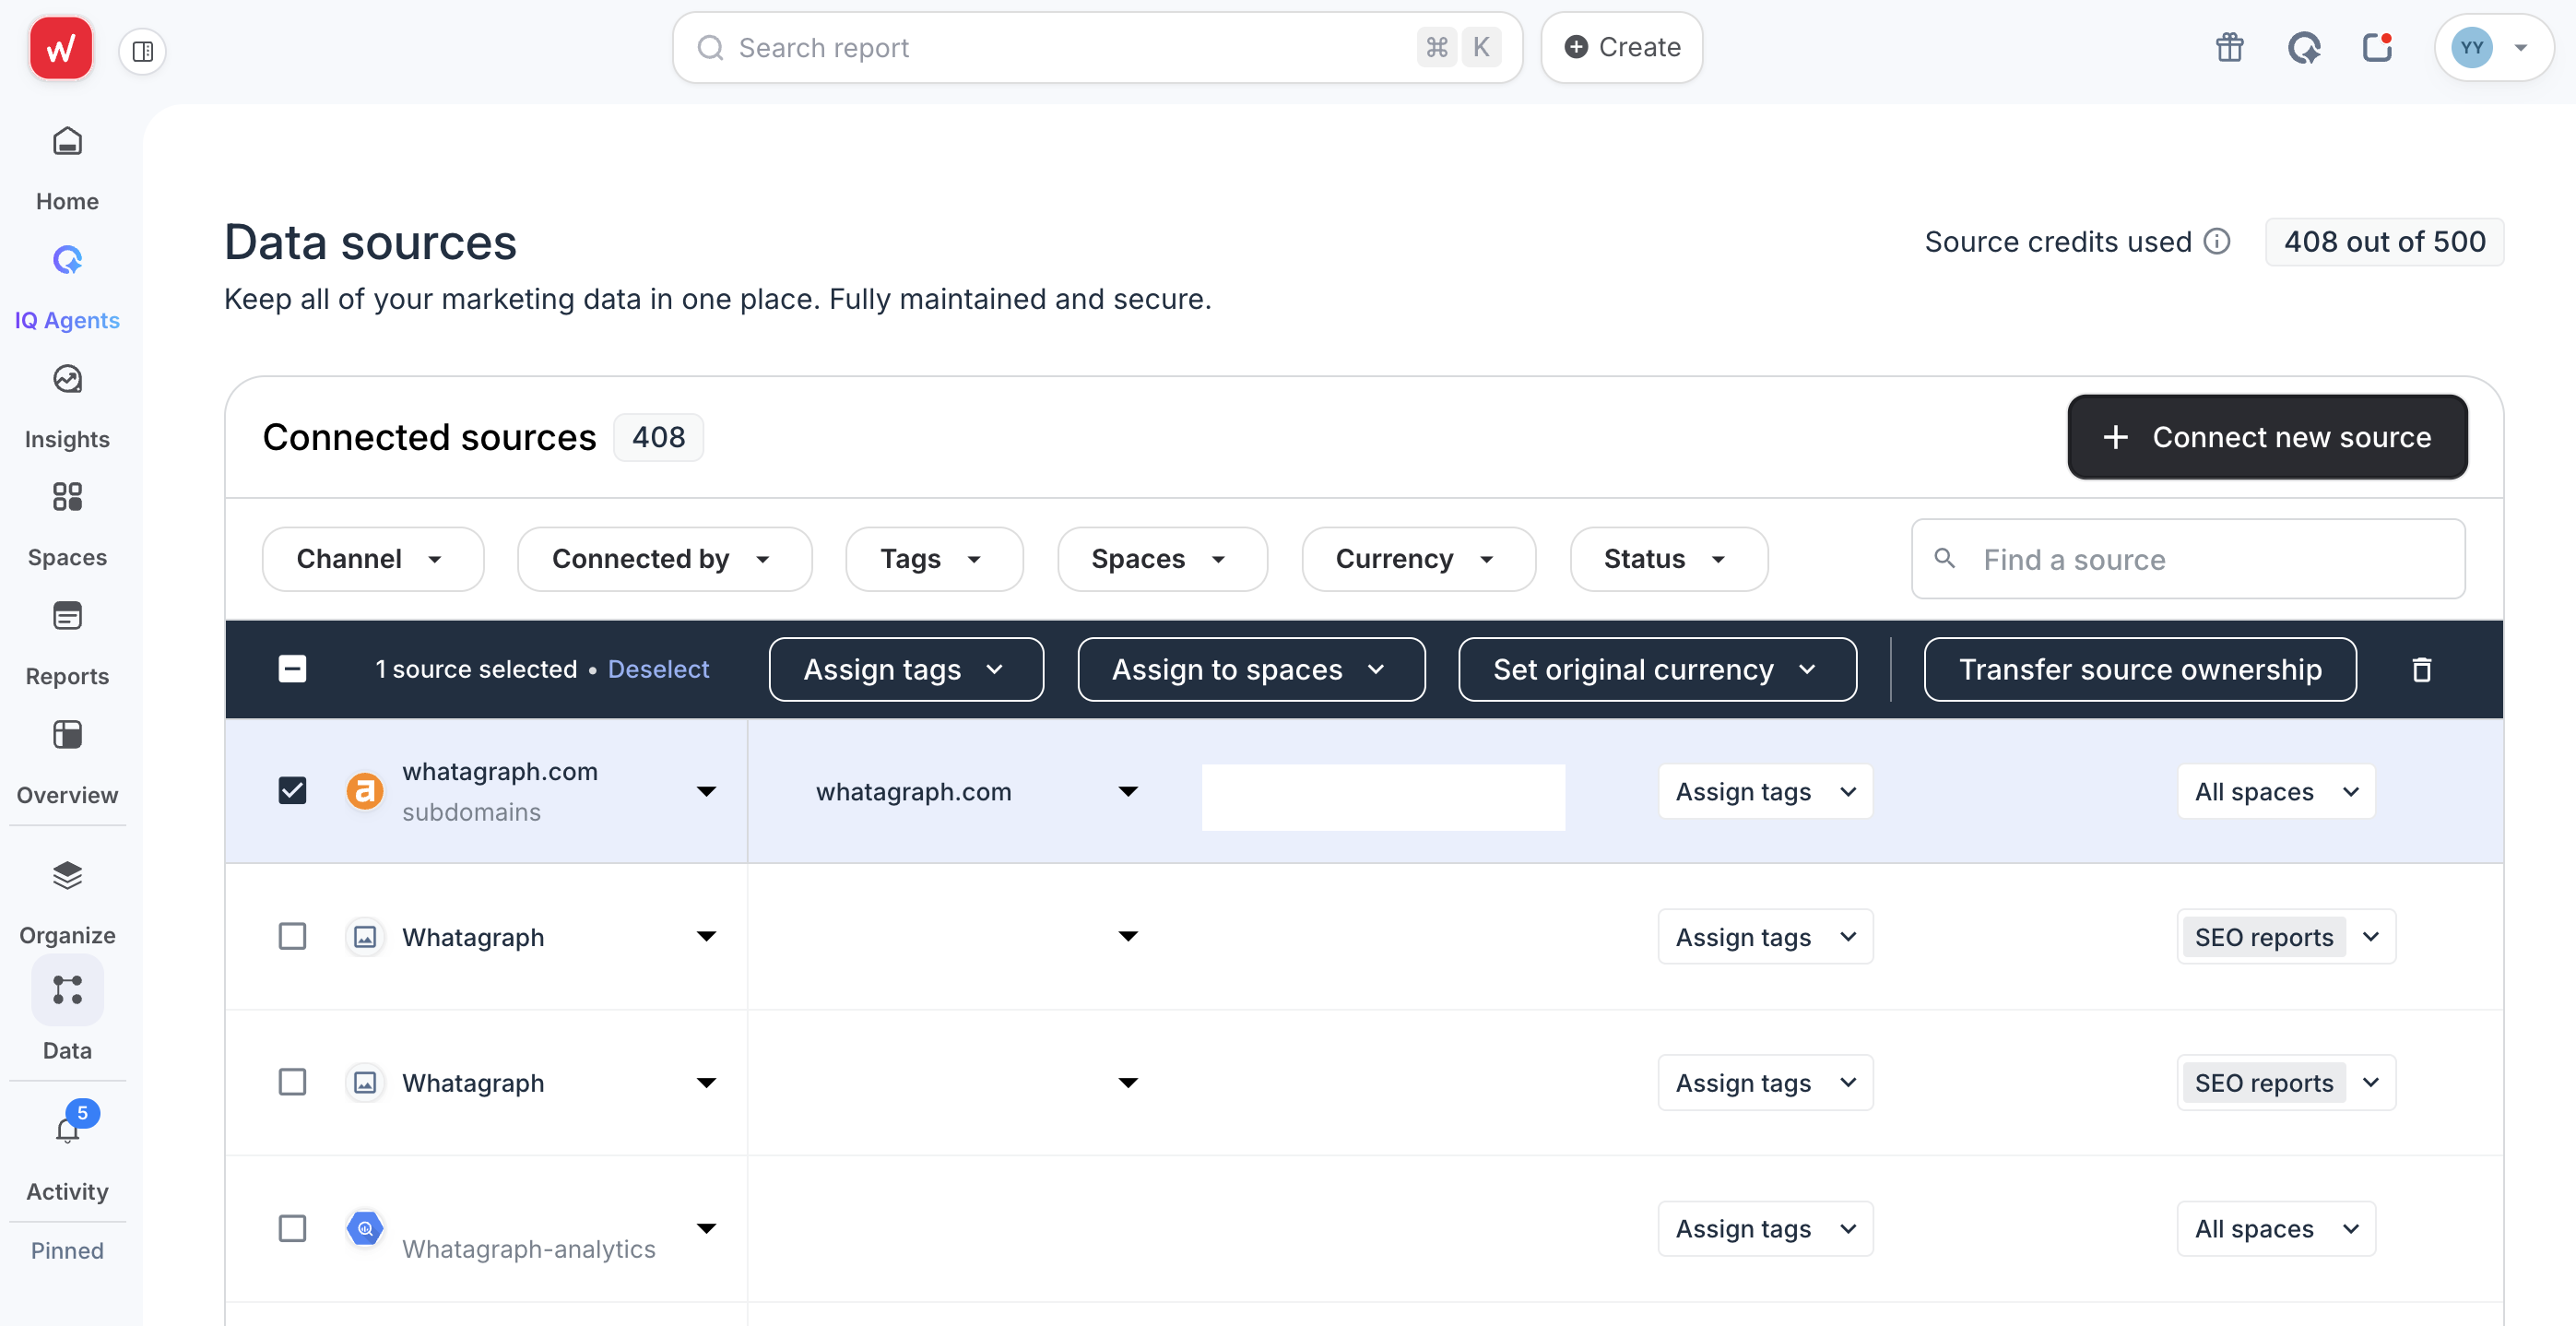
If a platform you need doesn't have a native connector, you can build a custom API integration with agents in plain language. Share the tool's API key and a link to its API docs, approve the plan before anything goes live, and check the numbers against the tool. You can also ask agents to connect and tag your sources for you.
For example, Anna Alexiadi Smyrniotaki, Director of Digital Analytics & Strategy at GKV agency, wanted data from Cognizo, an AI search visibility tool, in her reports. She gave an agent the API key, a few instructions and a link to the API docs, and the agent built the integration in 9 minutes.
Whatagraph has averaged 99.95% uptime over the past six months, and even reports with heavy widgets and multiple tabs load in under 10 seconds.
Tanja Keglić, Performance Marketing Manager at Achtzehn Grad agency says:
“We don’t have any connection issues on Whatagraph at all. We just connected the platforms once, and that was it. Whatagraph is very, very quick when loading the data.”
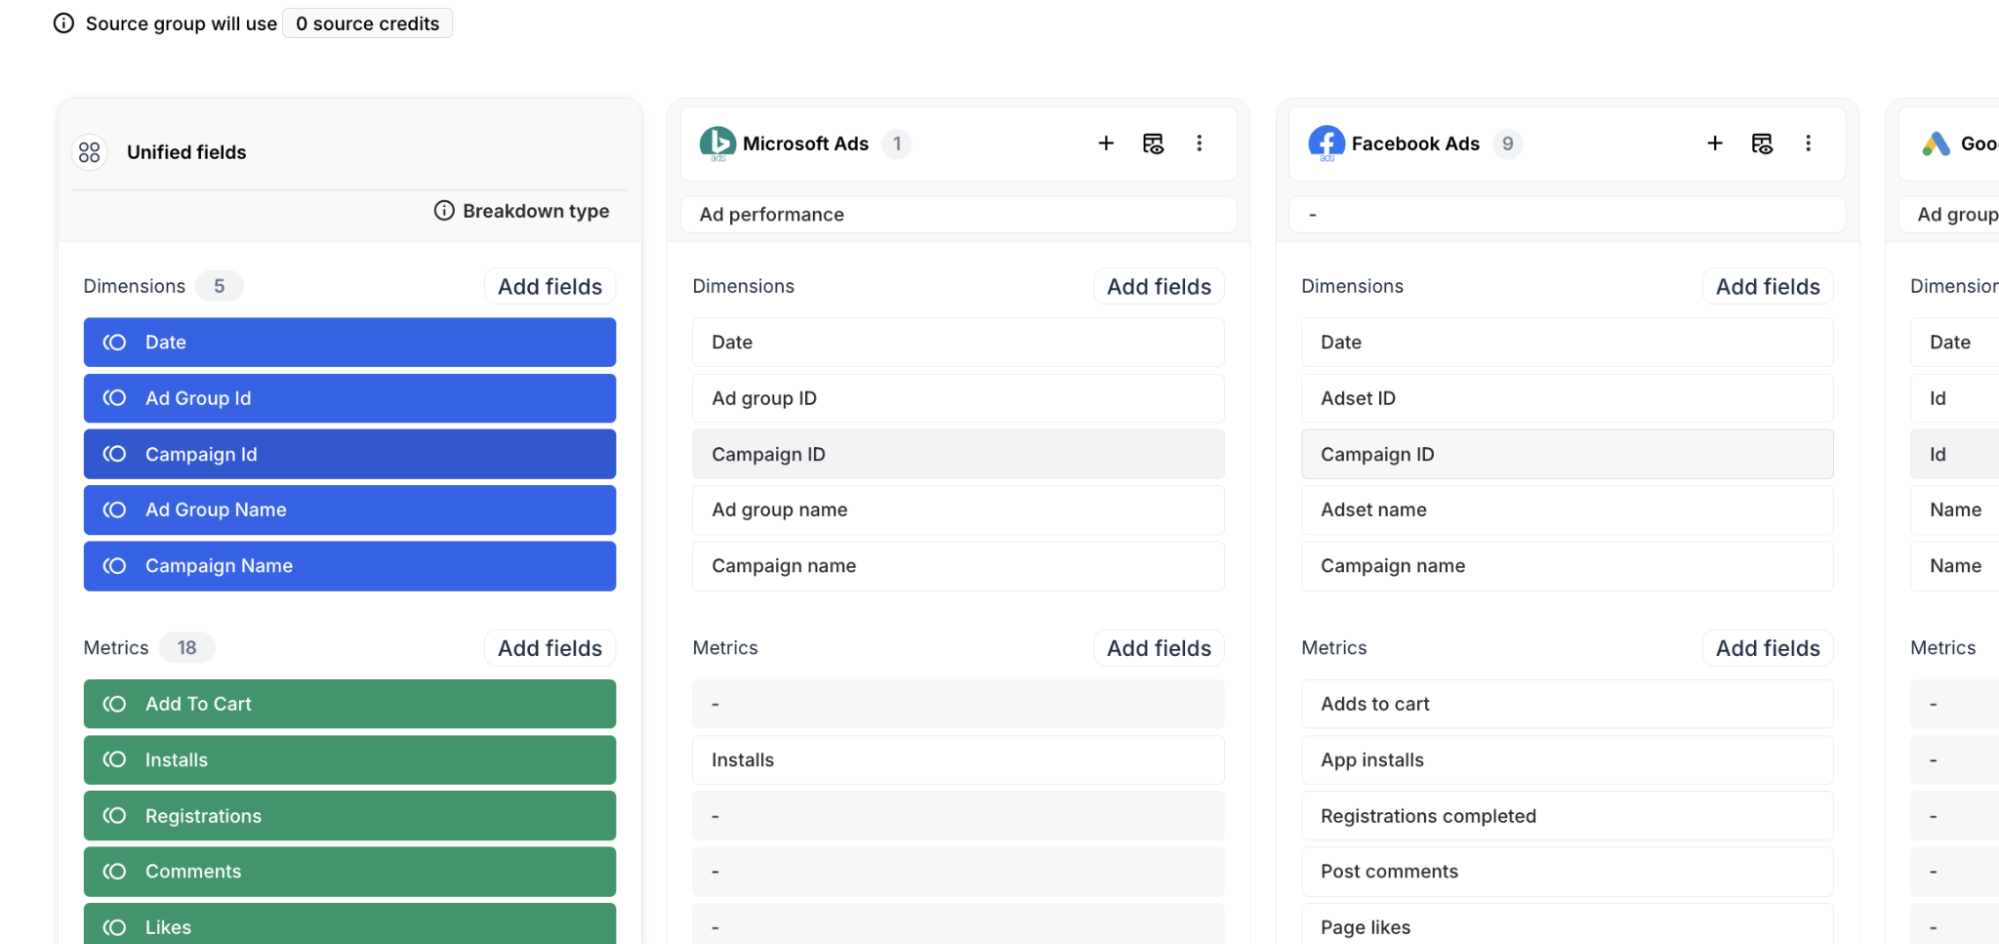
2. Organize and normalize your data: Build custom blends, metrics, and dimensions, or let IQ Agents build them for you from a plain-language prompt.
Define your metrics, blends, custom dimensions, and aggregation rules once, and they propagate to every report, dashboard, and downstream system automatically.
With agents, you describe what your cross-channel data needs, and they build your data foundation for you while your team signs off the definitions. Agents can:
- Blend sources across channels, like Facebook and Instagram reach in one view, joined on date
- Group many accounts into one source, like every Google Ads account a client has
- Create custom metrics, like blended ROAS or gross spend
- Standardize campaign names into consistent dimensions, like region, product and objective
Before creating a new metric, agents check whether an equivalent already exists, so you don't end up with four versions of ROAS.
Ex-AgencyAnalytics users also love Whatagraph’s Source Filter is a standout: instead of applying the same filter to 20 individual widgets, you apply it once at the source level and it cascades to every widget instantly.
3. Analyze your data with Claude or ChatGPT through Whatagraph MCP: Whatagraph MCP connects Claude or ChatGPT directly to your governed data layer. Your custom metrics, blends, dimensions, and cross-channel definitions are already built in.
Ask "what's blended ROAS across all clients this month?" and the answer matches what's in your client reports, because it comes from the same place. The number your AI assistant gives you on Monday means the same thing it means on Friday.

4. Report with AI: Ask IQ Agents in plain language to build a complete report from scratch, based on your connected sources and a previous client report or one of 80+ pre-made report templates. Try this prompt:
Create a monthly marketing report for Google Ads, Meta Ads, and LinkedIn Ads with sample data using one of the report templates available in Whatagraph
Because it's a cross-channel analytics report, the agent took about 11 minutes:
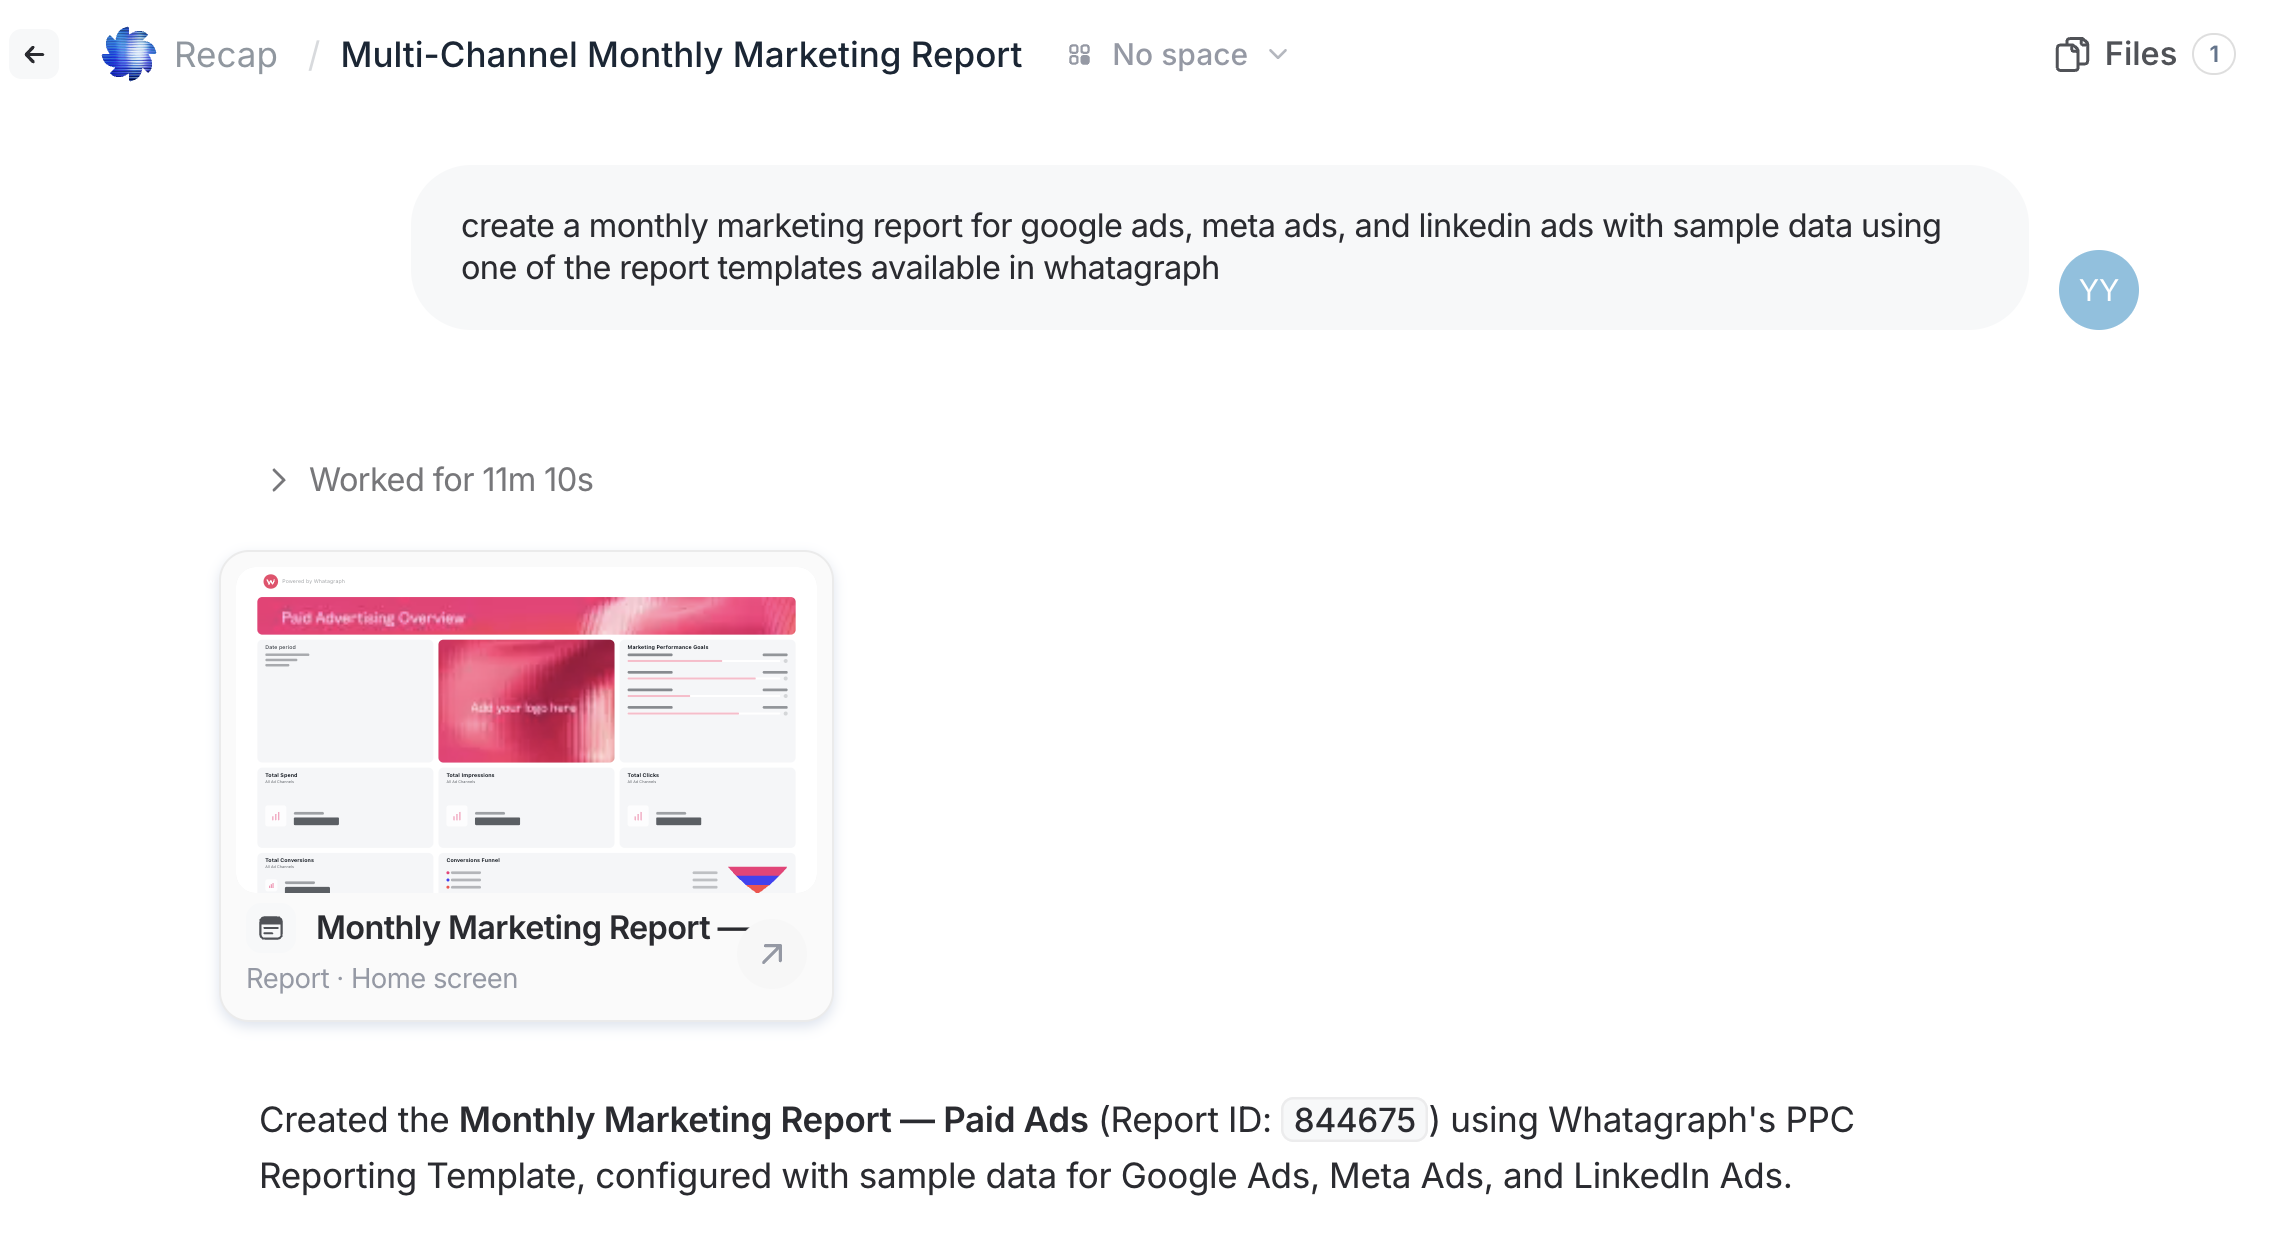
And here's what the report looks like:
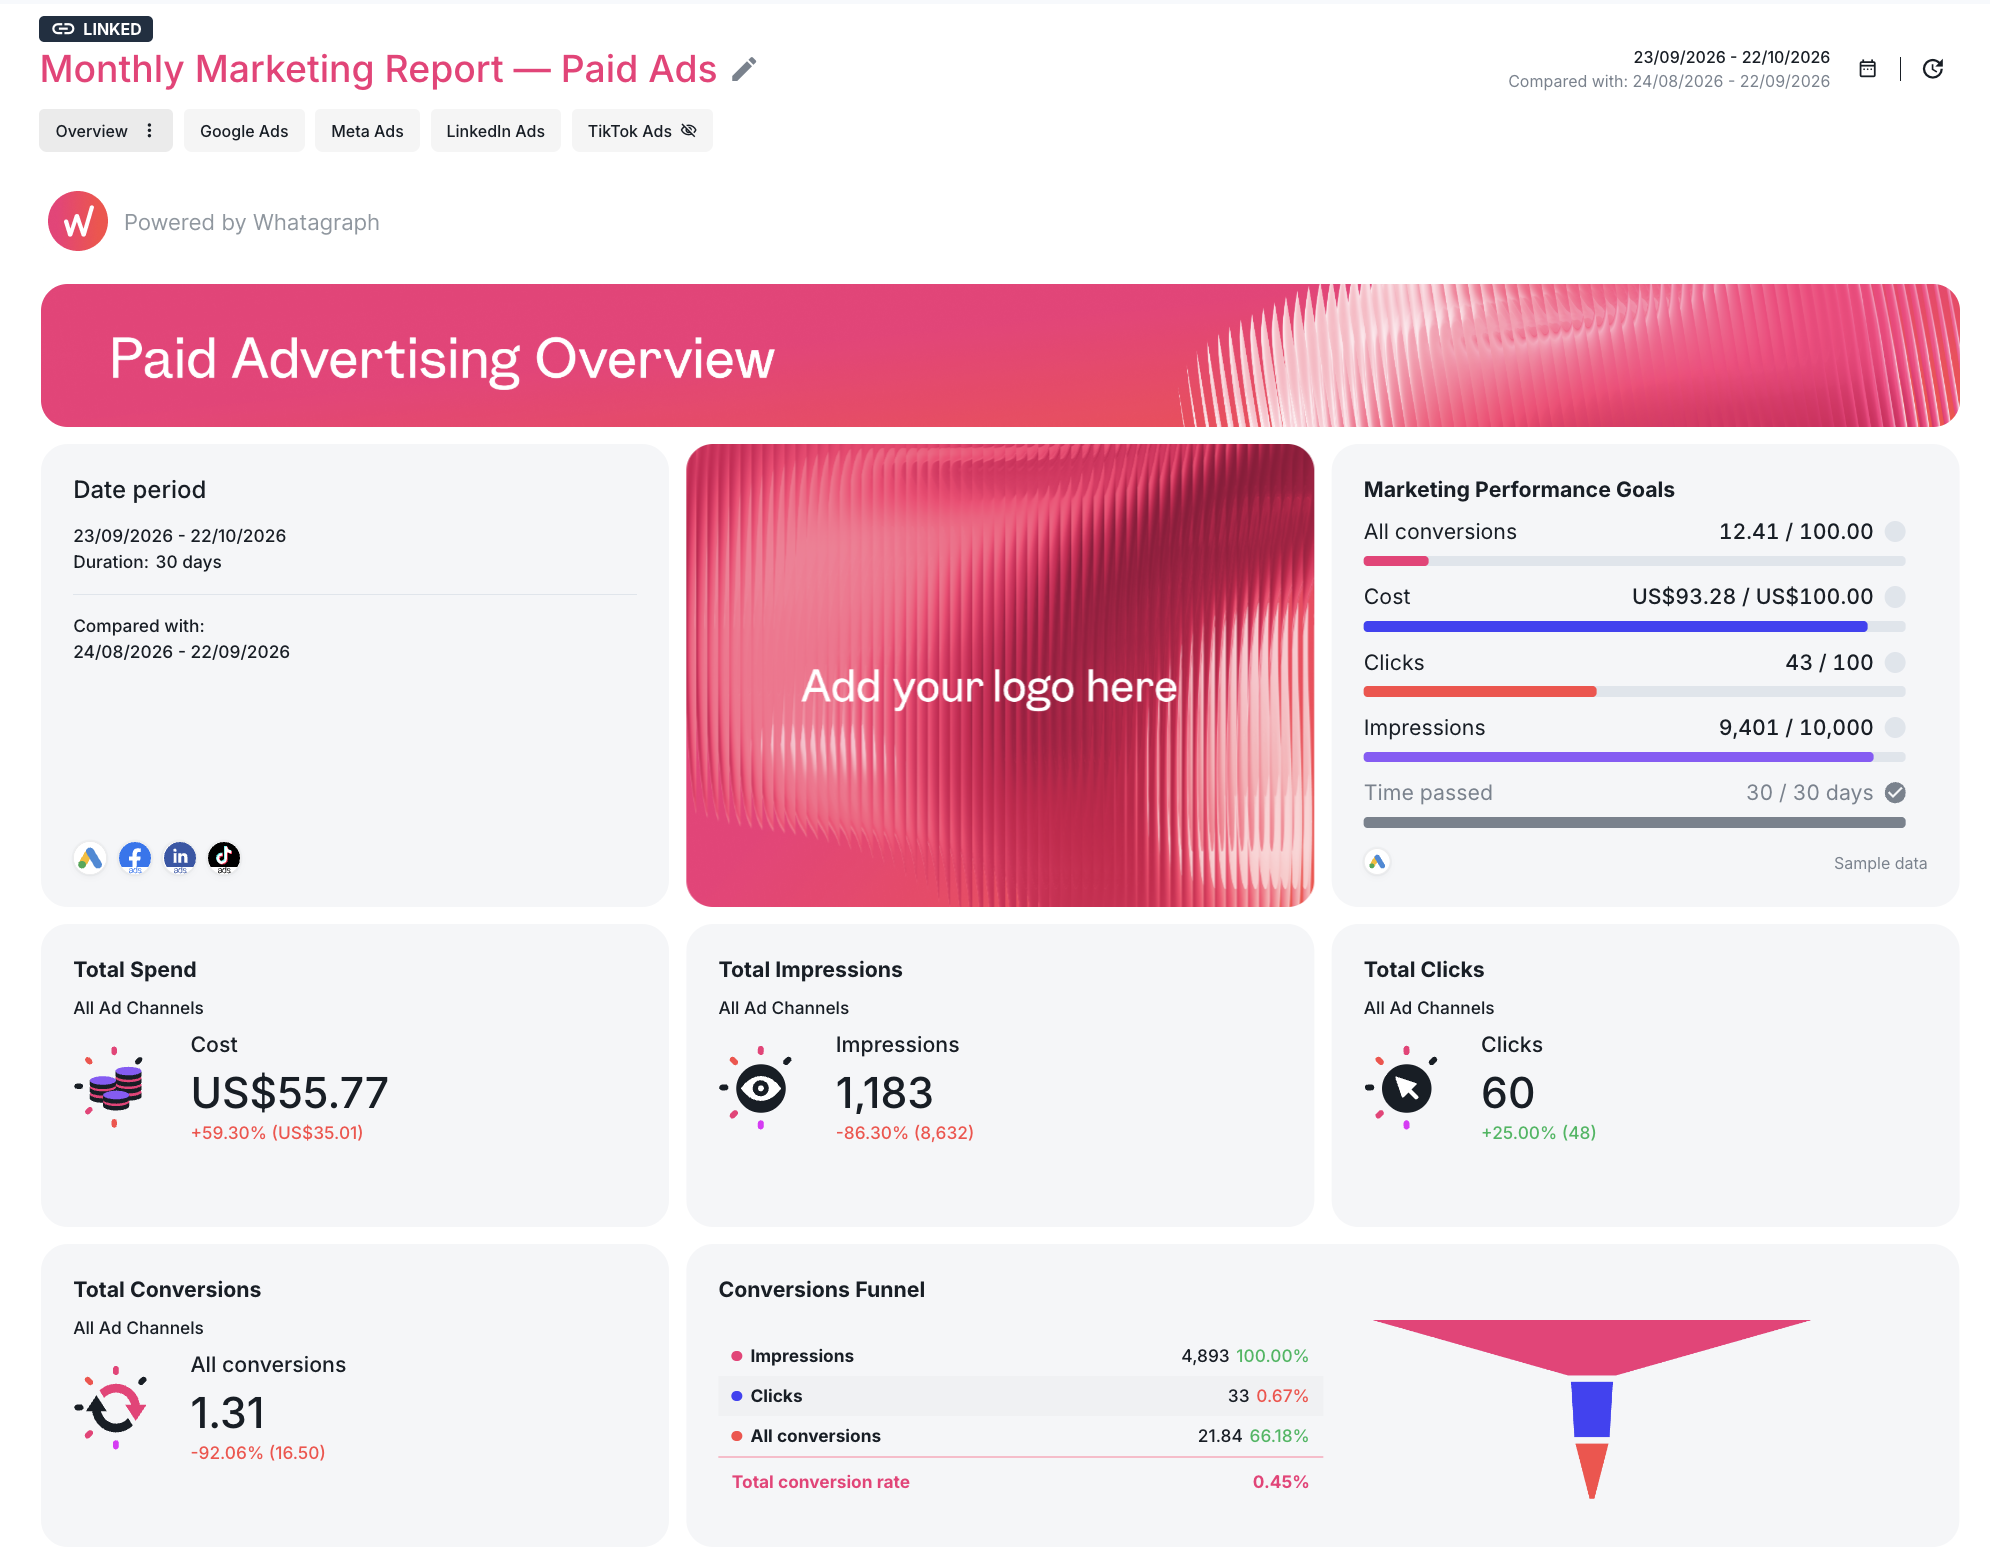
Check out the full report here.
Tweak the report as you like, then ask the agent to build it on schedule with updated data every week or month.
Agents also write the first draft of your report commentary. They read your marketing data, follow the style of your previous reports and your brand guidelines, and bring in external context through web research, like PPC benchmarks or the latest industry news. Your specialists then review the draft, add the business context only they know, and sign off before the report reaches the client.
5. Automate reporting: Set scheduled reports on autopilot. Send live links, PDFs, or scheduled emails. Export to Google Sheets, Excel, and CSV. Or sync data directly to BigQuery and Looker Studio.
Every report can be scheduled to update and arrive in a client's inbox automatically, but we recommend keeping a person in the loop to review each report before it goes out.
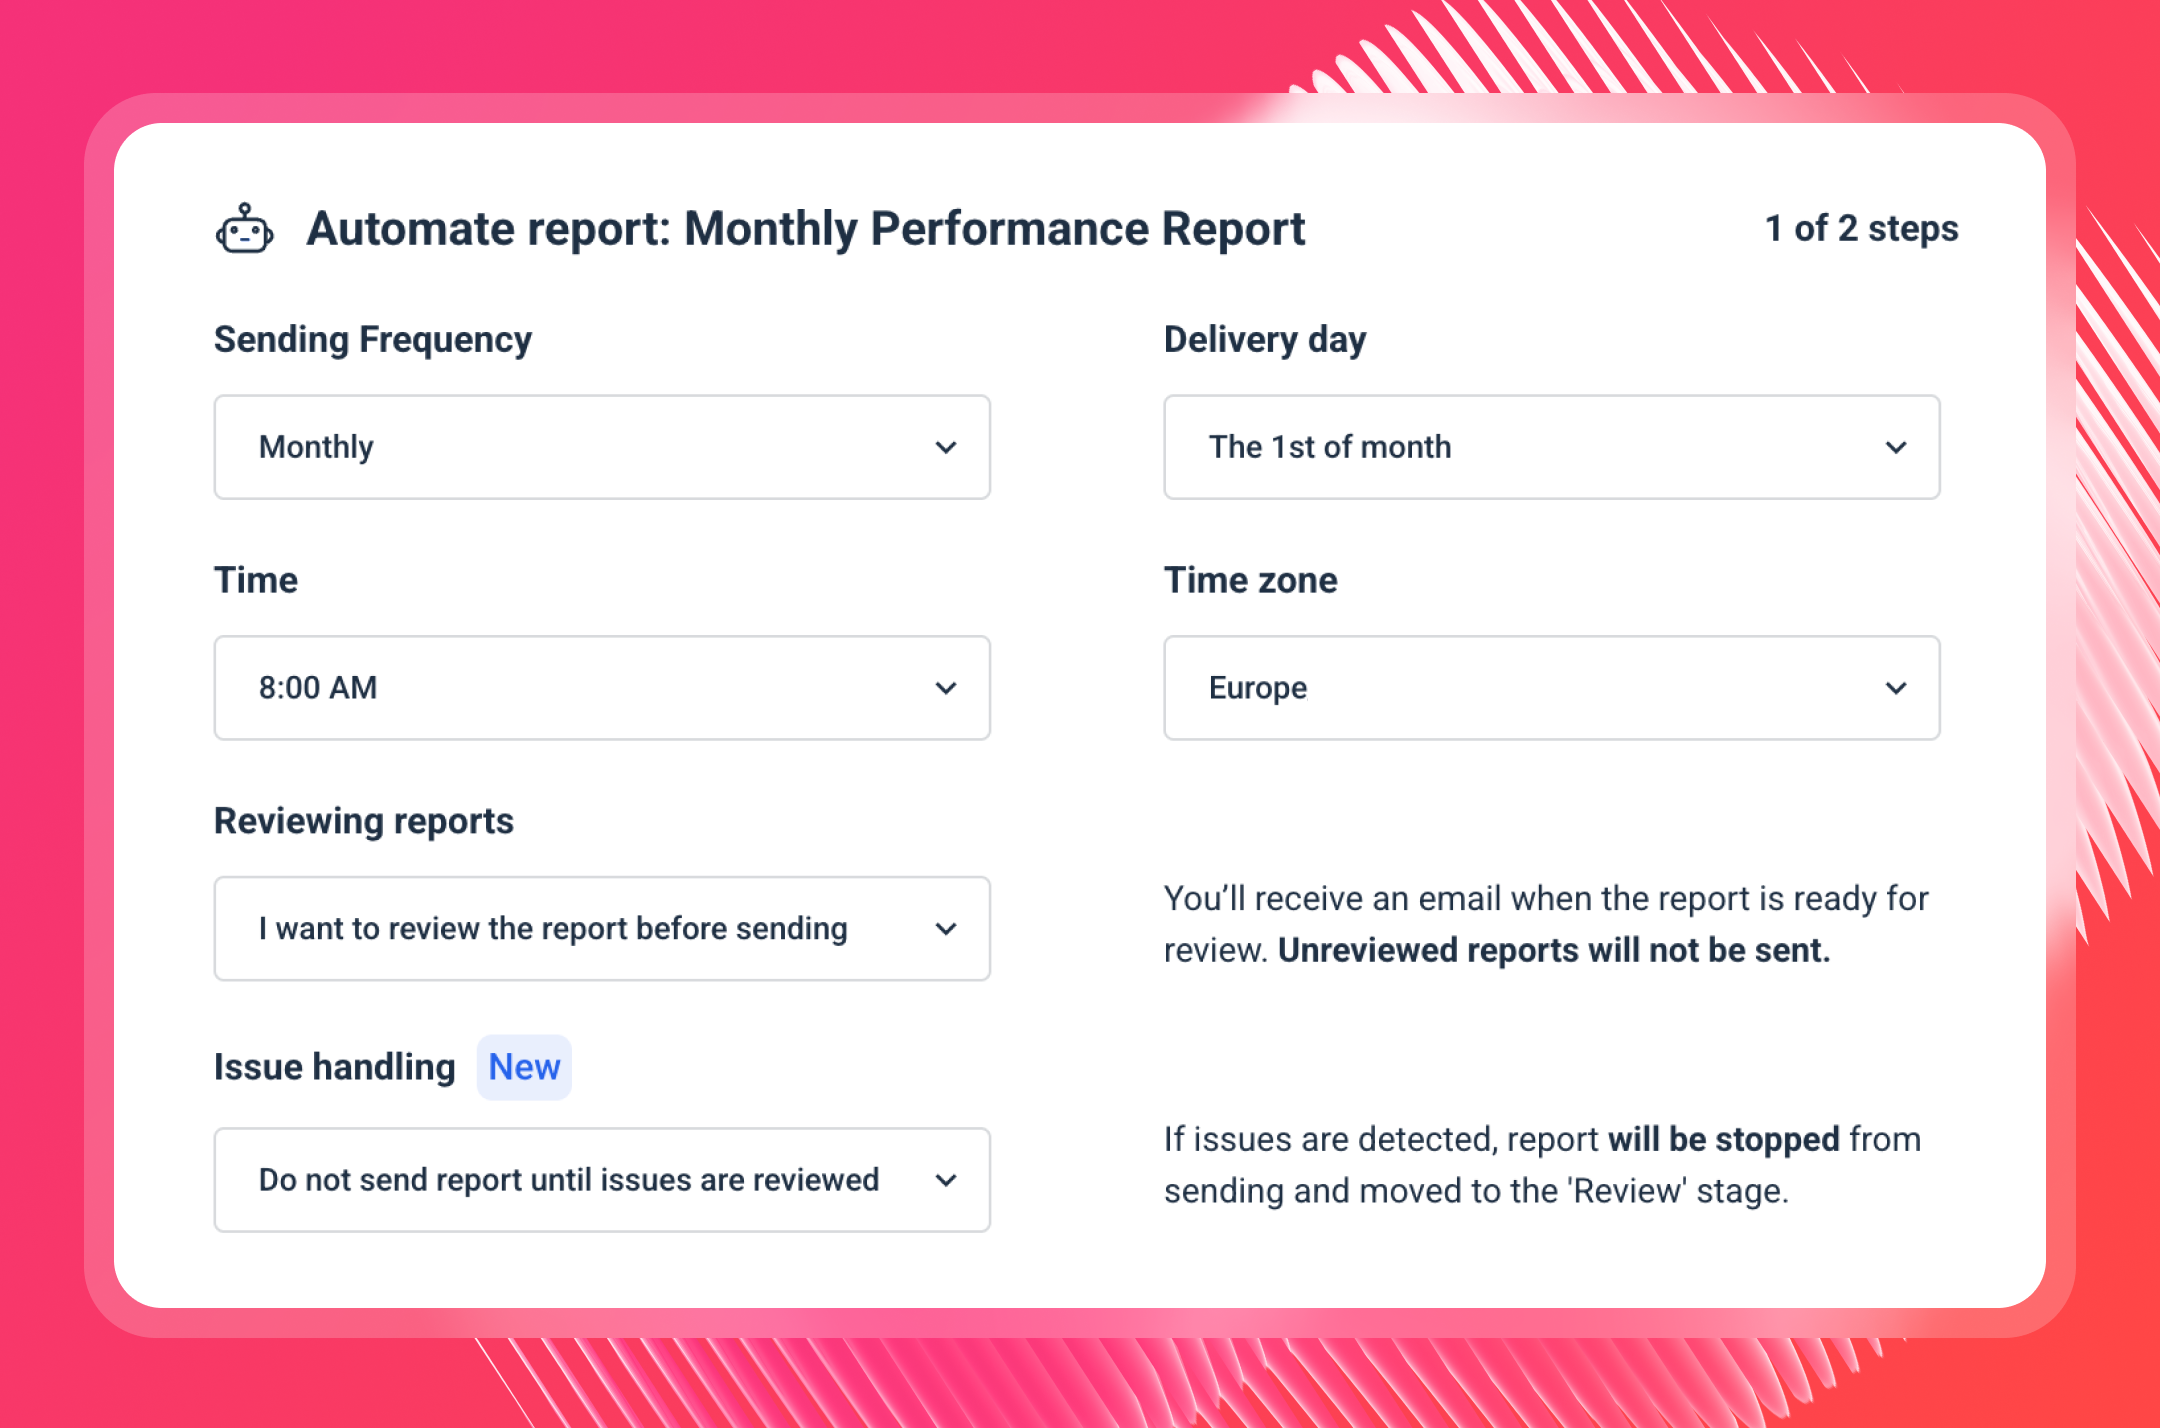
Agents can also turn your reports into marketing decks in PowerPoint, Gamma or HTML. You can share reports, decks or any data visualization as links, with password protection and scoped permissions.
6. Scale without adding headcount: Manage dozens of clients with Spaces, Overviews, and client-facing filters. With Custom Tags, label sources by region, account manager, or industry and pull up "all Tier 1 accounts" or "accounts managed by John" in one view.
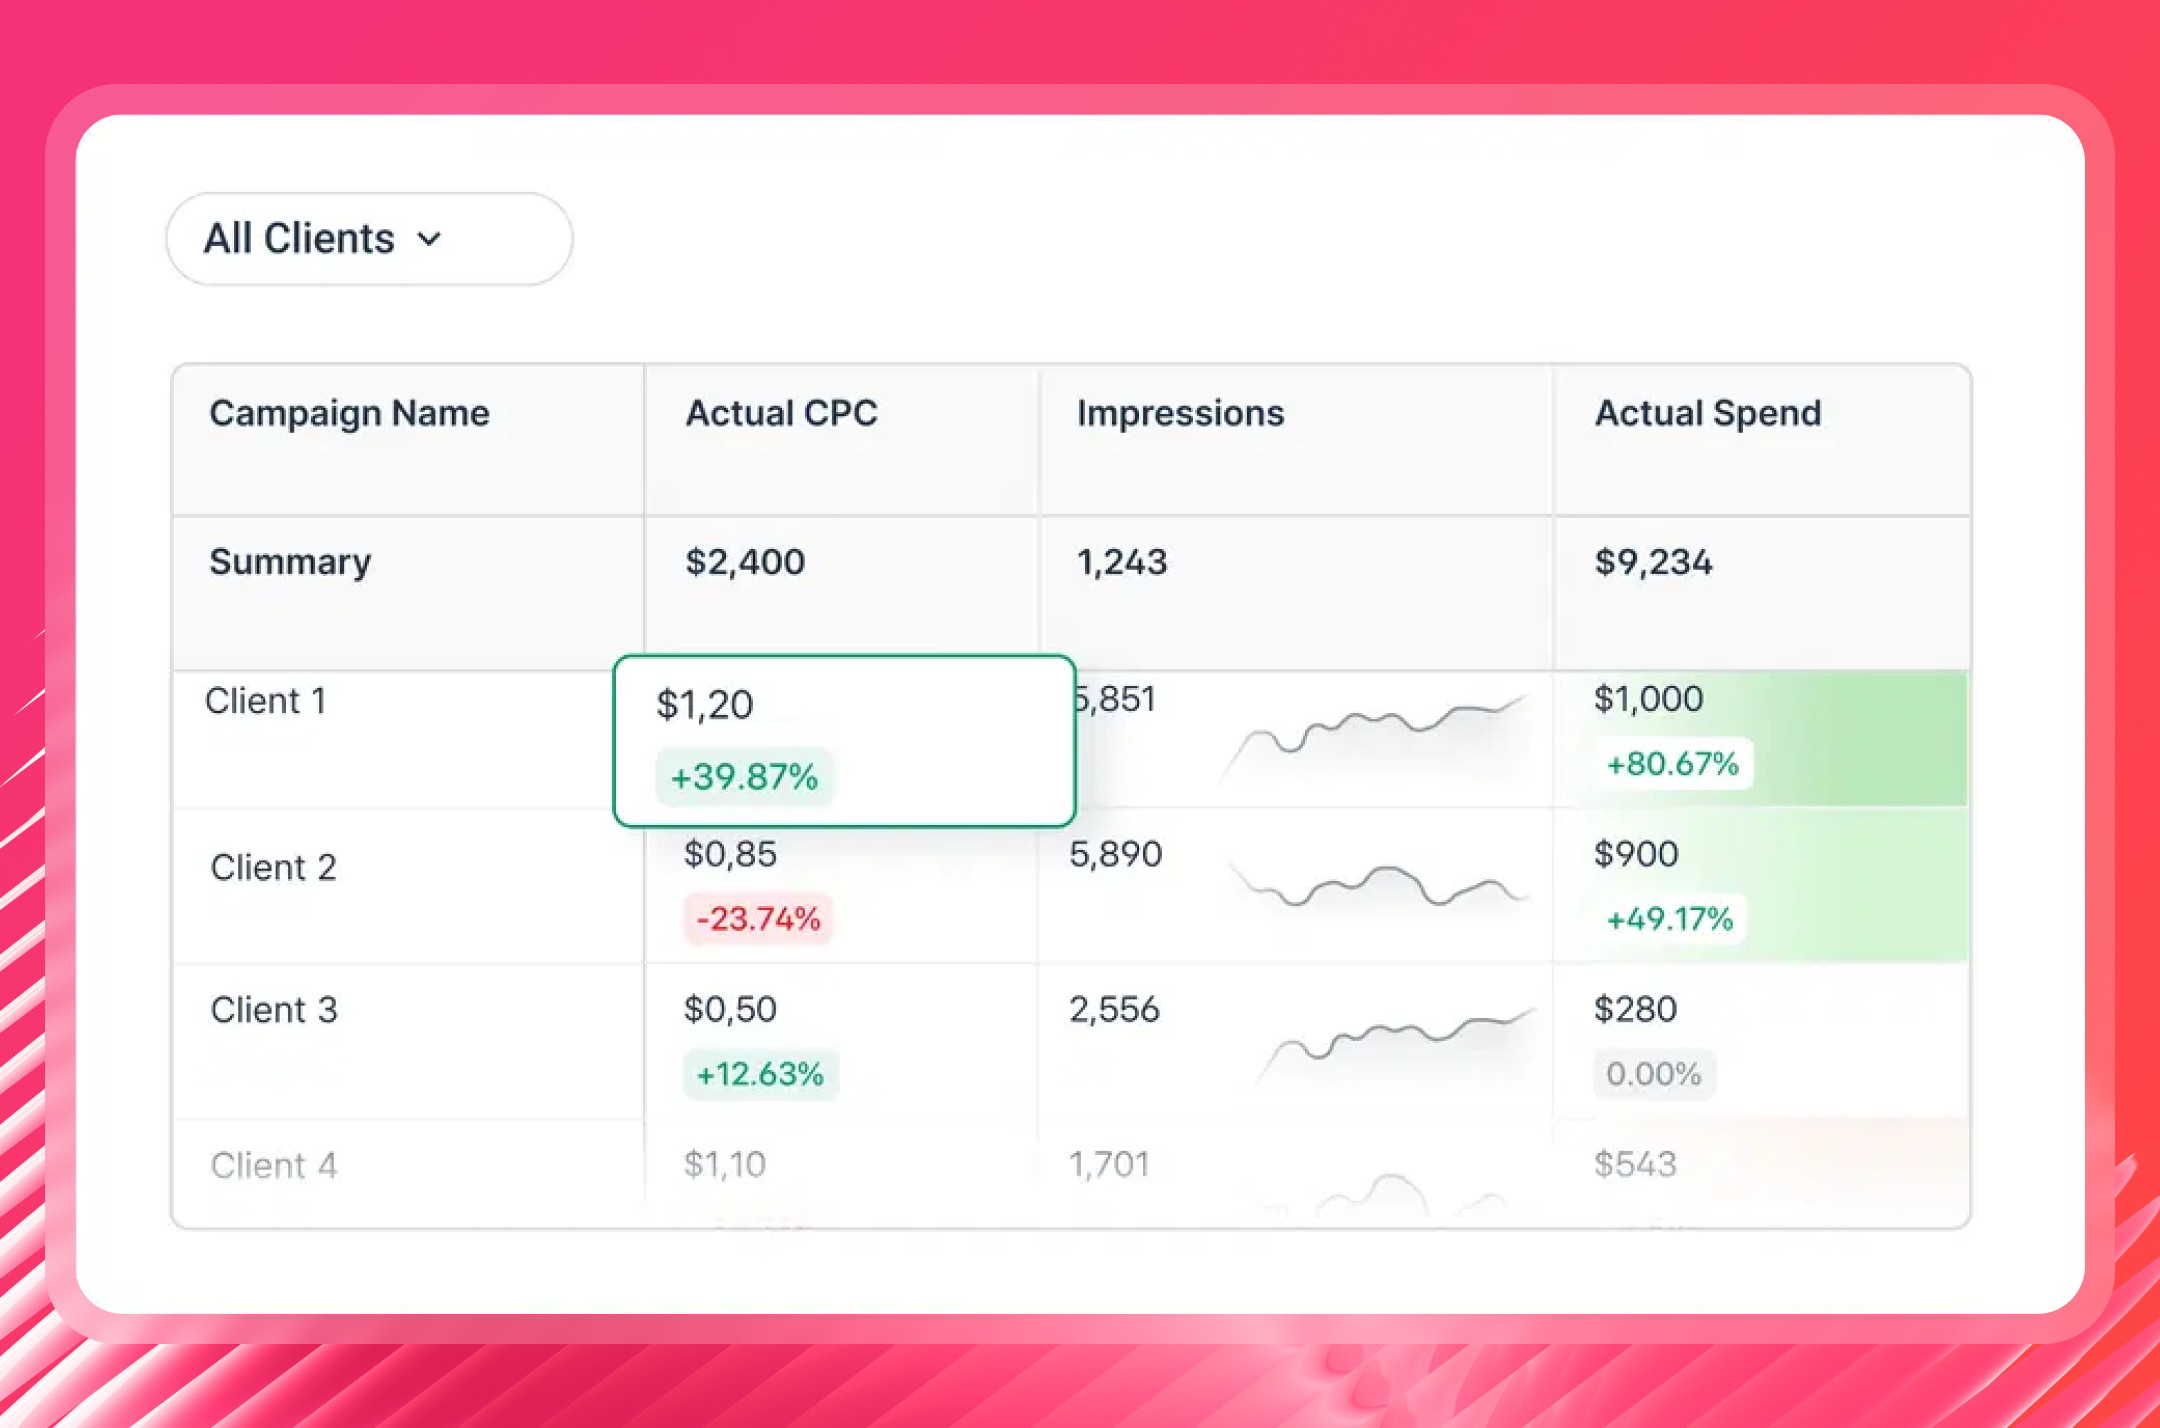
With linked templates, edit one master report and changes cascade across every client report at once. That's the functionality agencies growing past 20 clients need most.
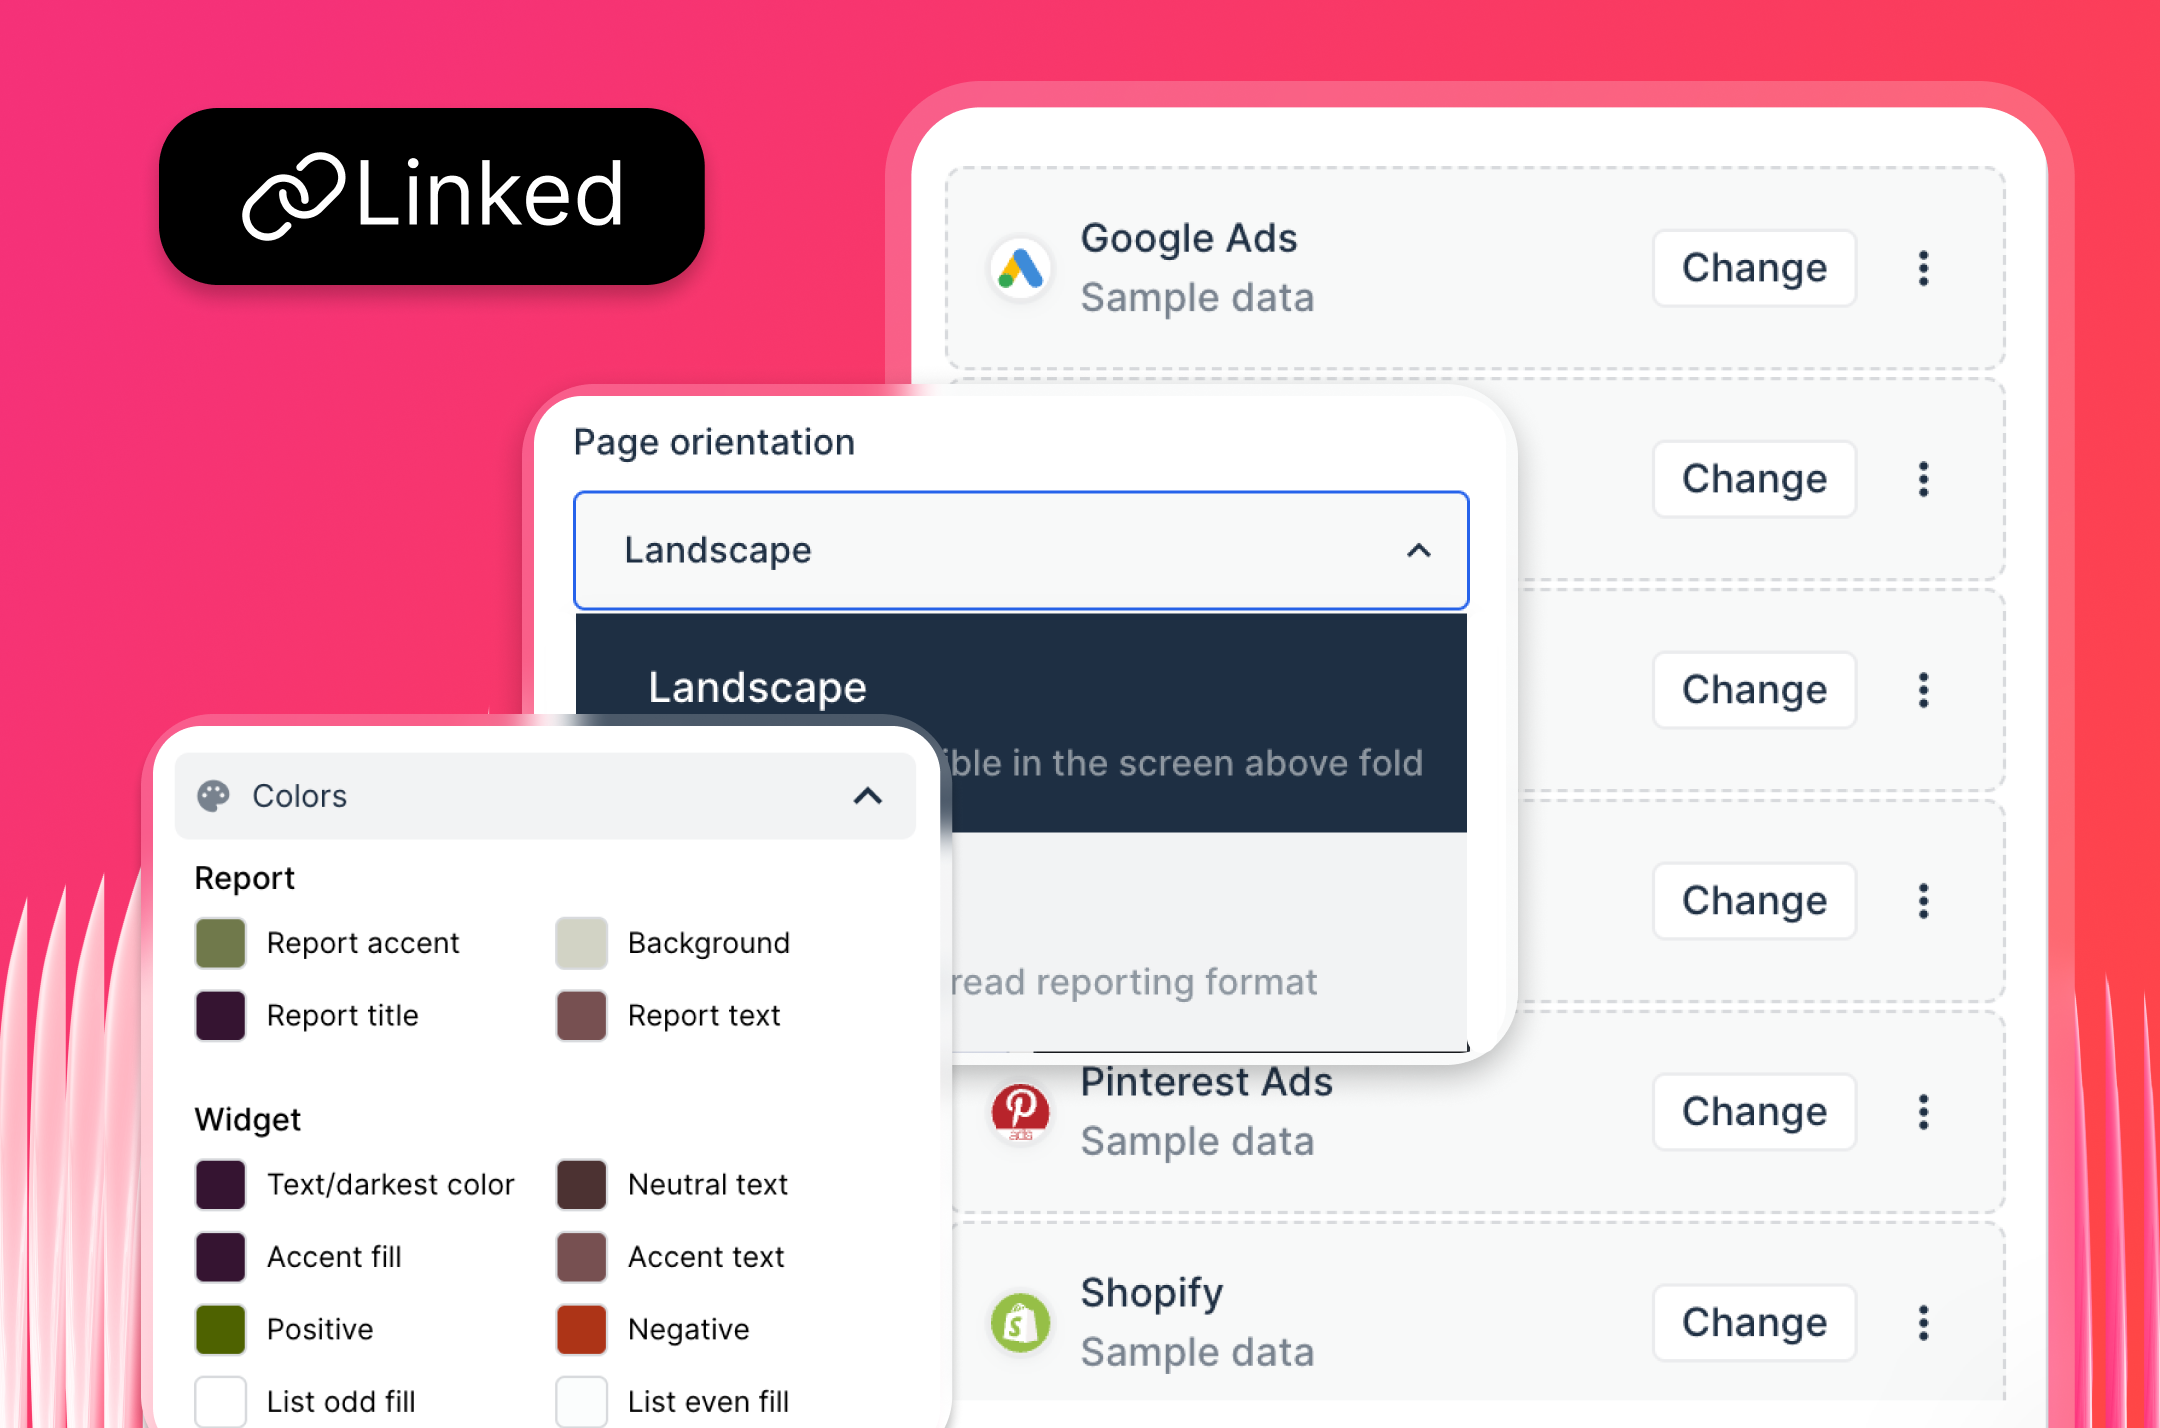
IQ Agents are also multiplayer by default, so everything is shared across your organization:
- Custom agents: when one team member builds an agent, everyone else on the team can use it right away.
- Conversations: anyone can open a conversation, see how a result was produced, and step in to talk to the same agent.
- Connections: connect a tool once and the whole team can use it, including people without a seat in that tool.
- Setup: instructions, knowledge and memory don't live in one person's account, so your agents keep working even when the person who built them leaves.
Thanks to these powerful AI features and an easy-to-use interface, agencies like Maatwerk Online are saving 100 hours a month on reporting. Here’s what Lars Maat, Co-Founder, says:
“Whatagraph’s AI saves time and energy for our marketing specialists. And the hours we’re saving is just pure profit. We now have the time to focus on more strategic things that help both our agency and our clients grow.”
Pro tip: If you're frustrated with StackAdapt connector issues on AgencyAnalytics, Whatagraph’s direct StackAdapt integration is designed to be "self-healing," meaning they automatically adjust to platform updates without breaking your reports.
Whatagraph reviews from real users
“To me, Whatagraph is like the Tesla or Mercedes of digital analytics tools, their clean and simple way to present complex marketing data. I highly recommend it to anyone working with marketing analytics who values efficiency and clarity in their reporting.” (Source)
“Whatagraph has a simple user interface that is easy to navigate even for those who don't have analytical skills.” (Source)
“What I like best about Whatagraph is having the ability to create reports fast and easy. No more spreadsheets to do reports, they have a great variety of templates.” (Source)
See more in Whatagraph review.
Whatagraph pricing 2026
Whatagraph operates on annual plans licensed by “source credits” (where one credit equals one connected marketing account or platform integration). All plans include unlimited user seats, unlimited client reports, and access to IQ Agents.
For the most updated pricing, check out this Whatagraph official pricing page.
3. Geckoboard
Best for: Small to large businesses in customer service, sales, and operations that need live KPI visibility on office TVs or shared links.
Geckoboard is a live KPI dashboard tool built around one core use case: getting live data onto a screen your whole team can see. It connects to 90+ data sources, lets you build dashboards with a drag-and-drop dashboard creator, and pairs with any office TV through its Screens feature, without specialist hardware.
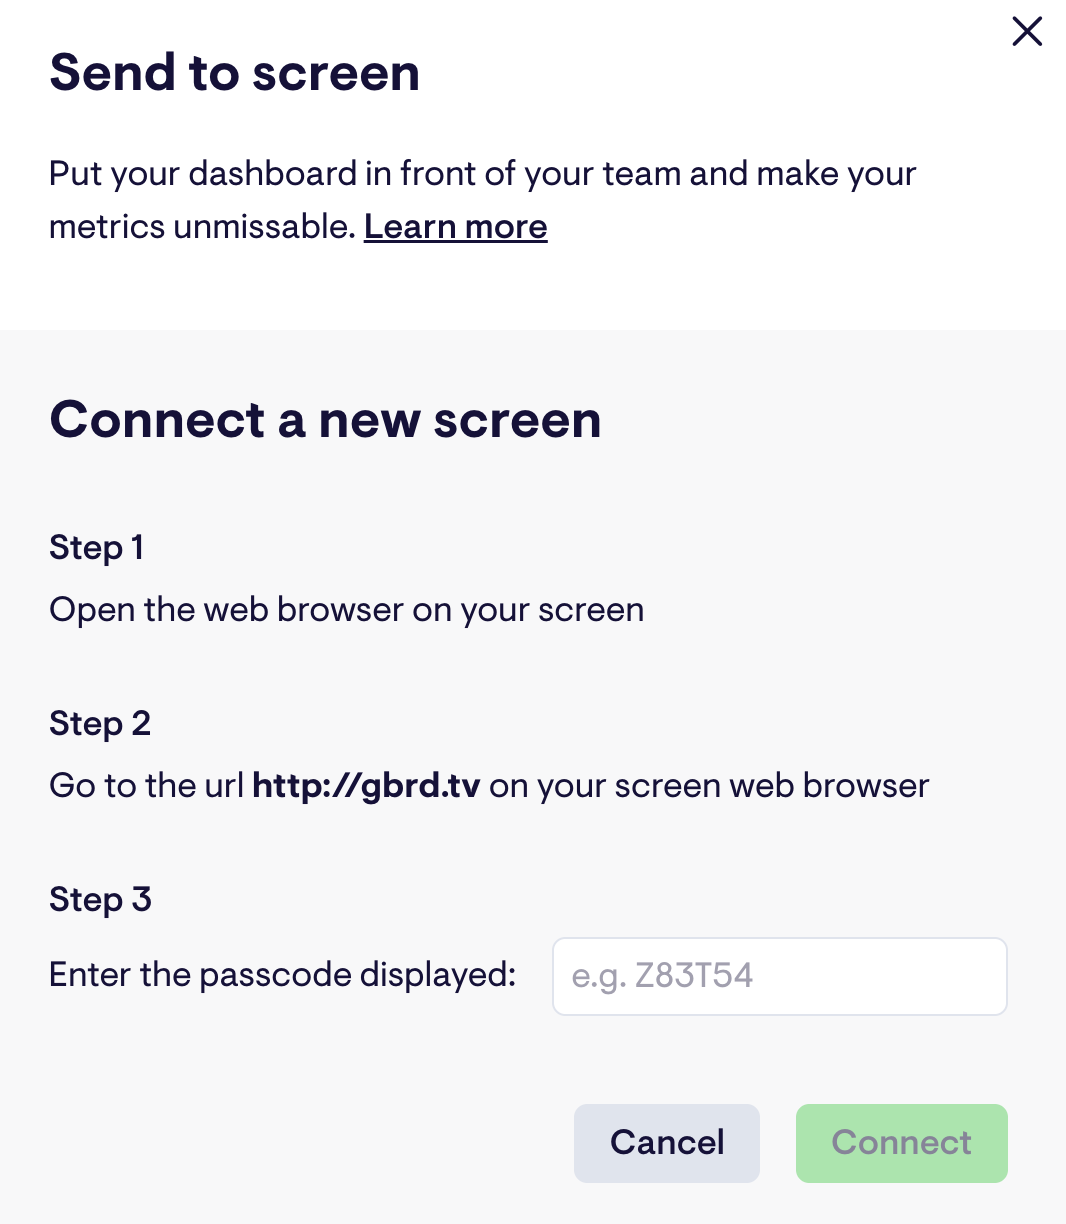
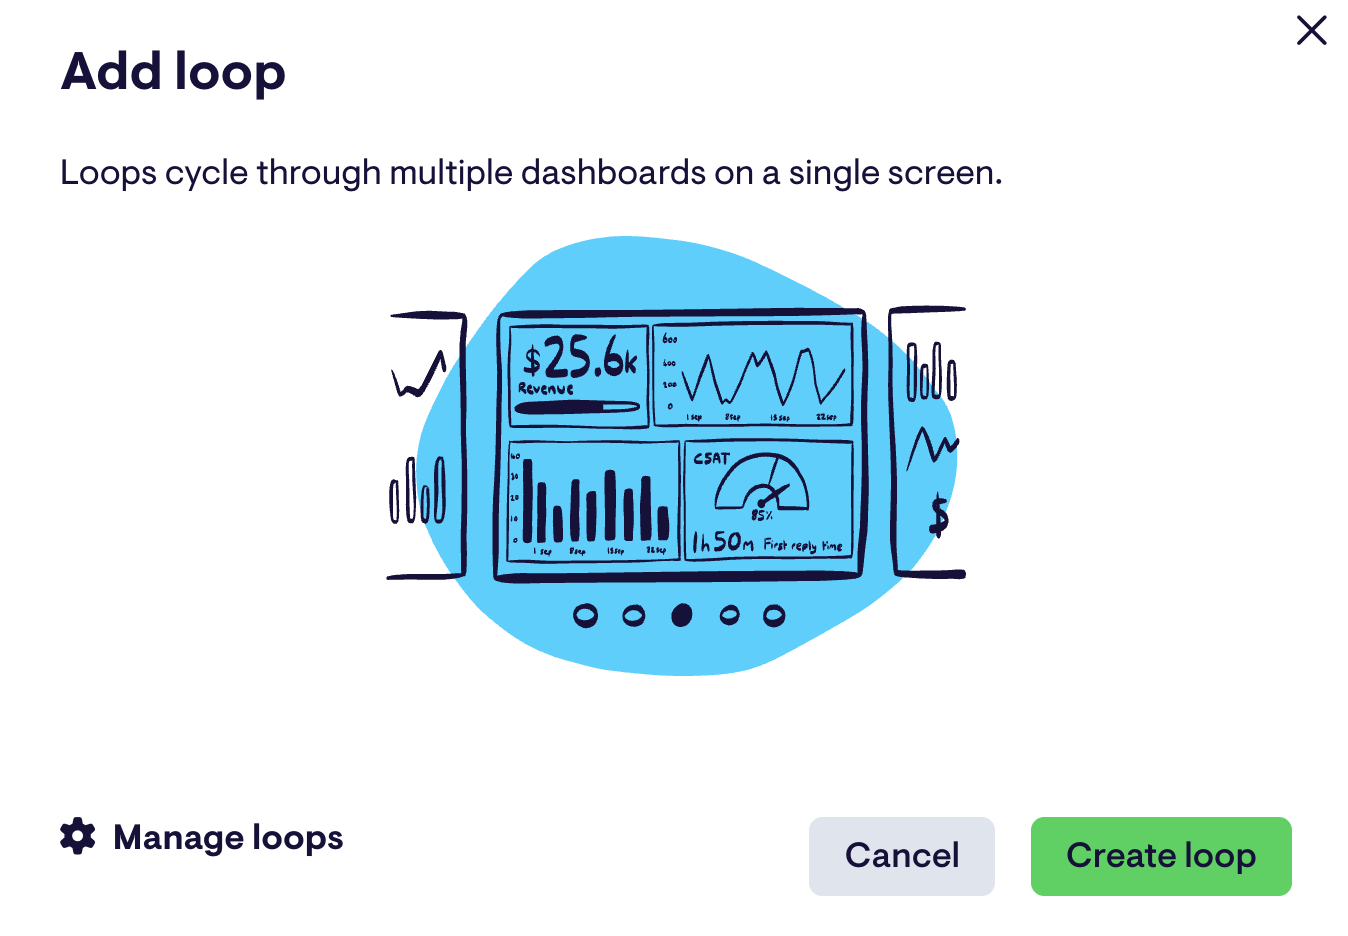
For remote or hybrid marketing teams, dashboards share via links, scheduled snapshots, or automatic Slack and Microsoft Teams updates, or “Loops”.
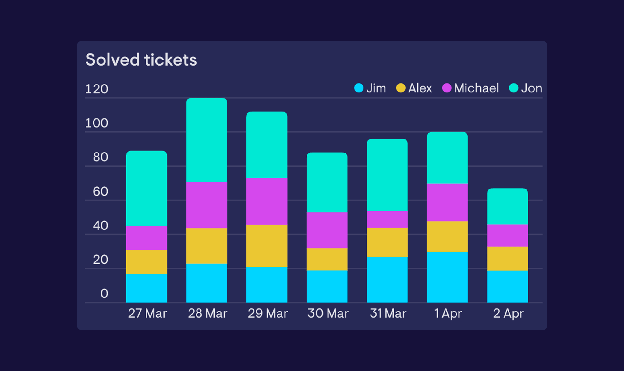
In April 2026, Geckoboard shipped stacked column charts, the first new visualization type in several years, which lets you show total values and their breakdown in a single widget without building two separate charts.
But the biggest launch is the Geckoboard Metrics MCP, released in September 2026. It gives Claude, ChatGPT and other MCP-compatible AI tools read-only access to pre-calculated metrics from integrations including Google Analytics, Google Ads, Facebook Ads, LinkedIn Ads, HubSpot and Zendesk. The MCP is included on every plan and in the 14-day free trial, and it needs a Geckoboard Editor seat.
KPI alerts are a standout feature on the Performance plan: when a metric hits a success or warning threshold, Geckoboard pushes an alert to Slack or Microsoft Teams. For office teams that live on TV dashboards, this is useful. Data refreshes automatically on every plan, with most metrics updating instantly or within minutes.
Interactive View, also on the Performance plan, lets you drill into a metric to see why it changed. It supports marketing sources such as Google Ads, Google Analytics 4, Google Search Console, Facebook Ads and LinkedIn, and shows the individual tickets, calls or orders behind Zendesk Support, Aircall and Shopify metrics.
I tried out the free Trial and it was pretty easy to get started. All you needed to do was connect your data sources and choose the widgets you’d like to visualize.
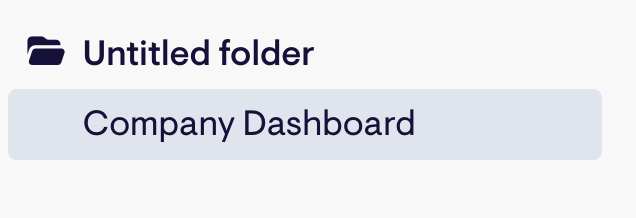
But one downside is that adding each widget takes several steps. You’ll need to:
- Click on “Add widget”
- Choose the metric you want to visualize
- Customize that widget
Then, repeat this process again for every metric you want to create. This creates unnecessary back and forth between the dashboard and the widget builder, and can be time-consuming. Once widgets are on the dashboard, you can drag, resize and group them. For example, say I want to build a Google Analytics dashboard, I’ll need to select each widget individually.
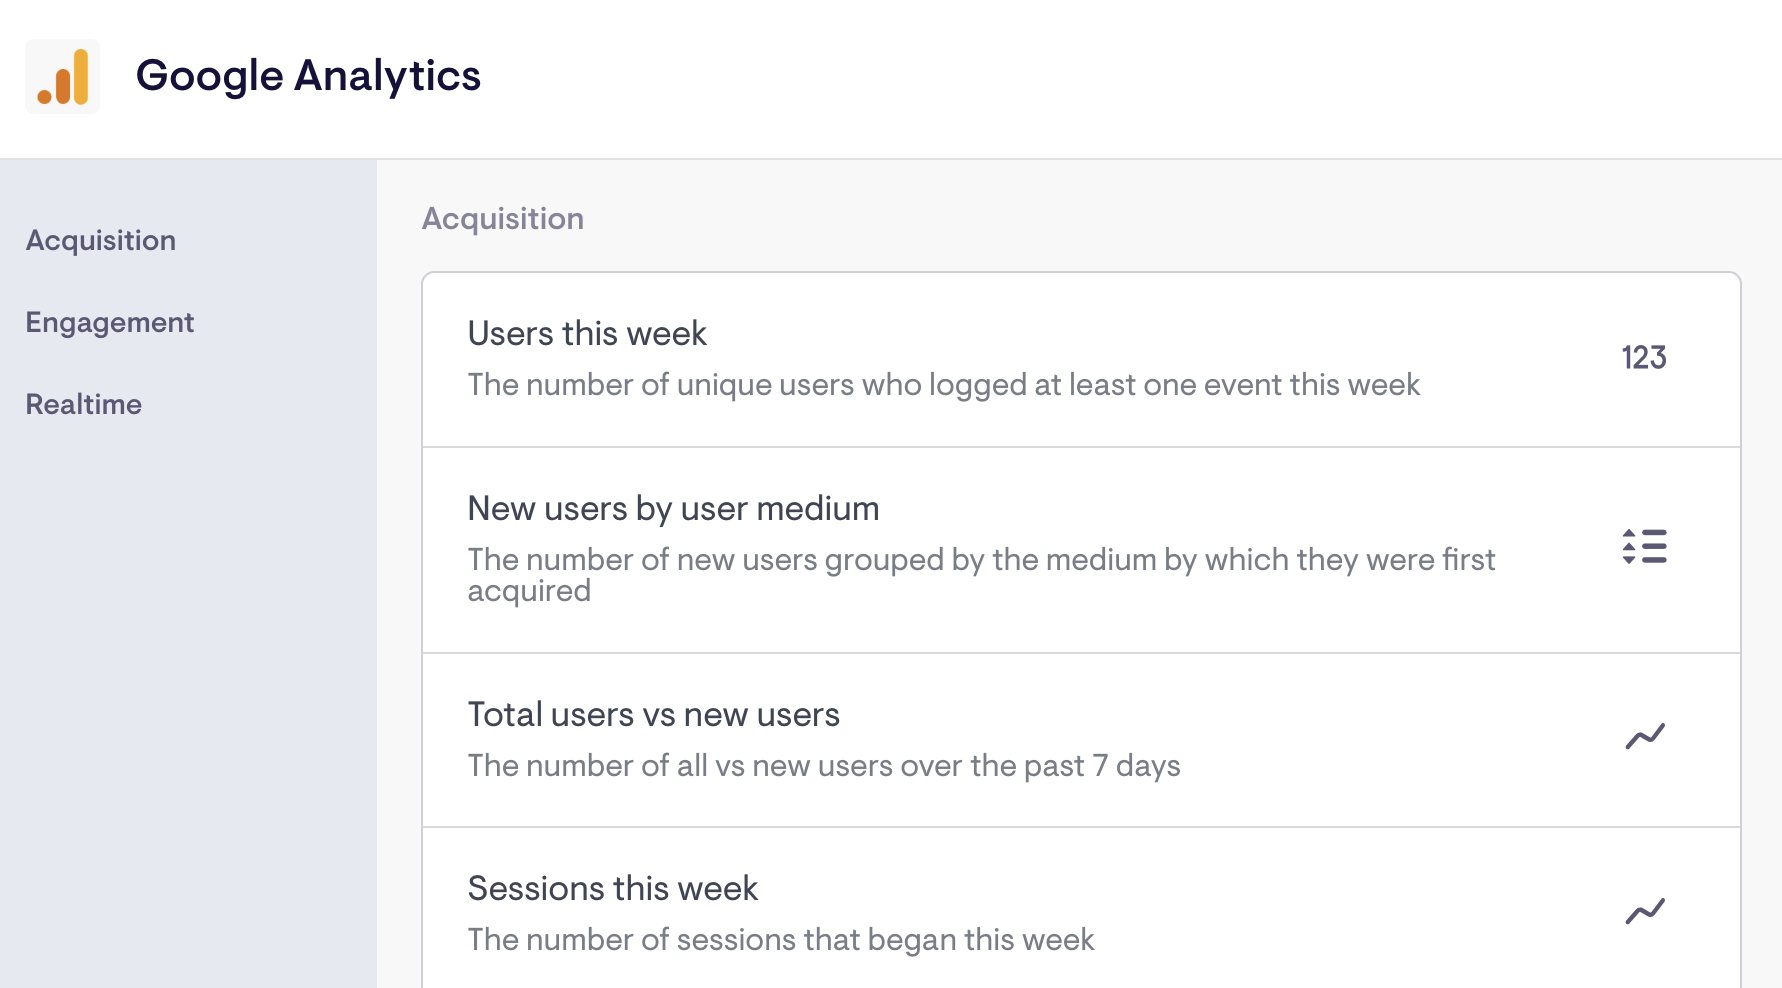
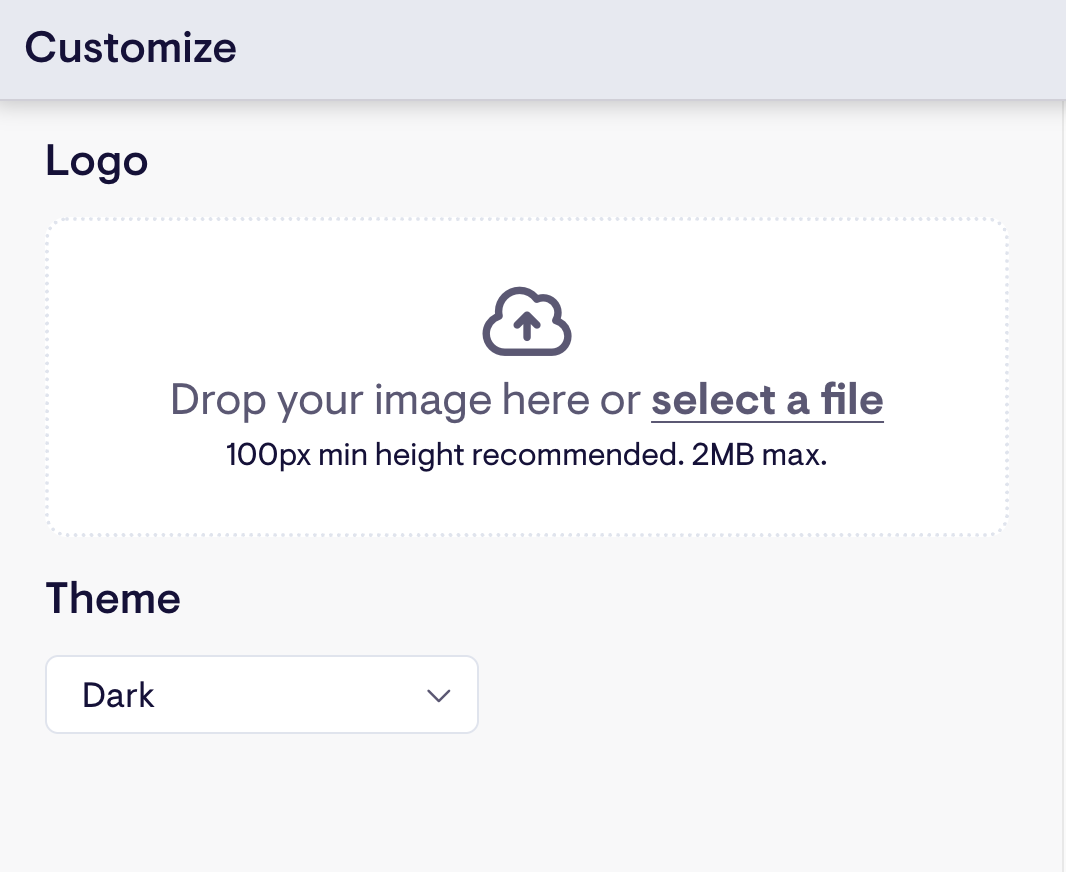
Customization options for dashboards are also pretty limited. You can only upload a logo and choose dark or light themes.
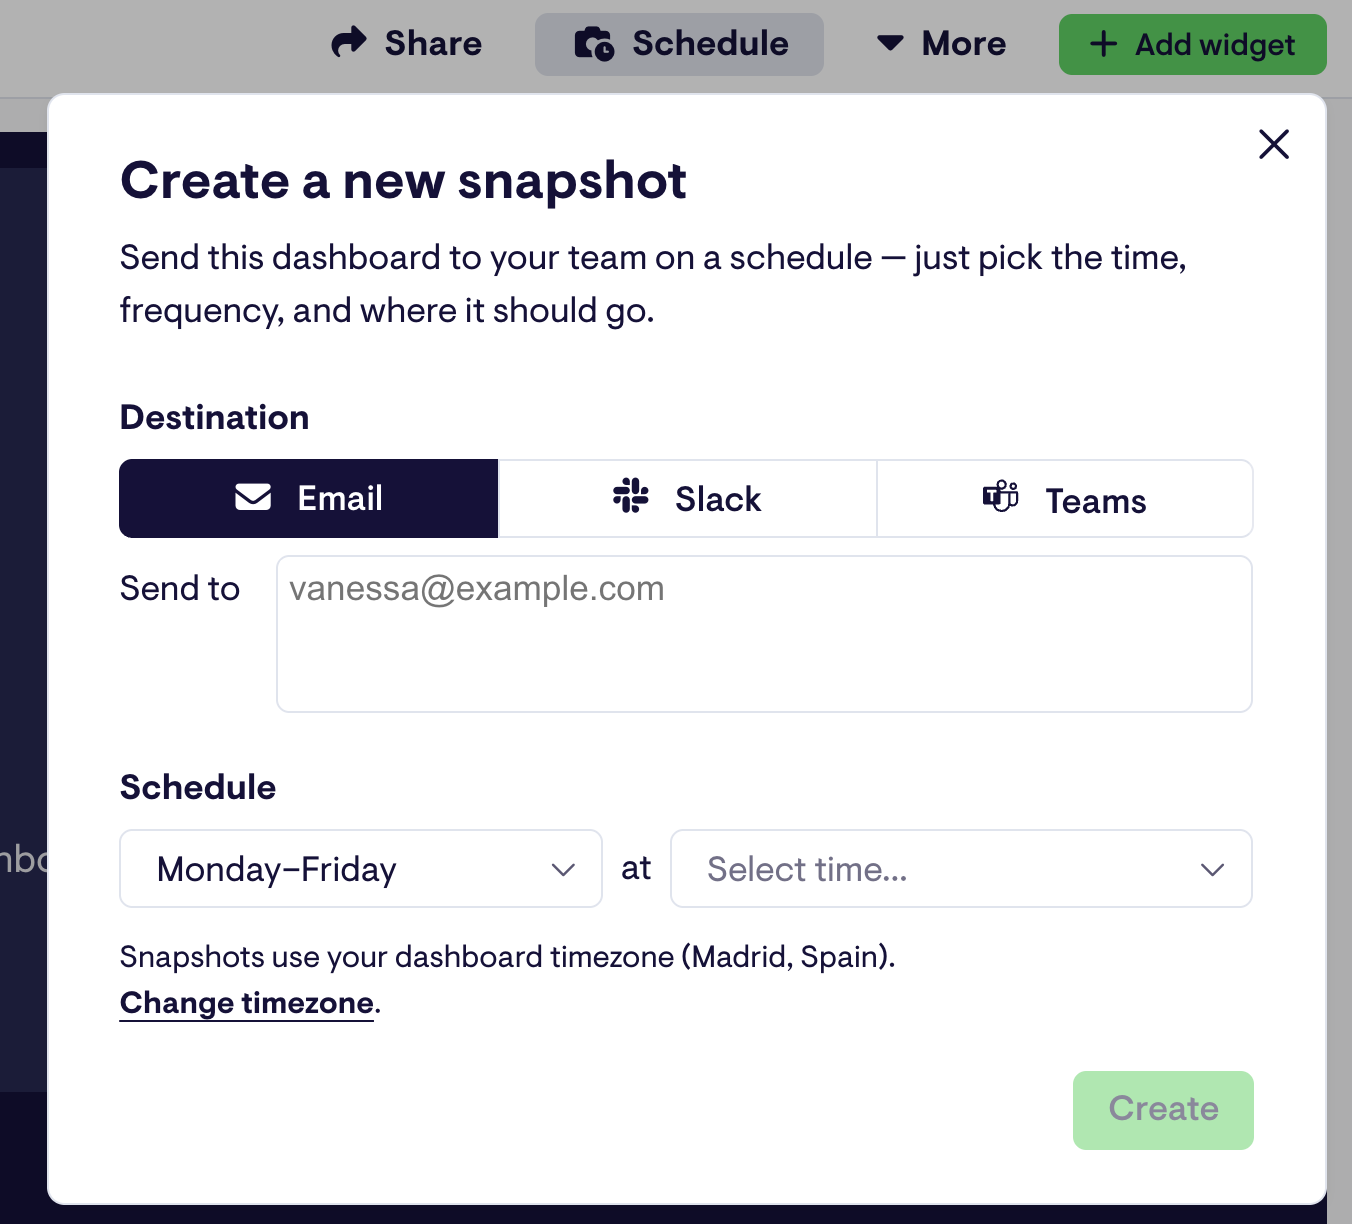
You can then schedule a snapshot of the dashboard to be sent to your team members, at a specific time and frequency, via email, Slack or Teams.
Or you can share the dashboard through a link:
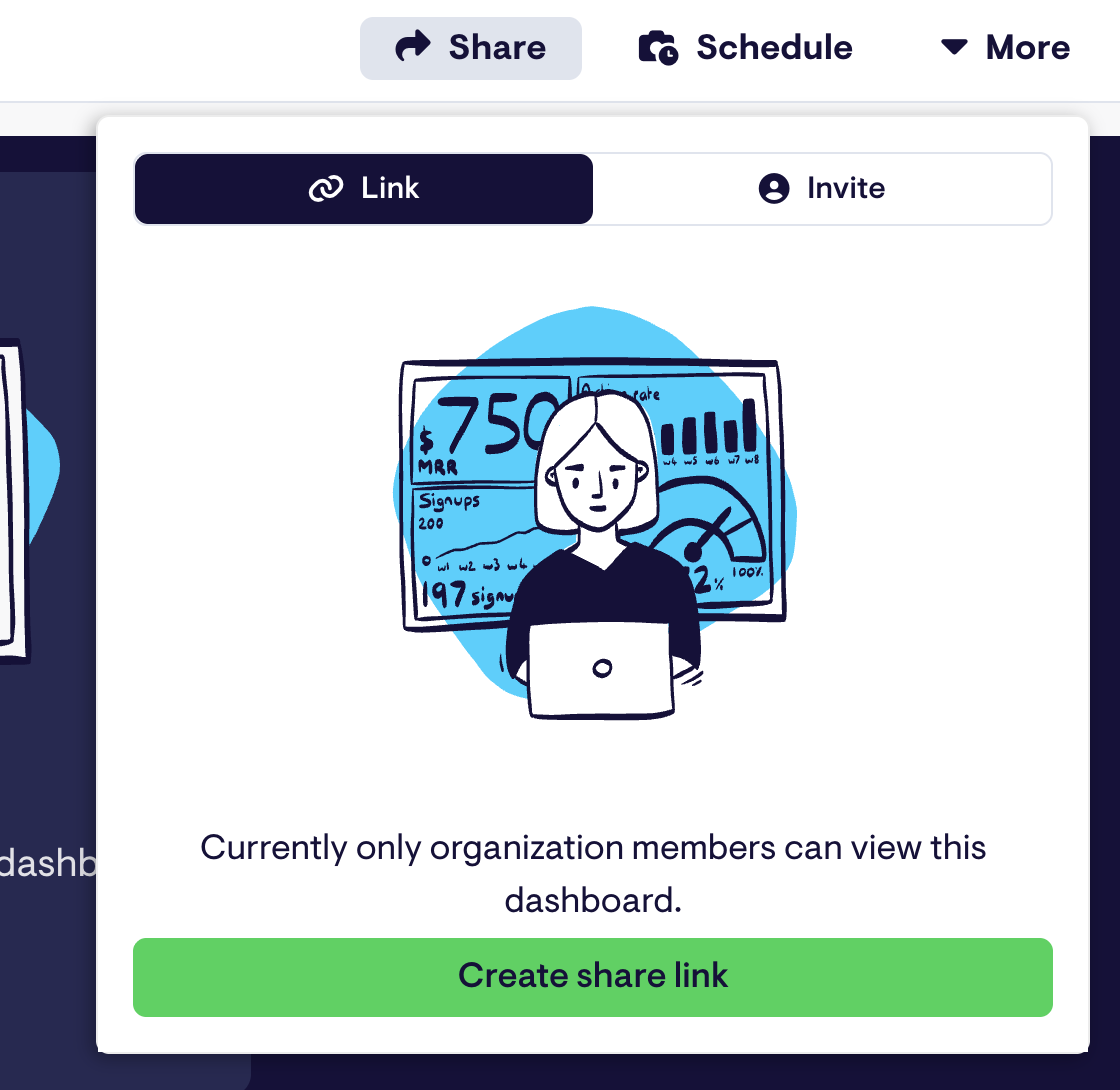
However, unlike Whatagraph, you won’t be able to create custom data blends or dimensions on Geckoboard, and custom metrics are limited to numeric custom fields in HubSpot and Zendesk on the Performance plan.
Bespoke metrics that combine sources go through Geckoboard's metric-building service on Enterprise. This can be a deal breaker if you’re a large company and you need to organize your scattered data to create easy to read and impactful reports.
Key features:
- 90+ integrations including Google Analytics, HubSpot, Salesforce, and Zendesk
- Drag-and-drop dashboard builder
- KPI alerts via Slack or Microsoft Teams (Performance plan)
- TV dashboards with automated rotation through Loops
- Scheduled snapshots to Slack, Microsoft Teams, or email
- Stacked column charts (new April 2026)
- Countdown widget (new September 2026)
- Metrics MCP for Claude, ChatGPT, and other AI tools (new September 2026)
- Interactive View drilldowns and source data (Performance plan)
- Mobile dashboards
Geckoboard Reviews from Real Users
“I love how simple it is to use. That you can connect data from so many different sources in an easy way.” (Source)
“Connecting the dashboard with the Tv works like a charm.” (Source)
“Geckoboard could use more features and options for customization. Compared to other tools like Power BI or Tableau, Geckoboard didn't have as many advanced tools for analyzing data or changing how things looked. I wished I could make more complicated charts and do special calculations.” (Source)
See more in Geckoboard reviews.
Geckoboard pricing 2026
Billed annually, with unlimited viewers on every plan. Annual billing saves 20% compared with monthly billing, and a 14-day free trial is available. Essentials add-ons: extra dashboards $24 each, editors $20 each, screens $20 each, and advanced themes and custom logo $40. Data volume limits apply to Aircall, Shopify and Zendesk Support.
Plan | Price (billed annually) | Dashboards, editors, screens | What's included |
| Essentials | From $79/month | 2 dashboards, 1 editor, 1 screen | Unlimited viewers, all 90+ integrations, real-time data, Slack, Microsoft Teams and email snapshots, sharing links, TV screens, dashboard loops, mobile access, Metrics MCP |
| Performance | From $319/month | 20 dashboards, 3 editors, 5 screens | Everything in Essentials plus high data volume, Slack and Microsoft Teams alerts, celebrations, drilldown and source data, custom templates, metrics from HubSpot and Zendesk custom fields, folders, dashboard ownership and verification, custom themes, onboarding assistance, under 1-hour support response |
| Enterprise | Custom | Custom | Everything in Performance plus metric-building service, SSO, user management API, data import controls, audit logs, procurement support, dedicated support manager, priority support including engineering, full onboarding and training, dashboard consultancy |
4. Klipfolio
Best for: Data teams at agencies and companies that need formula-level control, centralized metric governance, and highly customizable dashboards.
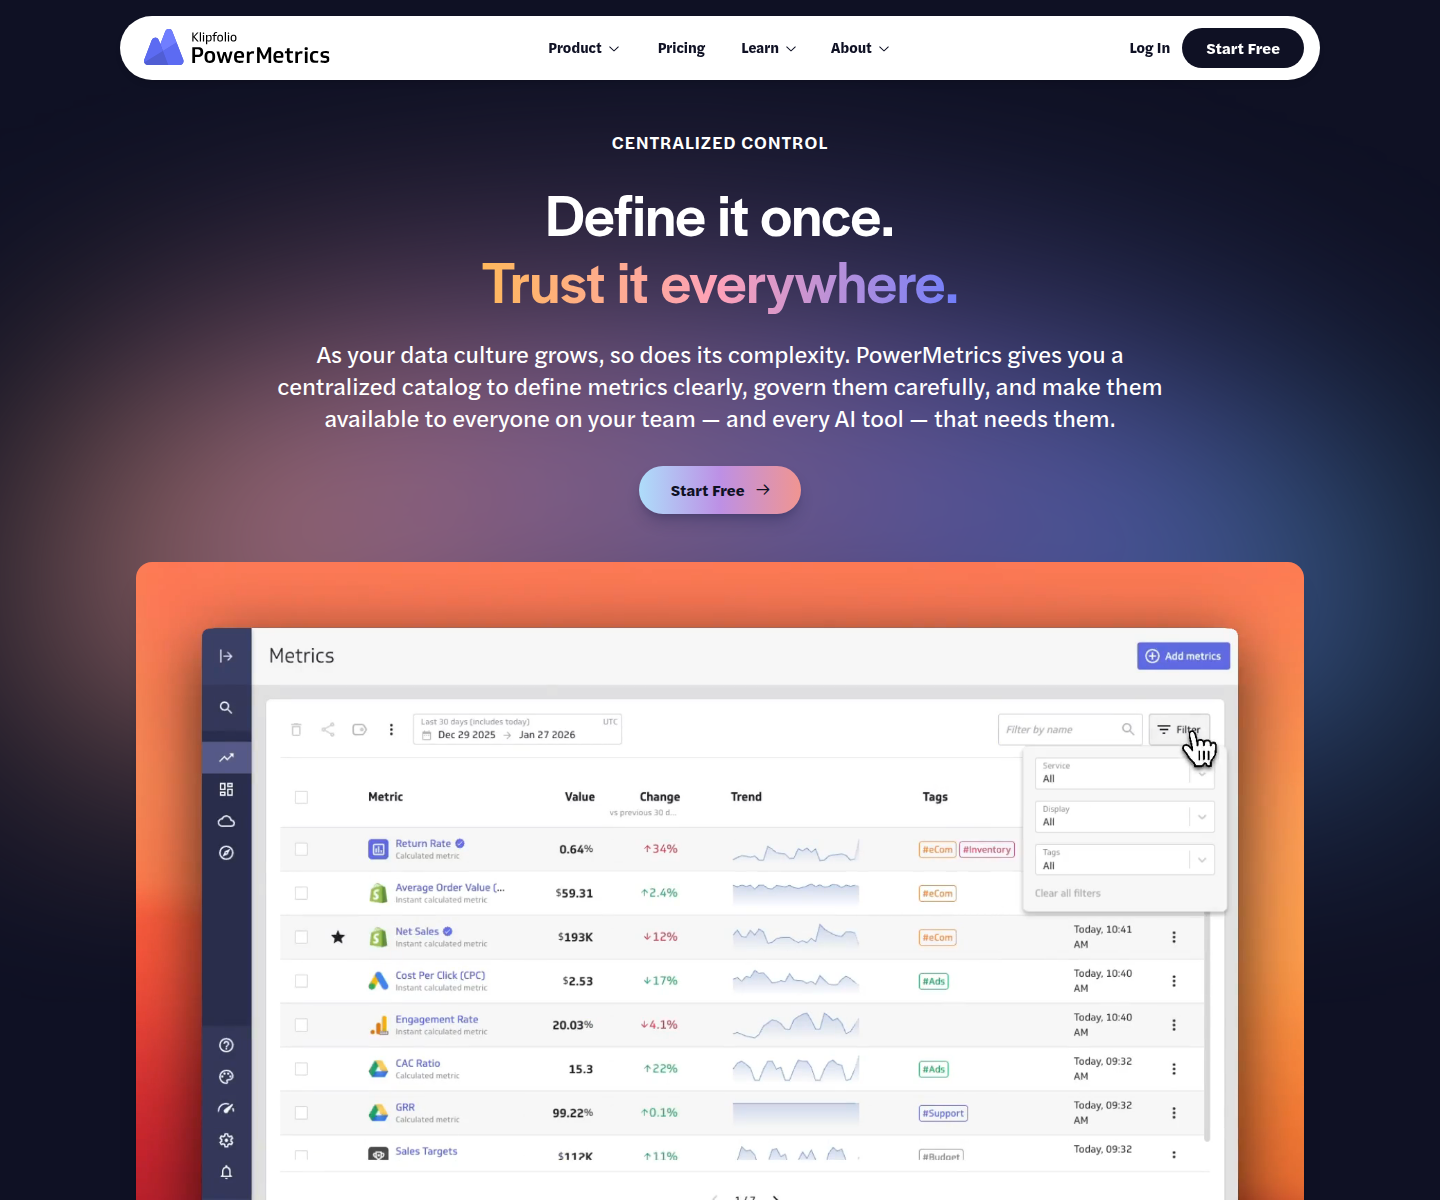
Klipfolio is a data analytics and business intelligence company with two key products, PowerMetrics and Klips:
- PowerMetrics: This is their "Metric Warehouse" solution that allows data teams to centralize and standardize metrics (like LTV or CAC) so that every department uses the same definition. In 2026, PowerMetrics added an AI Assistant (beta, May 2026) that answers questions about your metrics, and an MCP Server (beta, March 2026) that connects Claude, ChatGPT and other AI tools to your metric catalog.
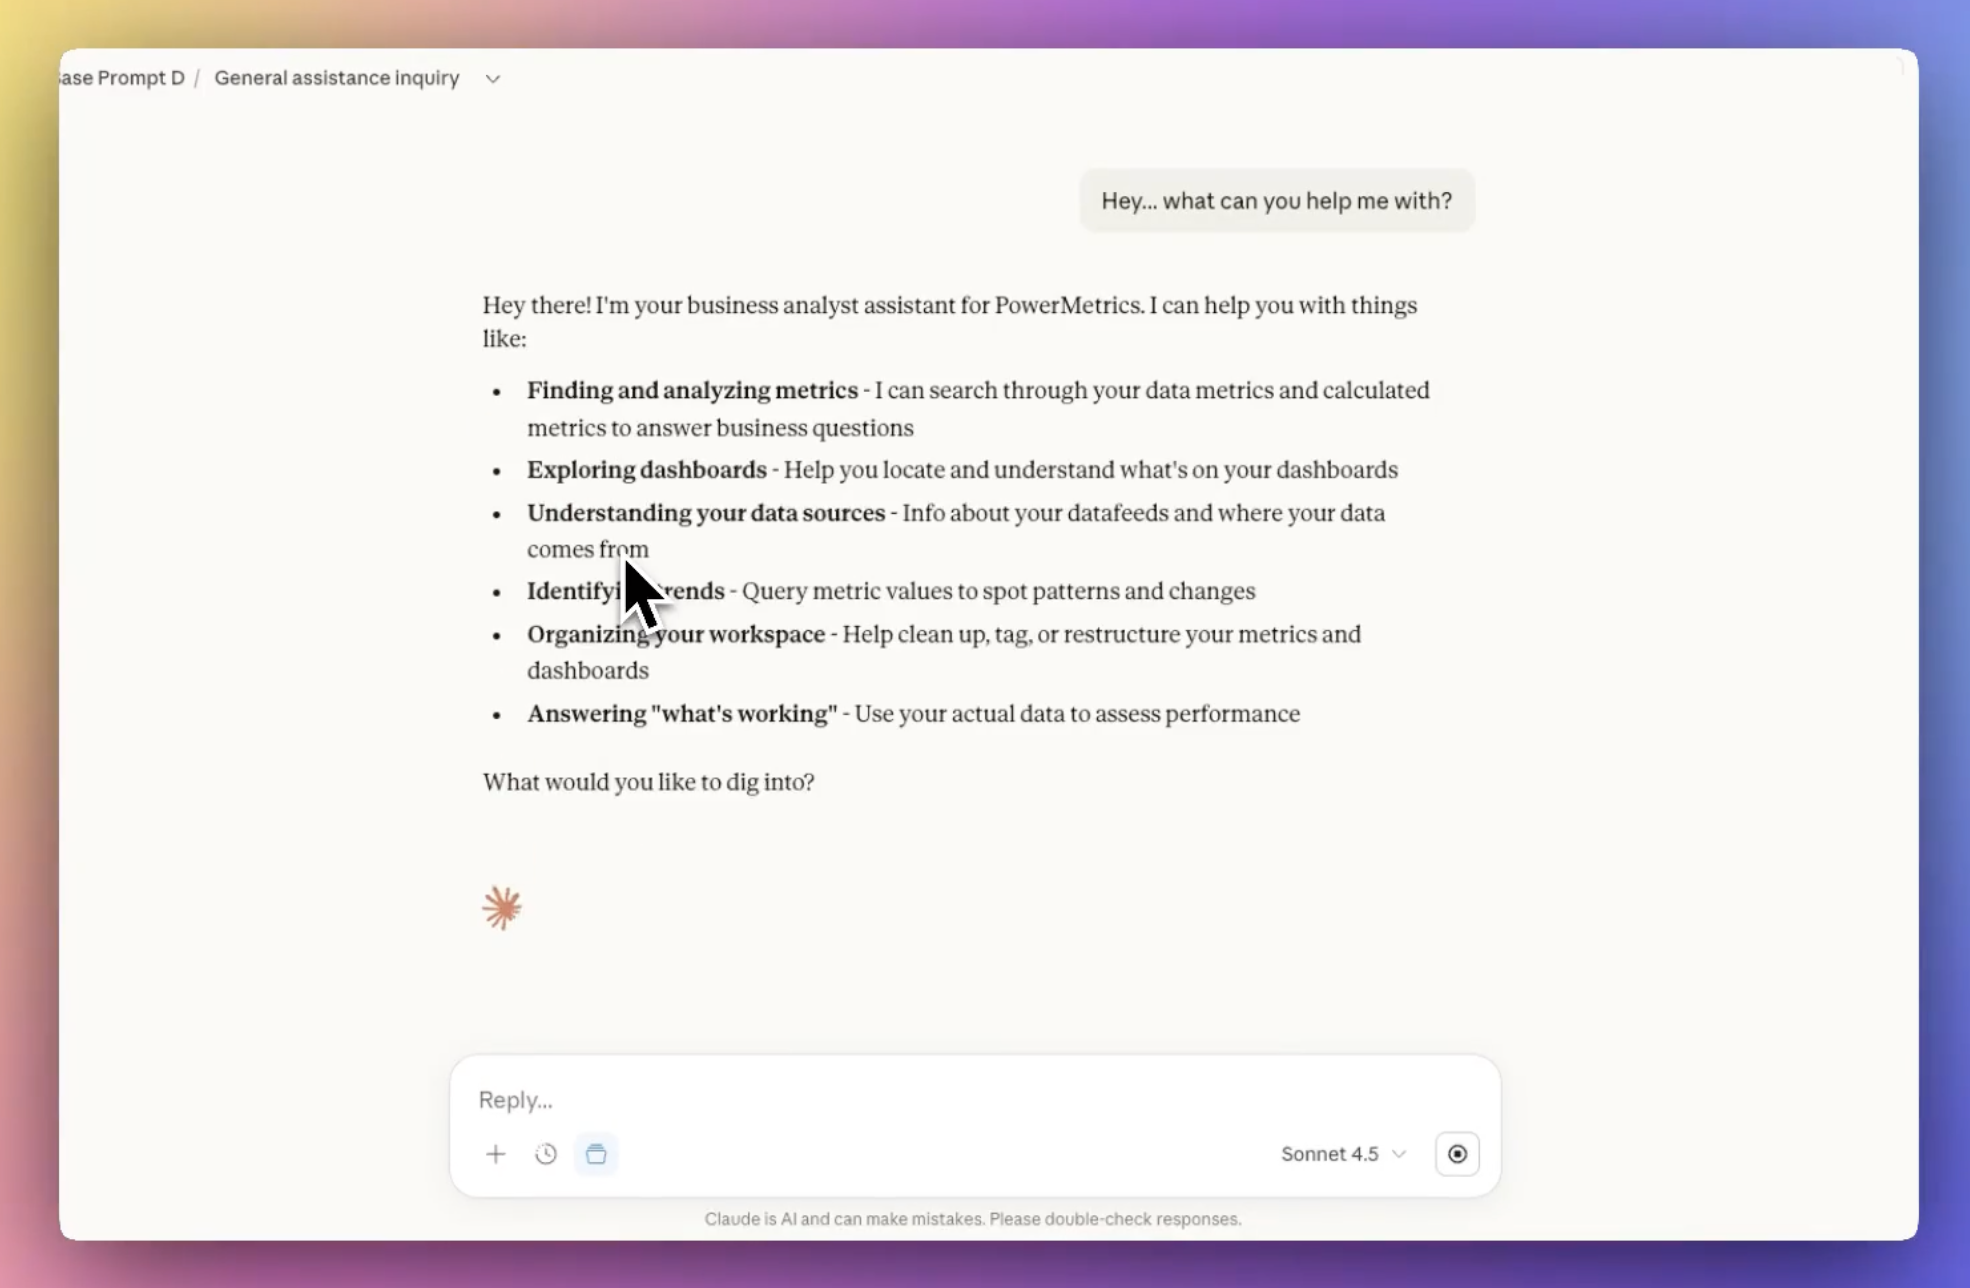
- Klips: These are traditional, highly customizable dashboards. Klips now supports over 130 native integrations, plus a solid REST/URL connector for proprietary data.
Klipfolio’s primary edge over AgencyAnalytics is its governance and Metric Catalog. Rather than just pulling data into a chart, you can:
- Create a curated list of metrics that are "certified" by your data team.
- Enable non-technical users to build their own reports using only these certified metrics, preventing data silos.
- Store data in Klipfolio's own warehouse or connect directly to your Snowflake or BigQuery semantic layer.
All this is designed to speed up decision-making and reduce ad hoc requests to data teams - if you have a dedicated data team in the first place.
AgencyAnalytics now offers custom metrics, but it doesn’t come with a certified metric catalog or this level of metric governance.
Klips also has separate plans for agencies, priced by the number of client accounts. The agency Pro plan and above include the White-Label Bundle, a custom domain and SSO. In March 2026, Klips added a permission that lets admins give client accounts control over their own view-only users, and in September 2026, Klipfolio achieved SOC 2 Type I attestation.
Getting started with Klipfolio was easy. I created a Trial account and got access to my first dashboard.
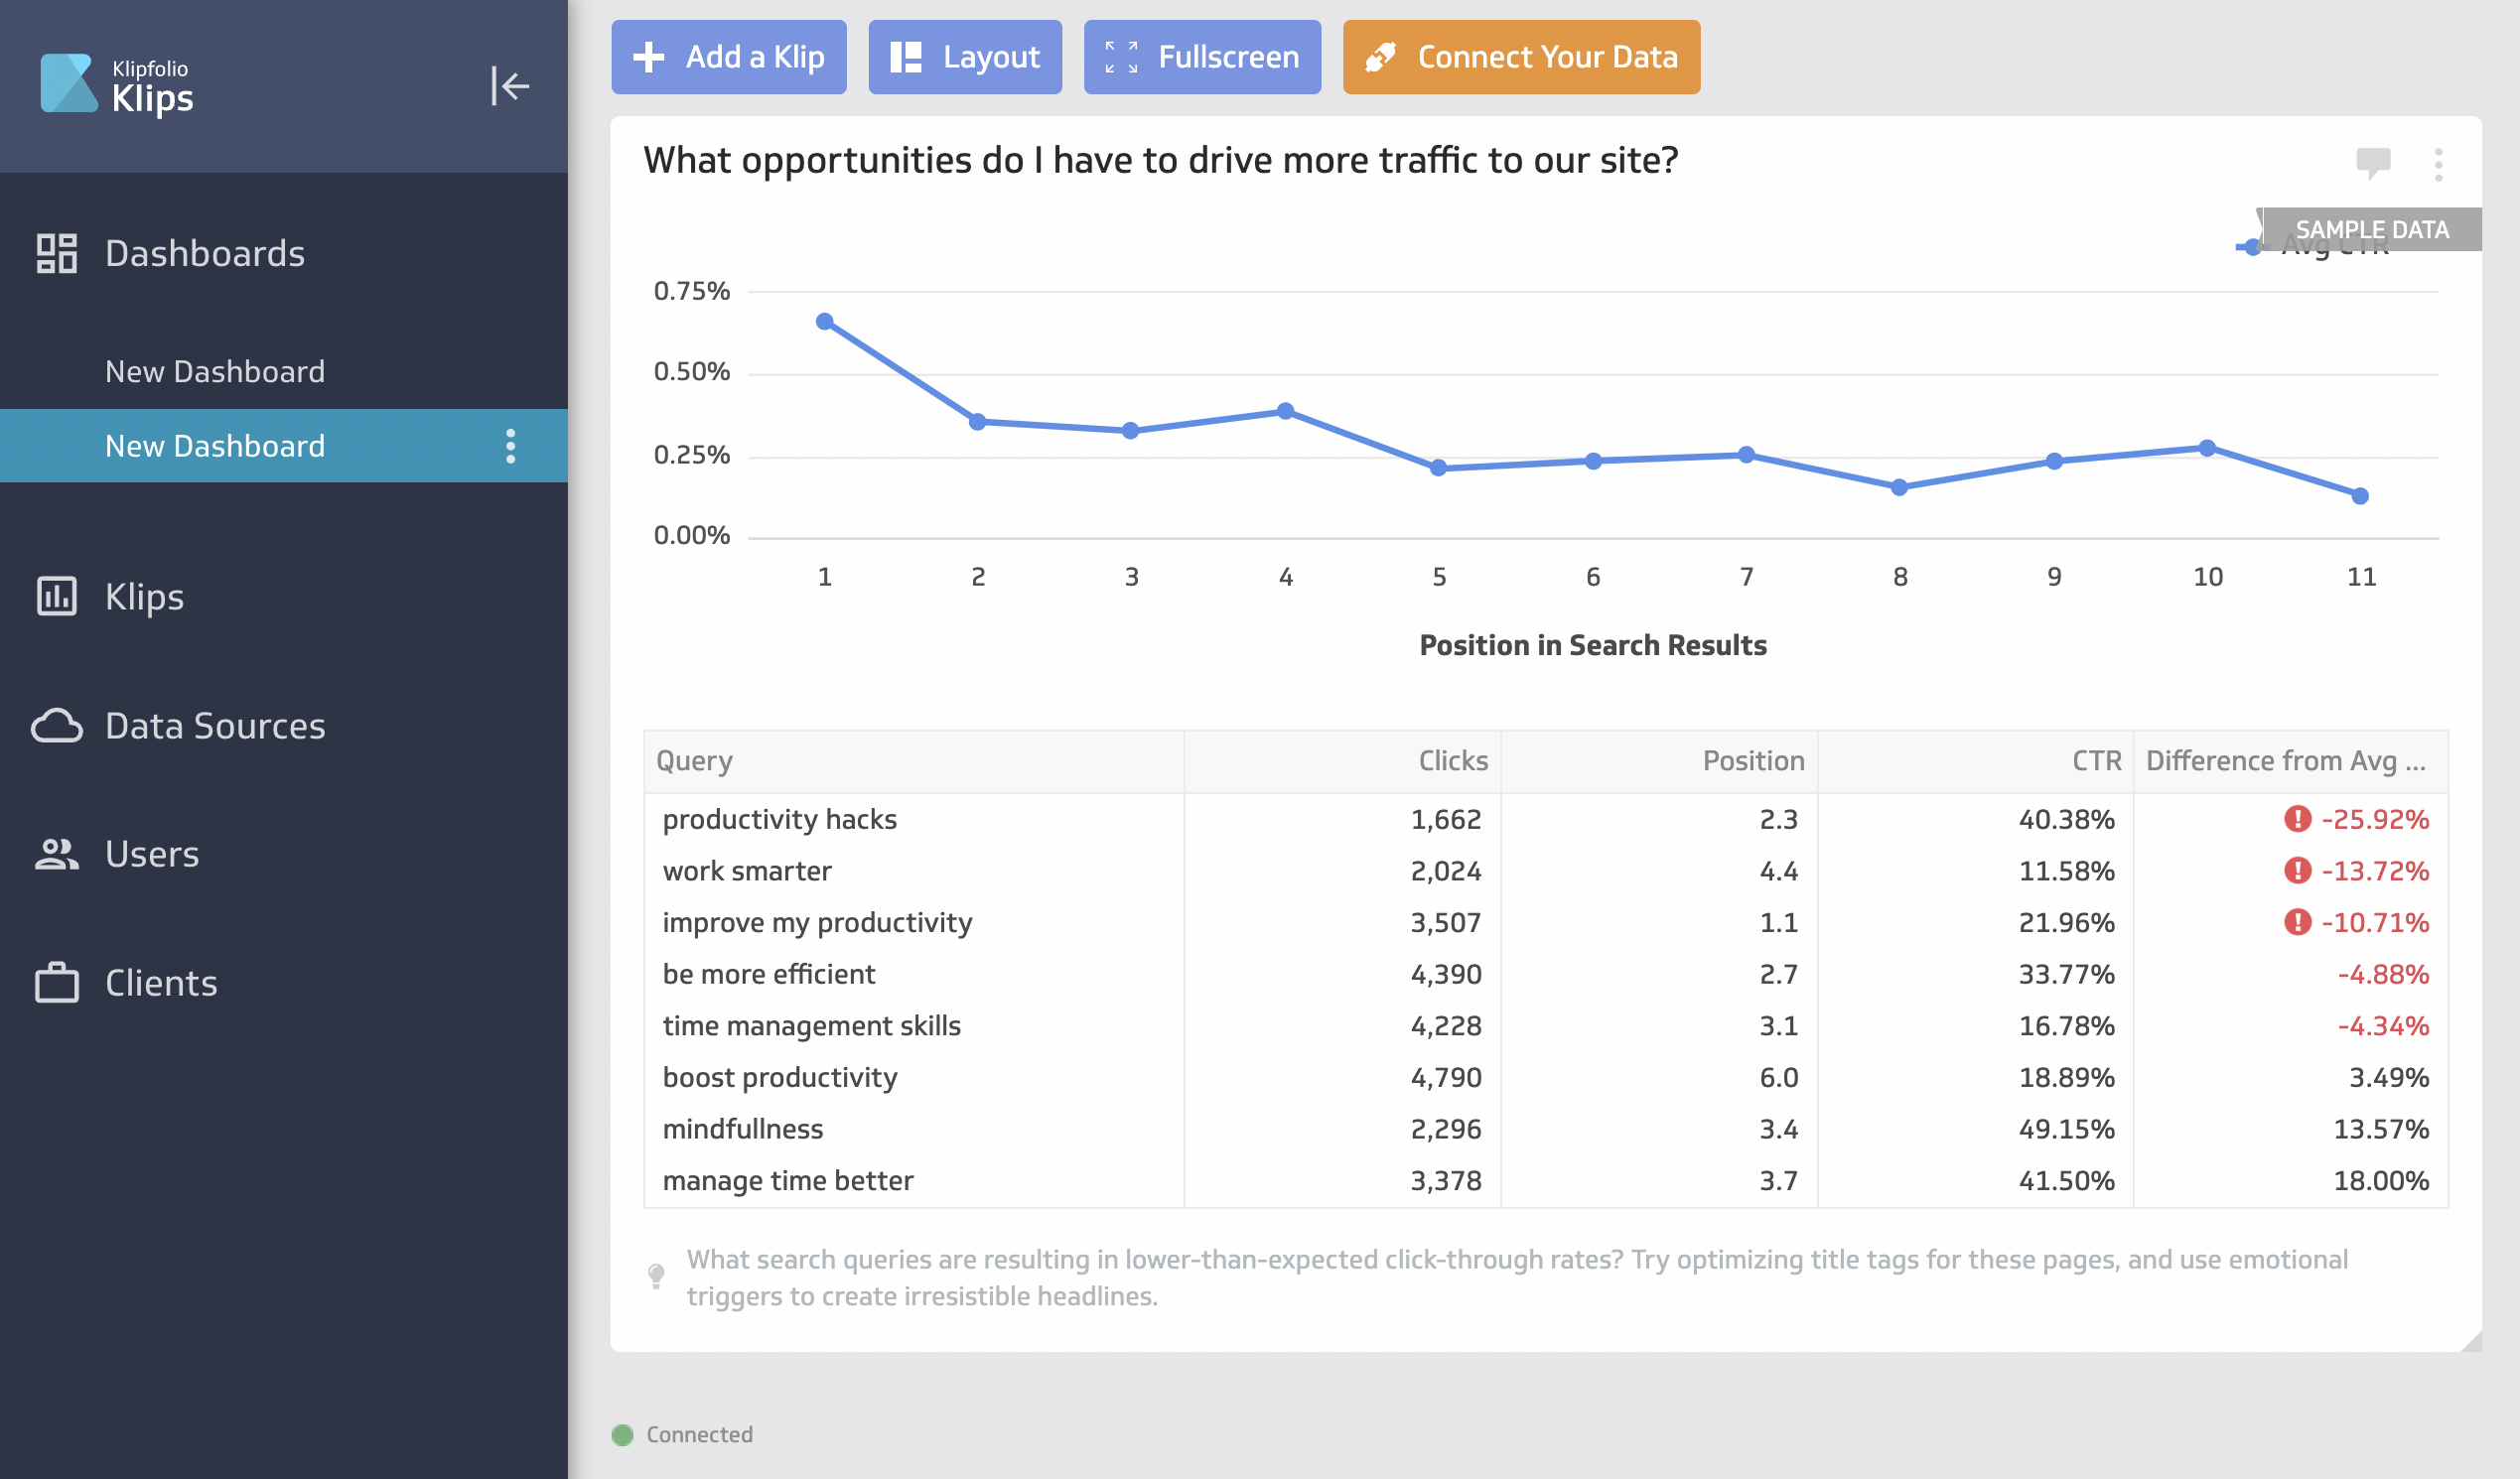
But this is where things got complicated. To visualize your data, you’ll first need to create a “Klip”, which is in a different tab from the dashboard.
There are some pre-made Klips like the below screenshot, but for the most part, you’ll need to build a custom one.
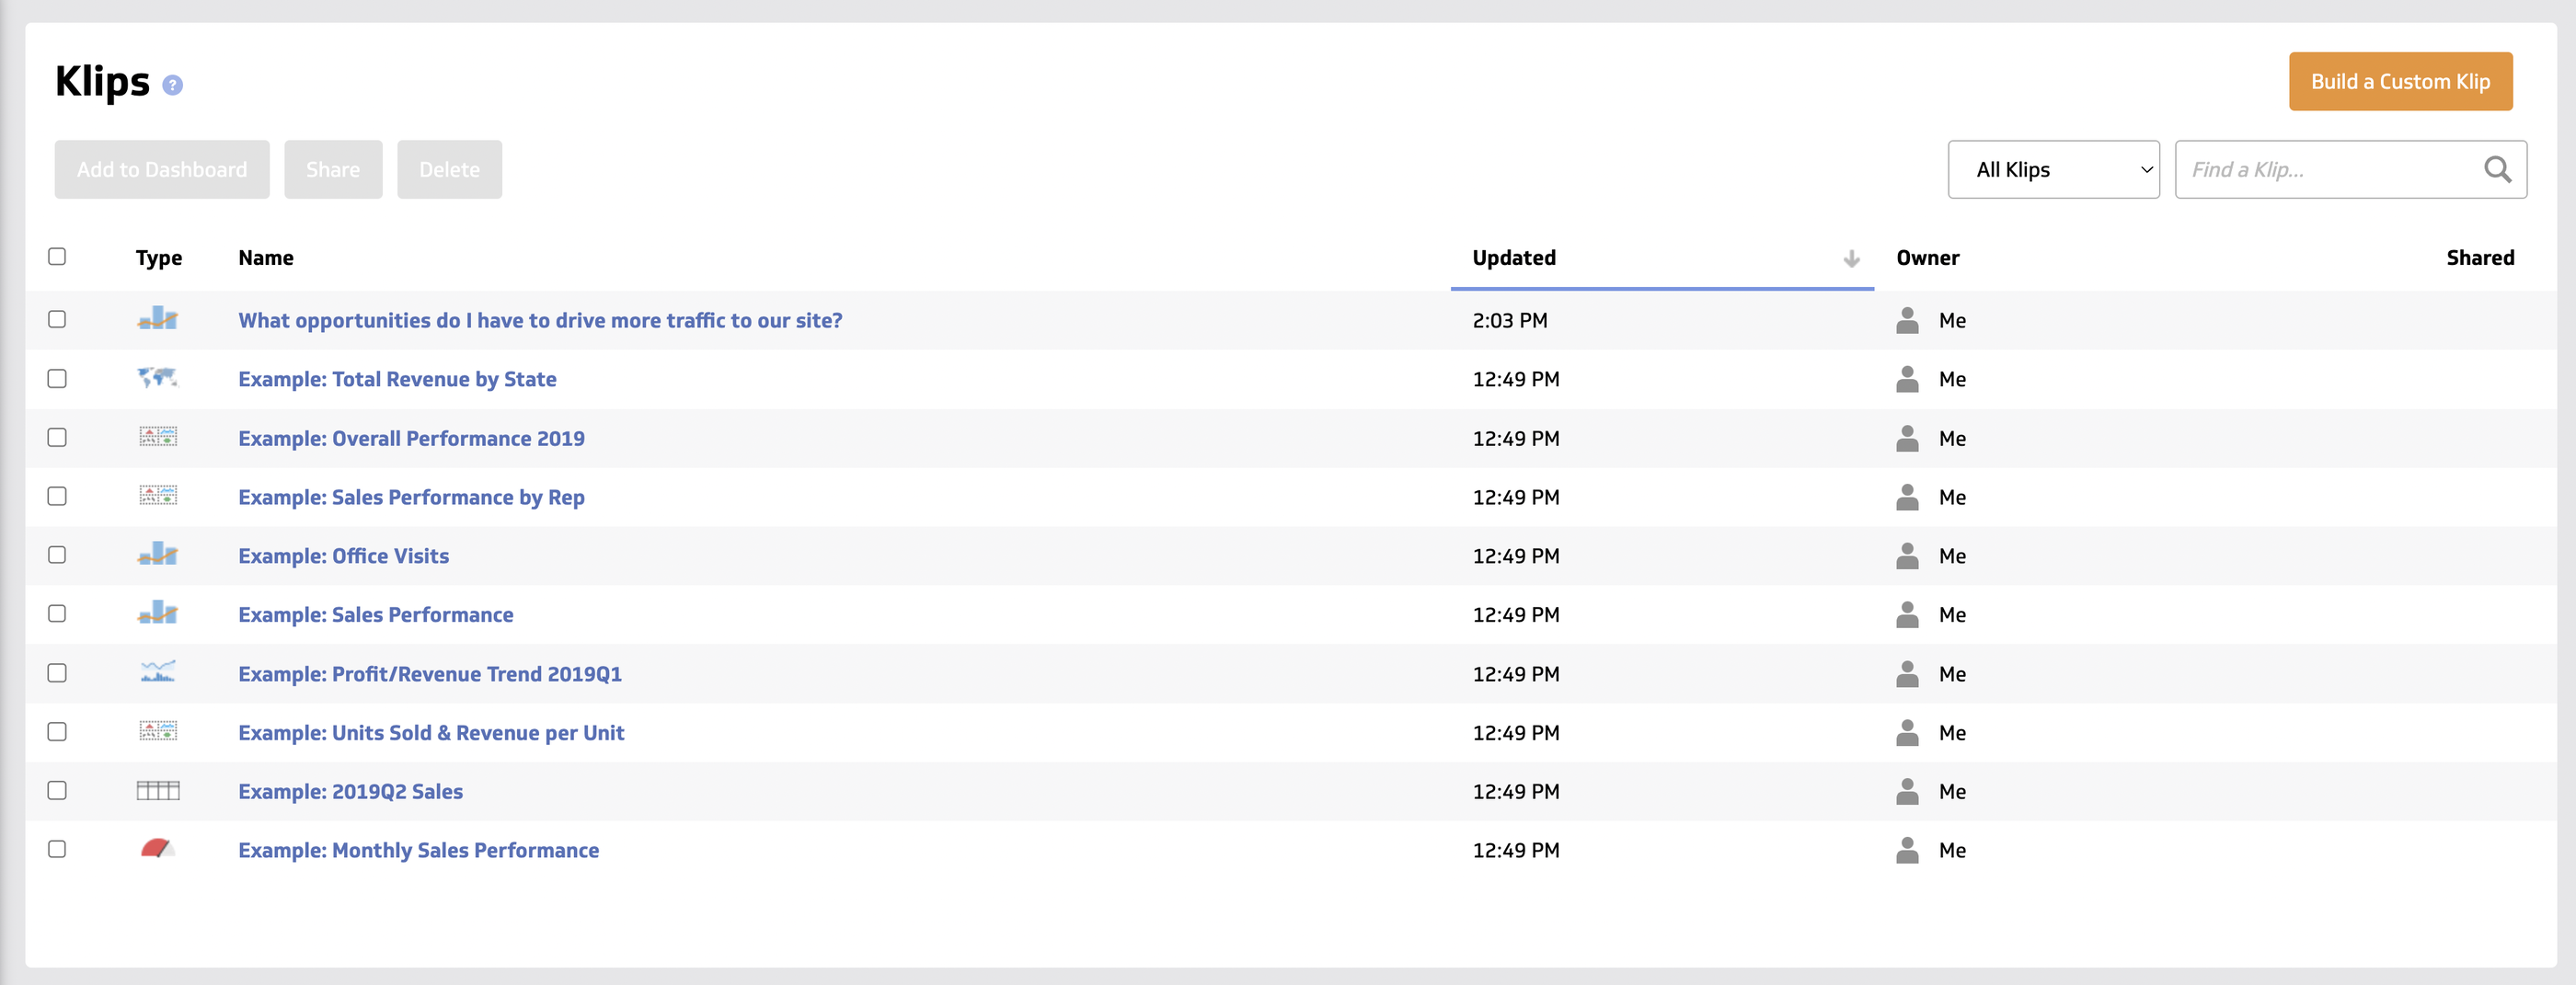
And while pre-built Klip dashboards and faster menus (added in March 2025) speed up the start, advanced customization still requires a back-and-forth workflow that can take 5 to 30 minutes per widget.
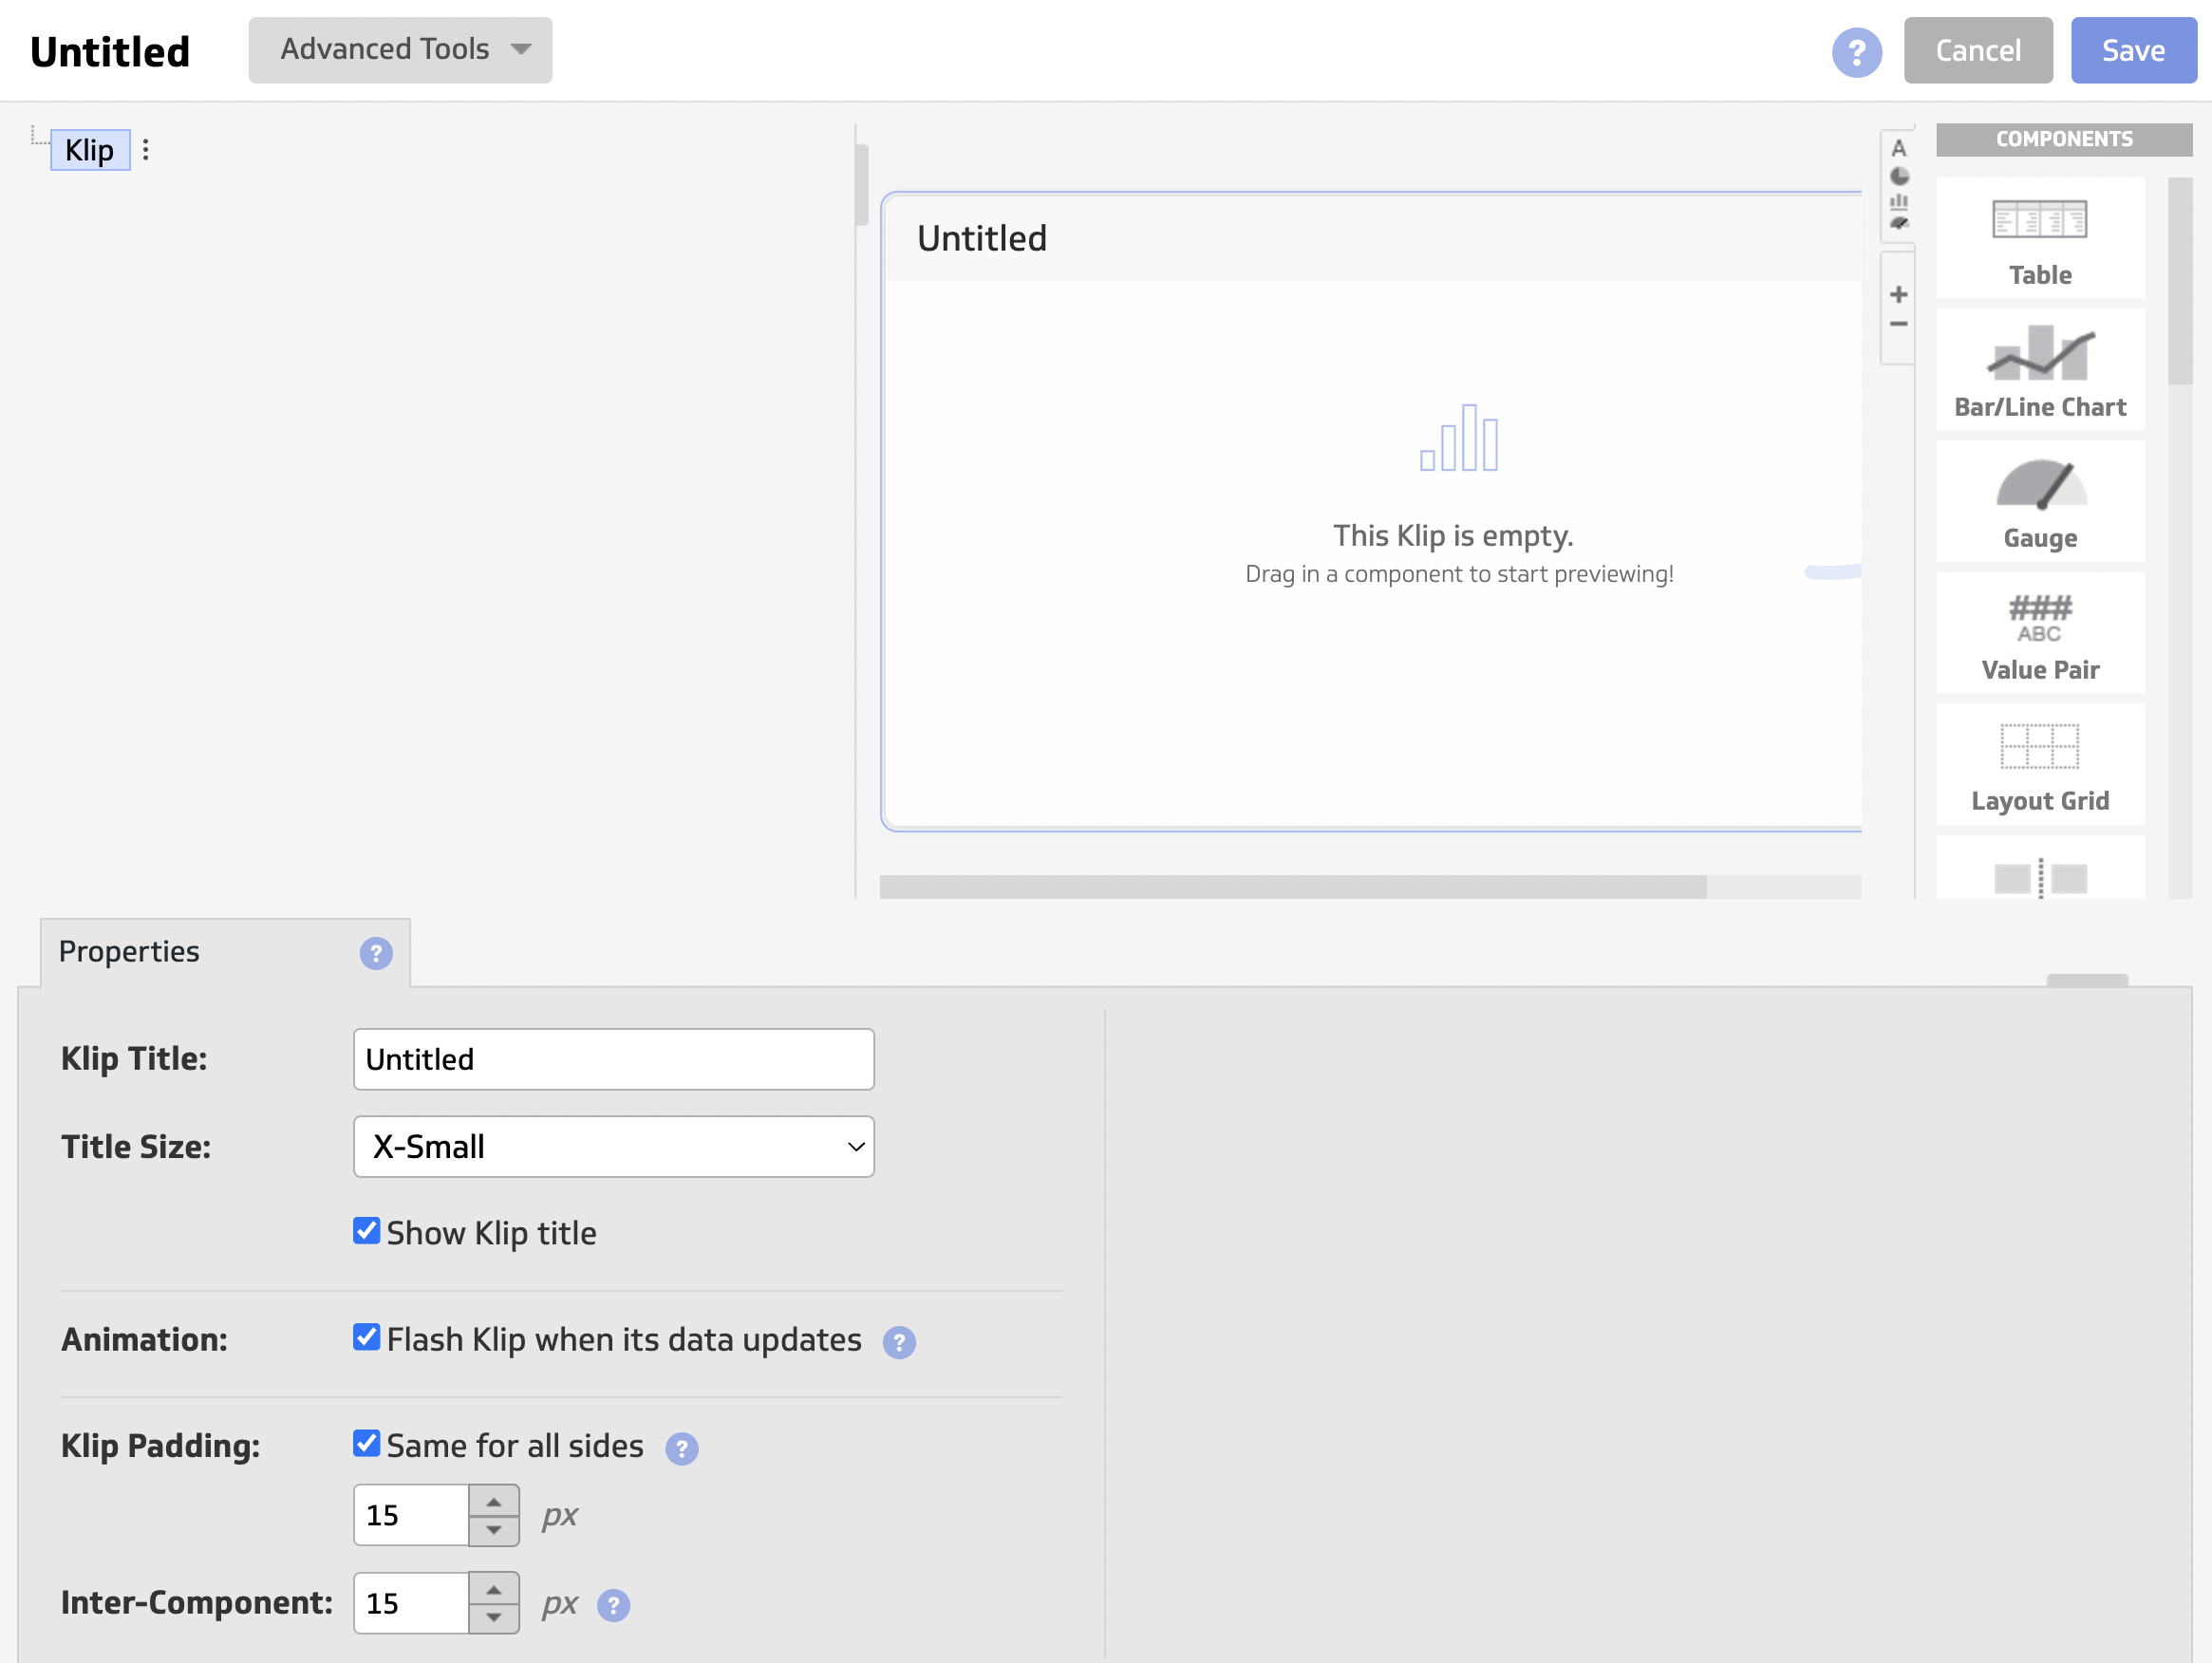
Once you’re done, then you can add this custom Klip onto your dashboard.
Key features:
- 130+ integrations including SQL databases, data warehouses, Google Ads, HubSpot, Salesforce CRM, and Google Sheets
- Data blending and aggregations
- Custom metrics and dimensions
- PowerMetrics forecasting, goals and notifications
- PowerMetrics AI Assistant and MCP Server (both in beta, 2026)
- Scheduled reports with PDF and CSV exports
- Google Sheets connectivity
- Client-based agency plans with white-label options
- Unlimited users on all plans
Klipfolio reviews from real users
“What I really like about Klipfolio is that it’s super easy to pick up, connects smoothly with lots of data sources, the dashboards get used all the time.” (Source)
“Their customer service is terrible. I was told they were working on a solution more than 6 months ago and have not received a single update. Every time I contact support I get the impression that I am bothering them. I will not be renewing this platform because I do not feel valued as a customer.” (Source)
“It doesn't have as many chart options like Power bi or Data Studio. It's good only for light data analysis.” (Source)
Klipfolio pricing 2026
Klips plans include unlimited users and 130+ data integrations, with a 14-day free trial. PowerMetrics is priced per user and comes with a 30-day free trial. Klips add-ons (billed annually): extra dashboards $8/month each, custom theme $69/month, custom domain $90/month, White-Label Bundle $299/month, priority support $63/month, SSO $63/month, and a dedicated server $699/month.
Product | Plan | Billed annually | Billed monthly | Limits | Highlights |
| Klips | Base | $120/mo | $140/mo | 3 dashboards, 4-hour refresh | Data modeling and joins, PDF reports, template gallery, your logo |
| Klips | Grow | $190/mo | $220/mo | 10 dashboards, 1-hour refresh | Everything in Base plus published links and scheduled reports |
| Klips | Team | $310/mo | $350/mo | 20 dashboards, 15-minute refresh | Everything in Grow plus SSO and warm-up refresh |
| Klips | Team+ | $600/mo | $690/mo | 40 dashboards, up-to-the-minute refresh | Everything in Team plus custom onboarding and priority support |
| Klips for agencies | Starter | $160/mo | $180/mo | 5 dashboards, 5 clients, 4-hour refresh | Data modeling and joins, your logo, PDF reports |
| Klips for agencies | Lite | $240/mo | $270/mo | 15 dashboards, 15 clients, 1-hour refresh | Everything in Starter plus published links and scheduled reports |
| Klips for agencies | Pro | $440/mo | $490/mo | 30 dashboards, 30 clients, 30-minute refresh | Everything in Lite plus White-Label Bundle, custom domain, SSO, warm-up refresh, priority support |
| Klips for agencies | Premier | $900/mo | $1,025/mo | 80 dashboards, 80 clients, 30-minute refresh | Everything in Pro plus custom onboarding |
| PowerMetrics | Launch | $24/user/mo (from 2 users) | Not listed | 50 metrics, 4-hour refresh | PowerMetrics AI, pre-built metrics and dashboards, data feeds |
| PowerMetrics | Professional | $35/user/mo (from 3 users) | Not listed | 200 metrics, 1-hour refresh (15-minute optional) | Everything in Launch plus data warehouse and semantic layer integrations, MCP Server and Metrics API, published views, priority support |
| PowerMetrics | Custom | Custom | Annual only | Flexible metrics, users and refresh | Enterprise SSO, SLA, vendor assessment, private tenancy |
5. Databox
Best for: Mid-sized marketing teams and agencies that want AI-assisted analysis, goal tracking, and KPI dashboards.
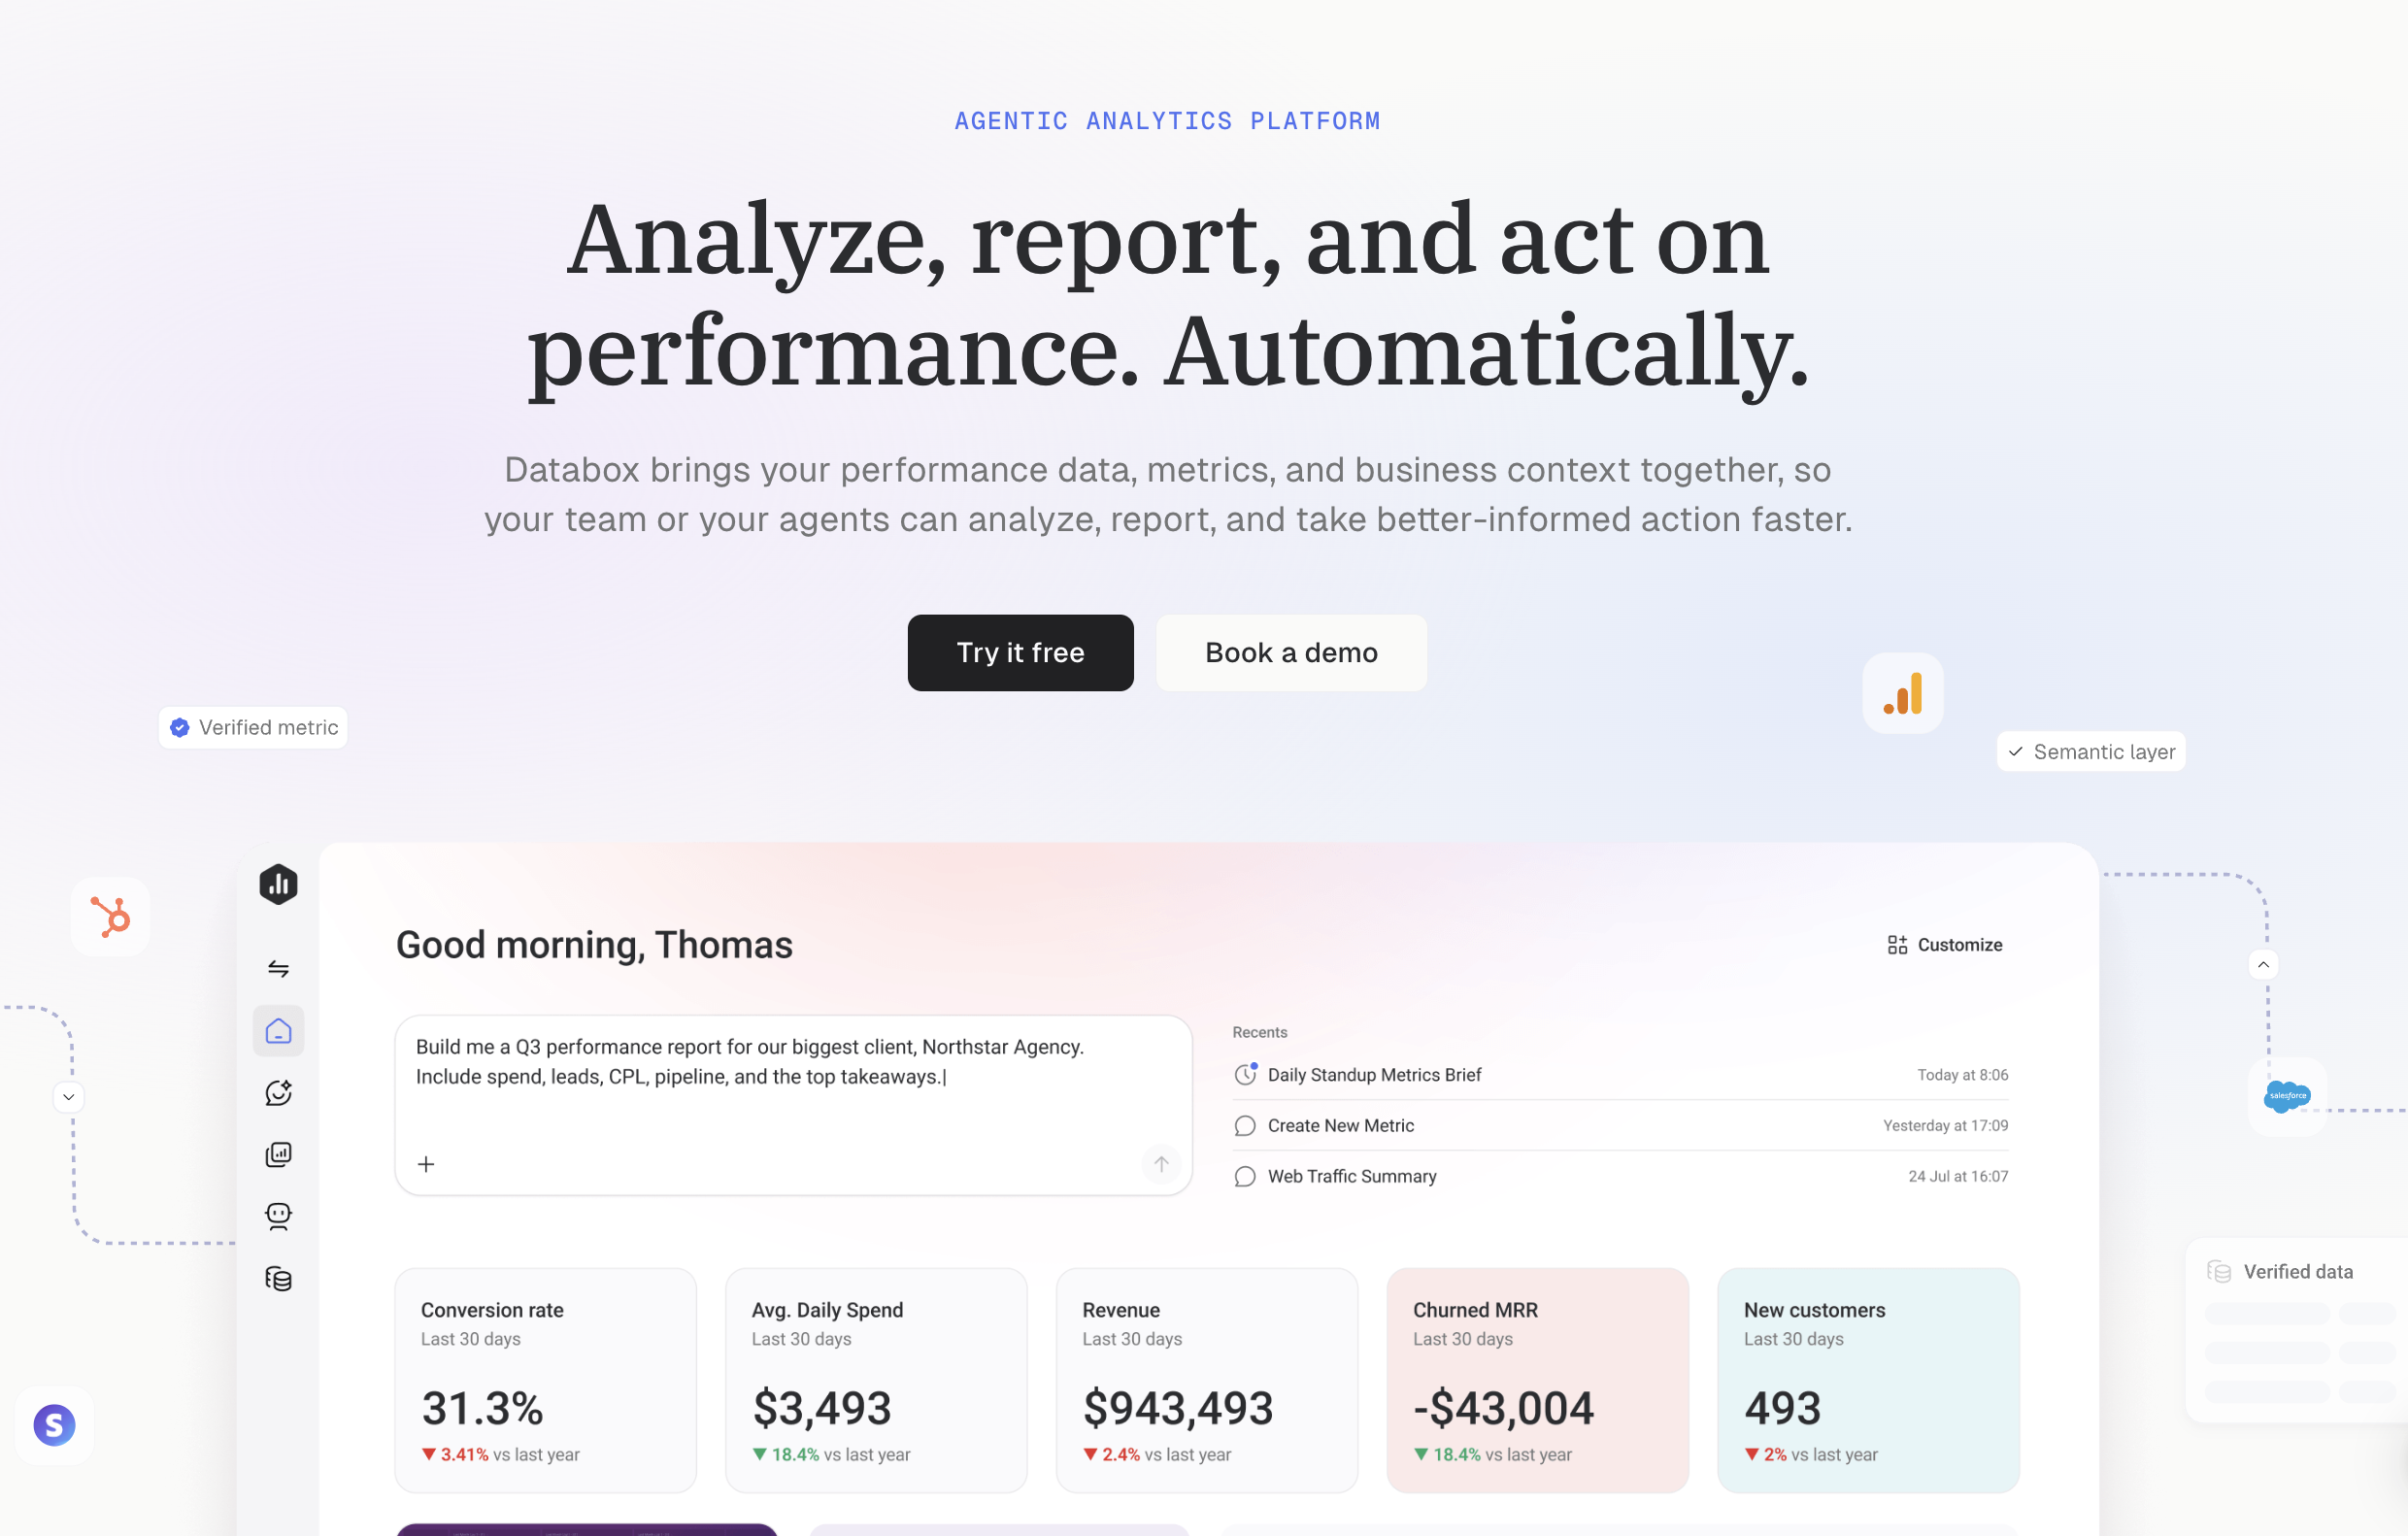
Databox is a KPI dashboard and AI analytics platform that now positions itself as an agentic analytics platform.
The headline product news is Genie, Databox's conversational AI analyst: ask a plain-language business question, get a clear answer with visual context and explanation in seconds. No SQL required, no dashboard-building needed first.
Genie launched on Product Hunt in March 2026 and is now included on every plan, including Free, with usage drawn from a monthly pool of AI credits. Recent updates let Genie search the web, build datasets through conversation, create Goals in chat, and run recurring analysis on a schedule through Routines.
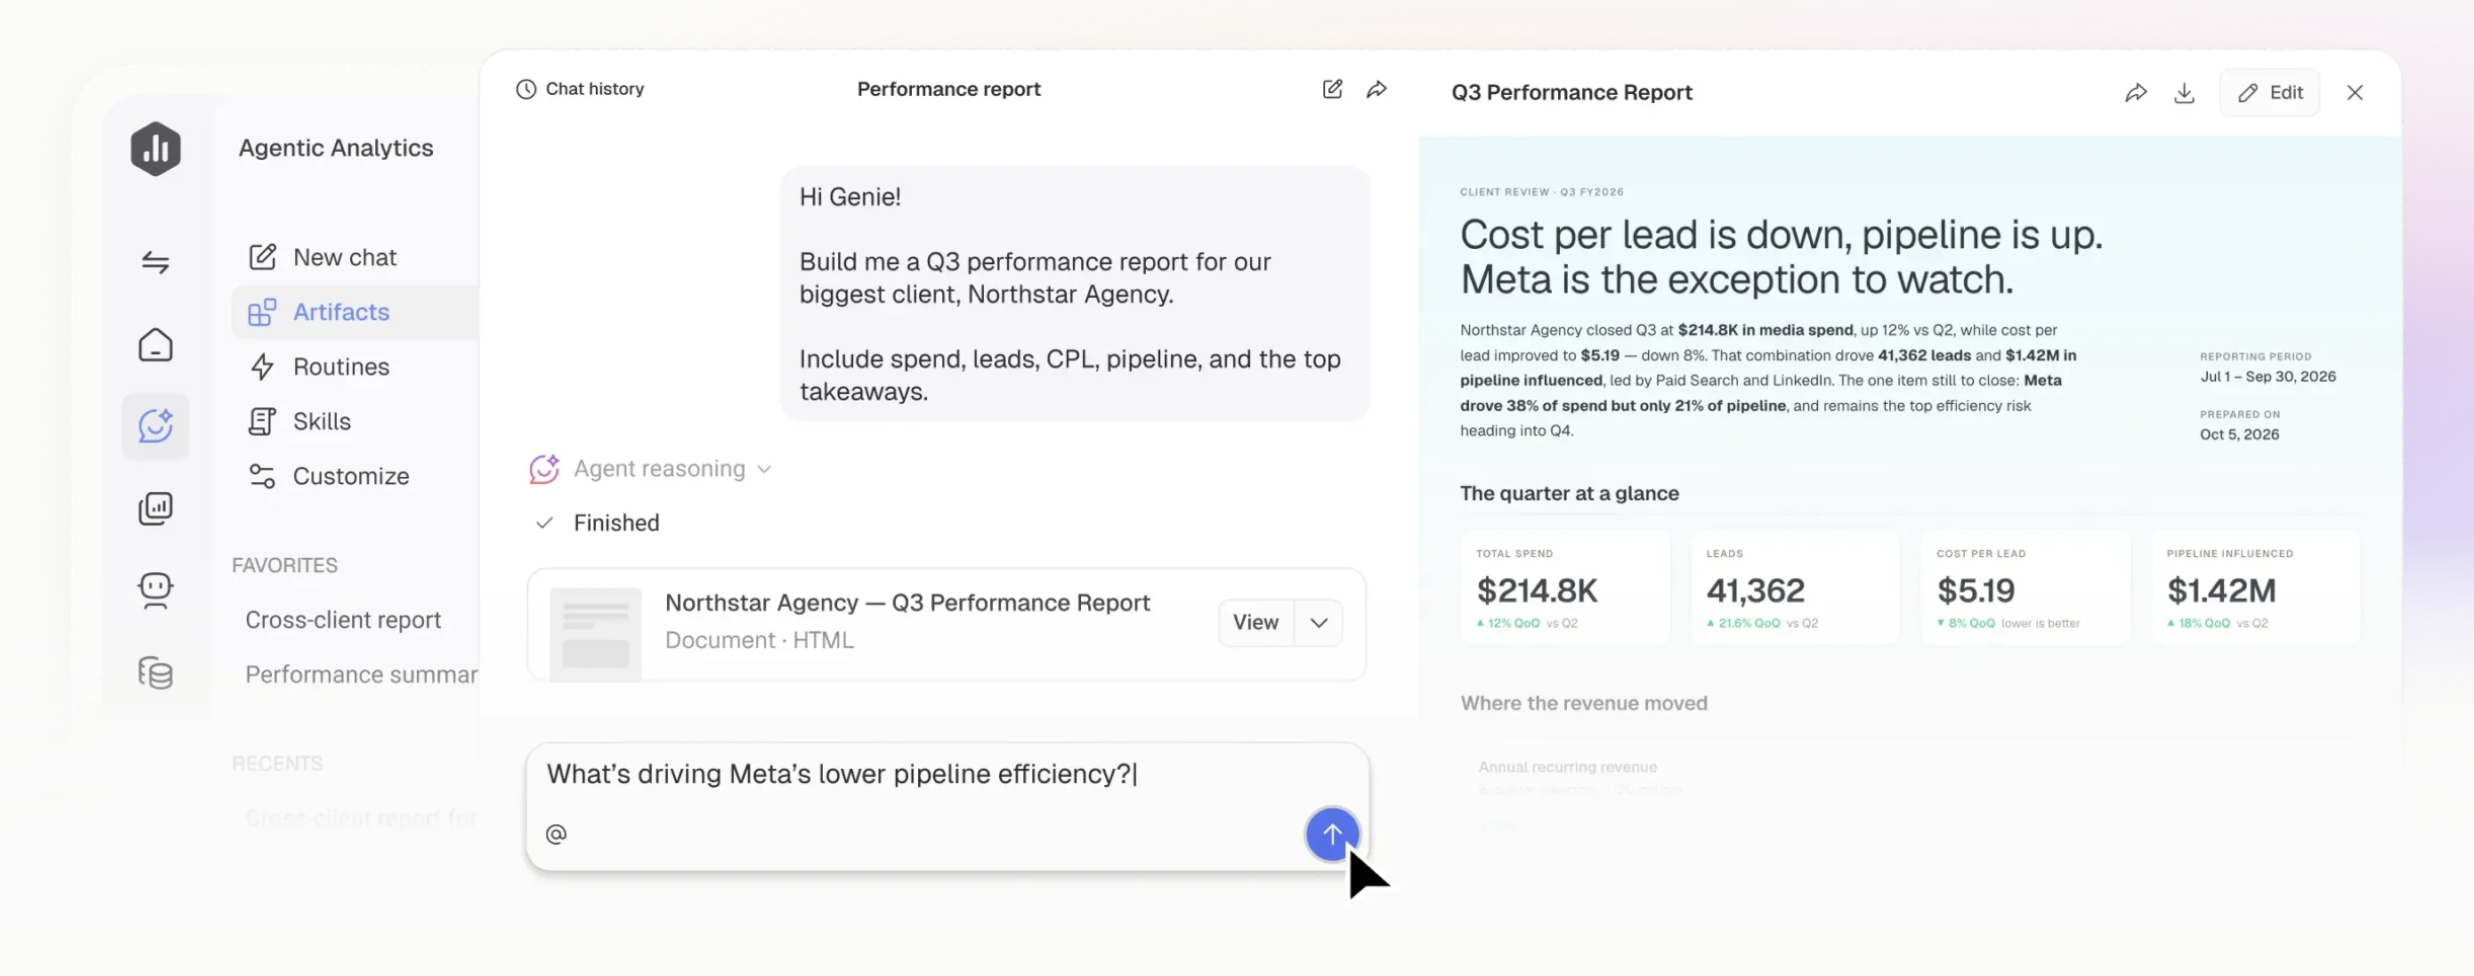
Through AI connectors, Genie can also read from and act in tools like HubSpot and Asana, with each tool set to always allow, needs approval, or blocked. Custom data integrations, on the Analyst plan and above, let you connect any data source directly rather than waiting for a native connector to be built.
Databox also has an MCP server, available on the Analyst plan and above.
You can connect it to Claude, ChatGPT or n8n to query your Databox marketing data from an AI assistant. As noted in the Whatagraph section, MCP is now table stakes across serious reporting tools.
The differentiation is what the MCP connects to: Databox's connects to Databox's internal data layer; Whatagraph's connects to a governed cross-channel foundation with custom blends and dimensions already built in.
Benchmark Groups, previously a standout for performance marketers, no longer appear in Databox's 2026 plans. Genie can now look up industry benchmarks through web search instead.
Forecast modeling, goal tracking, and Slack and email notifications are also available, while OKRs are a $160/month add-on. A recent update addressed previous data blending limitations: you can now merge multiple datasets using formulas to create custom columns.
Key features:
- 130+ integrations including Google Analytics, Google Ads, Meta, LinkedIn, HubSpot, Salesforce CRM, and Google Sheets
- Genie AI analyst for conversational plain-language Q&A
- MCP server for Claude, ChatGPT and n8n
- Forecast modeling and goal tracking (OKRs as an add-on)
- AI connectors with per-tool permissions
- Dataset merging with custom columns
- AI performance summaries
- Routines that deliver scheduled analysis by email, Slack or in-app
- Excel and spreadsheet import
- Unlimited users on the Agency plan
Databox Reviews from Real Users
“Pretty easy to follow your nose without prior experience with data.” (Source)
“After 2 years of trying, we were never able to fully launch Databox with our clients because there is always another issue with Databox.” (Source)
"the only thing that I would like Databox to improve is the speed." (Source)
Databox pricing 2026
Databox bills monthly or annually, with 20% off annual billing, and every paid plan has a 14-day free trial with no credit card required. AI features, including Genie and the MCP server, draw from a monthly pool of AI credits. Add-ons: white-labeling $200/month, OKRs $160/month, advanced security $80/month, fiscal calendar $40/month, and 15-minute sync $14/month per source.
Plan | Billed annually | Billed monthly | Users | Data sources | AI credits/mo |
| Free | $0 | $0 | 1 | 3 | 50 |
| Analyst | $71/mo | $89/mo | 1 | 5 | 150 |
| Team Core | $199/mo | $249/mo | 3 | 10 | 500 |
| Team Scale | $319/mo | $399/mo | 10 | 30 | 1,000 |
| Agency | From $79/mo | From $99/mo | Unlimited | 20 (4 accounts) | 300 |
| Agency account pack | $20/mo | $25/mo | 1 account | +5 | +50 |
| Custom | Custom | Custom | Custom | Custom | Custom |
6. Tableau
Best for: Enterprise data teams with complex, multi-source analytics needs and dedicated BI headcount.
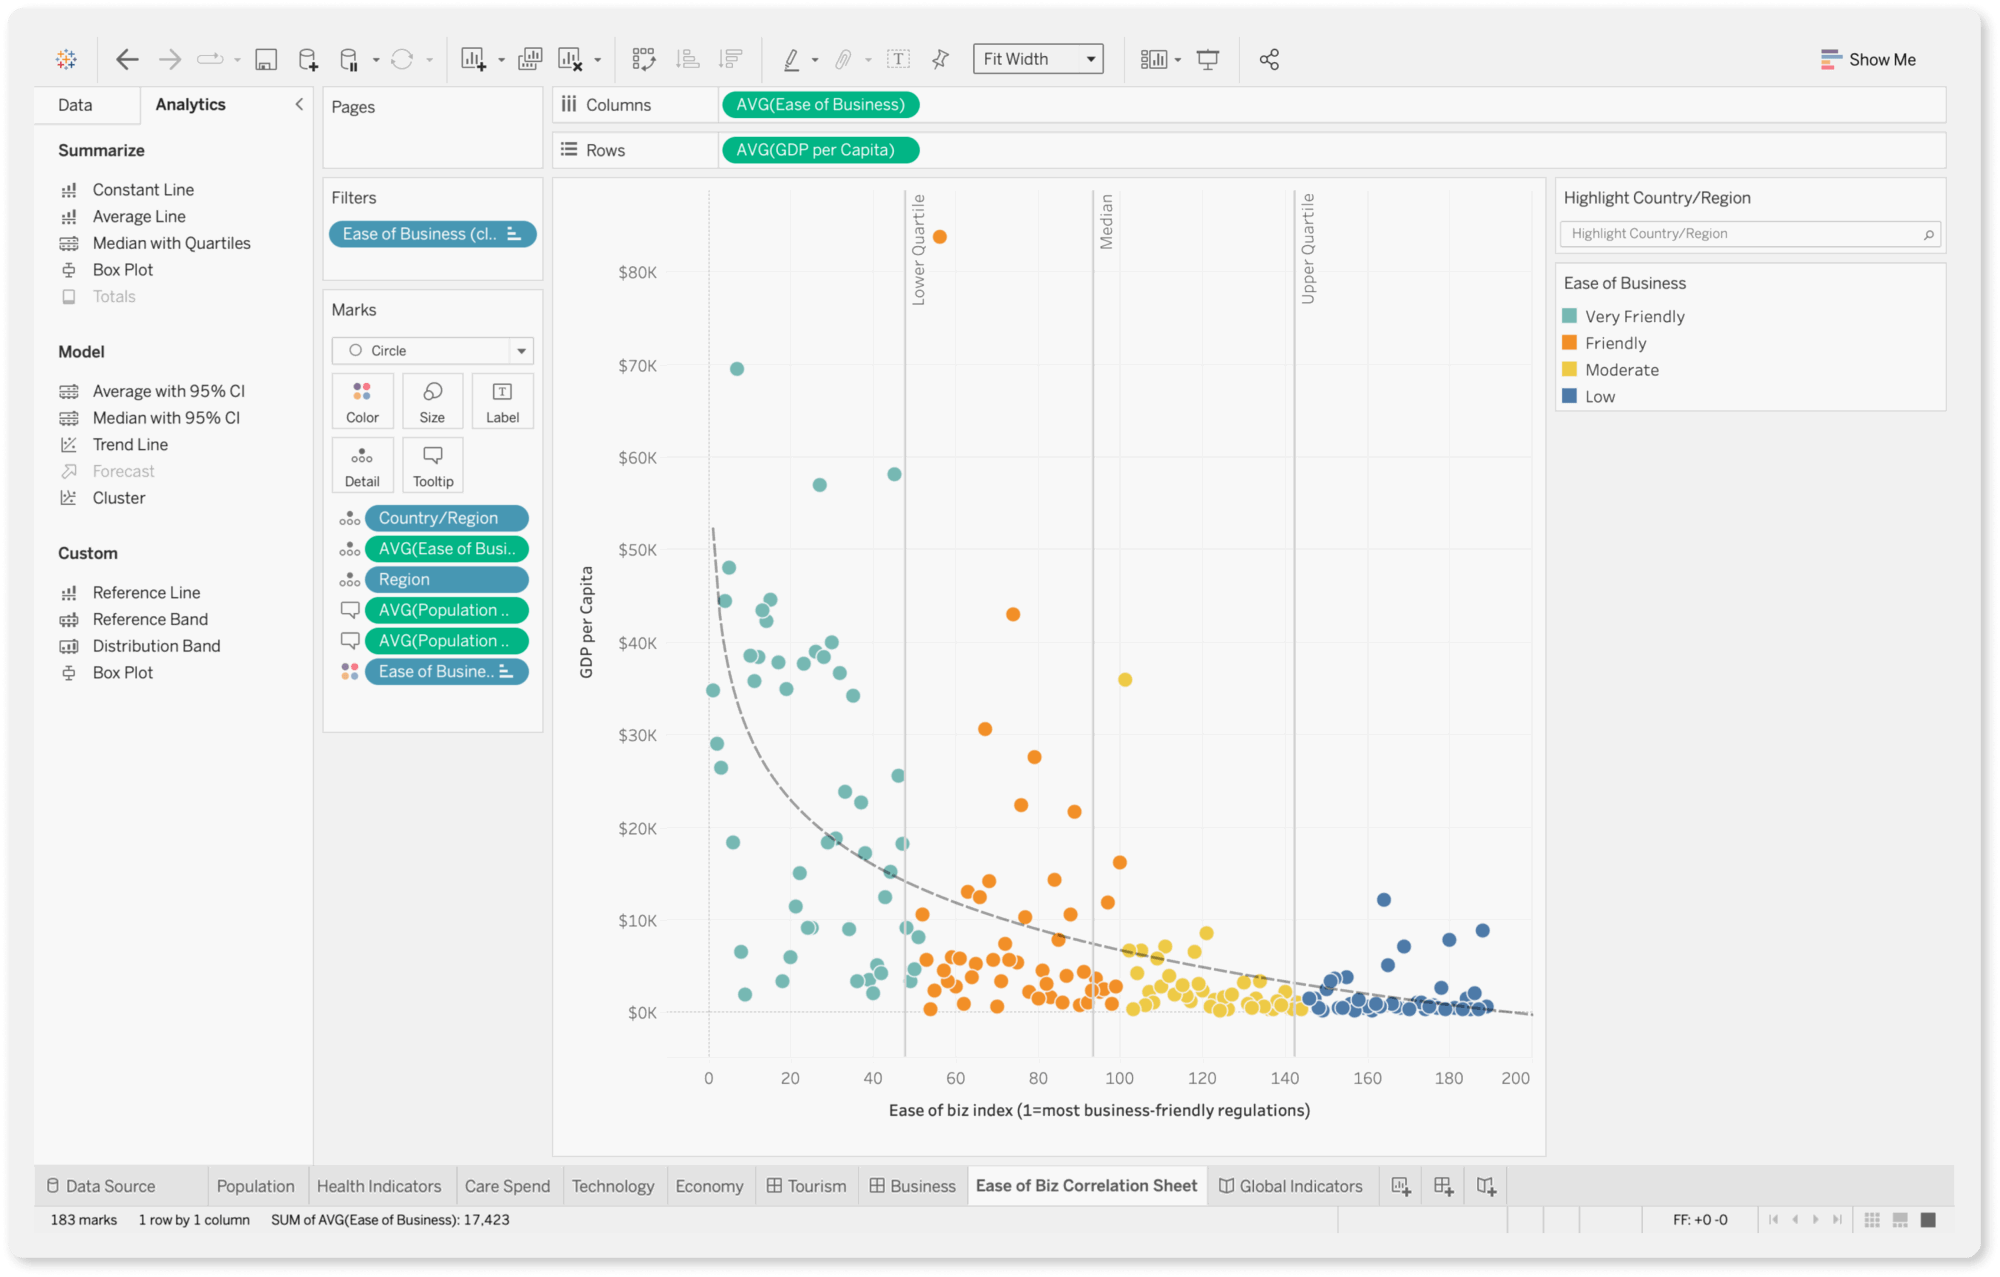
Tableau is Salesforce's enterprise business intelligence platform, a data analysis and visualization tool in one. If you’re looking for an enterprise-level business intelligence solution, Tableau is a great choice.
In 2026, Tableau has four key improvements:
- Tableau Pulse: This is the biggest shift in recent years. Instead of users having to dig through dashboards, Pulse proactively sends personalized KPI "digests" to Slack, Teams, or email. It uses AI to explain why a metric moved (e.g., "Your CPC increased because of a surge in weekend traffic"). The 2026.2 release added point-in-time metrics for snapshot values like inventory or headcount.
- Tableau Agent (formerly Einstein Copilot): Salesforce has rebranded Einstein's capabilities into Tableau Agent. This is a conversational assistant that lets you build complex calculations, pivot tables, and even entire visualizations using natural language prompts. A conversational version inside dashboards entered beta in July 2026.
- Tableau+ Tier: Launched for the highest-level enterprise needs, the Tableau+ Bundle combines Tableau Cloud+ with Tableau Next, Tableau's agentic analytics product. Tableau Next's Auto Semantic Model Creation (beta) builds semantic models from plain-language descriptions.
- Tableau MCP: Hosted Tableau MCP is generally available for Tableau Cloud on all editions, so you can connect Claude and other MCP-compatible AI tools to your Tableau data.
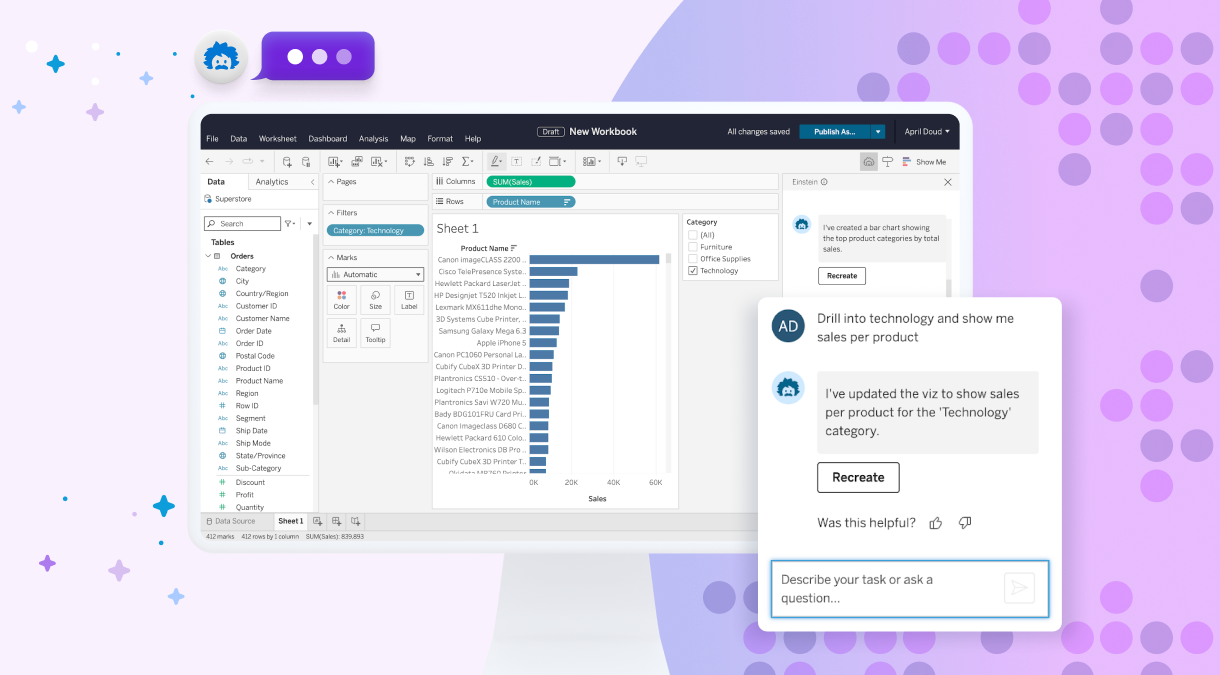
For a powerful data analysis tool, Tableau is still easy to use with a drag-and-drop interface and visual query builder. You can generate insights quickly and share them with stakeholders through reports.
You can perform complex data analysis, uncover trends, and identify opportunities for optimization using features such as trend lines, forecasting, and clustering. These are granular things that you can’t do on AgencyAnalytics.
If you need help, you can go to Tableau community forums and ask your questions. A current Tableau user or a moderator will answer you. You can also purchase “Success Plans” that come with personalized training and support.
Unlike Whatagraph or AgencyAnalytics, Tableau has a steep learning curve. While basic drag-and-drop is intuitive, mastering "Level of Detail" (LOD) expressions or complex data blending requires dedicated training.
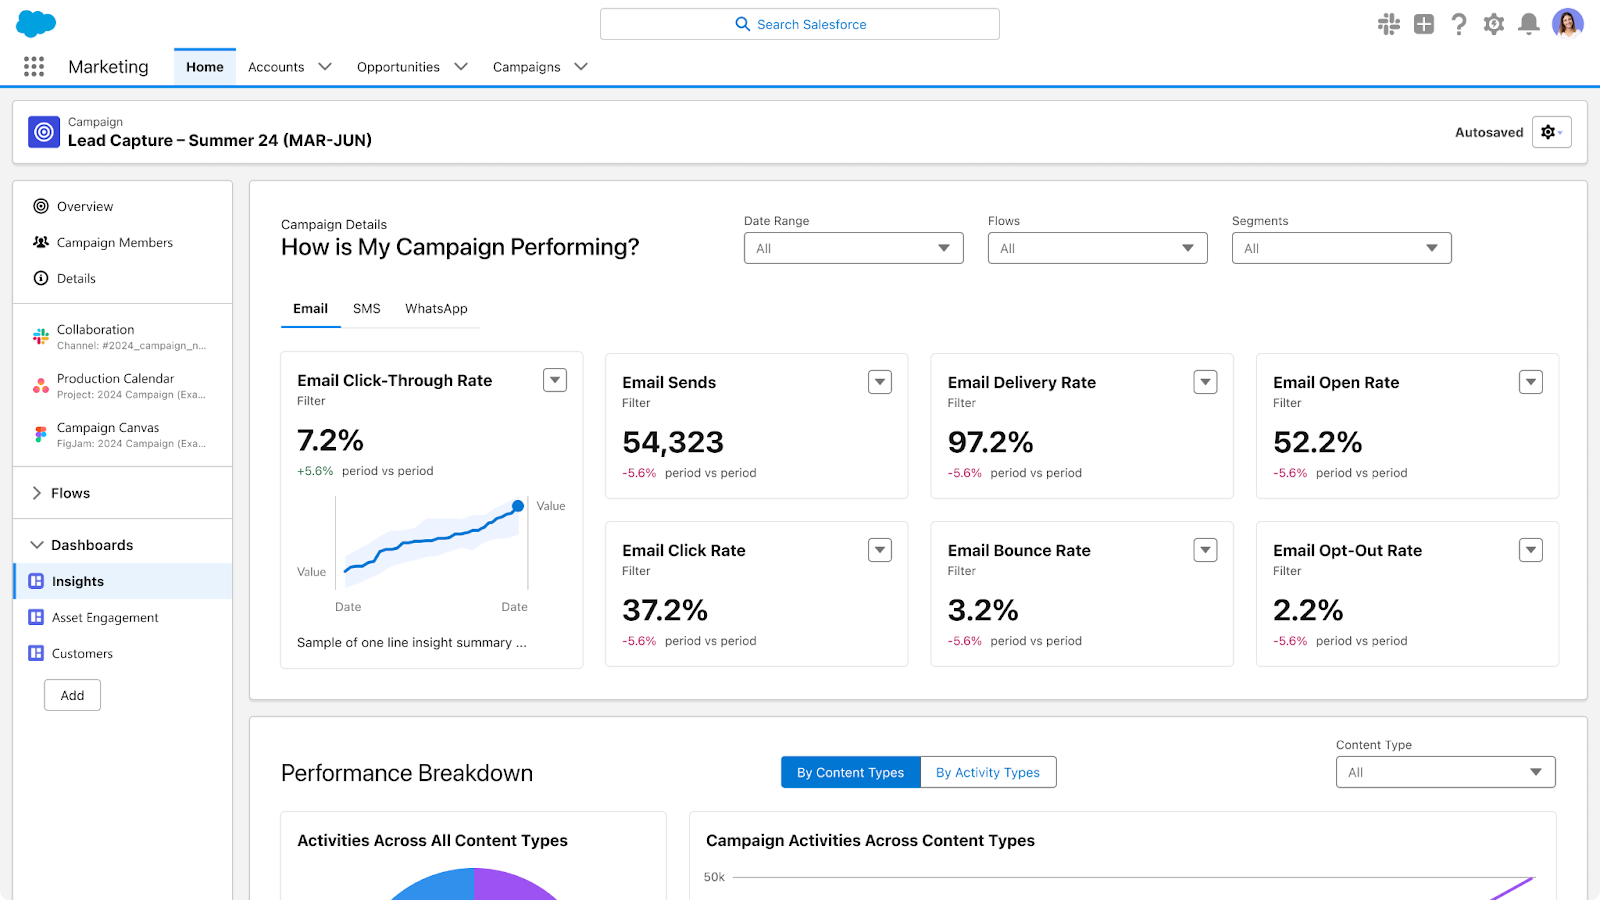
However, Tableau is (a lot) more expensive than AgencyAnalytics as it’s mainly for enterprises.
Key features:
- 90+ connectors including Google Analytics, Salesforce CRM, and data warehouses
- Tableau Agent for natural-language calculations, visualizations and dashboard questions
- Tableau Pulse KPI digests to Slack, Teams, and email
- Auto-generated semantic models (Tableau Next, beta)
- AI-powered color palettes
- Radial charts (Tableau Next) and Sankey diagrams
- Trend lines and forecasting
- Snowflake and BigQuery connectivity
- Hosted Tableau MCP for Claude and other AI tools
Tableau reviews from real users:
“Tableau creates beautiful, professional-looking graphs, maps, and dashboards that are easy to understand and present.” (Source)
“Software is very complex and sophisticated.” (Source)
“The licensing cost adds up quickly as more users need access, and it requires a good amount of system resources, so performance slows with large datasets.” (Source)
Tableau pricing 2026
All Tableau products require an annual contract, and prices are per user per month. Every deployment needs at least one Creator license, with Explorer and Viewer licenses for other users. Tableau Desktop Free Edition costs nothing but can't publish to Tableau Cloud or Tableau Server.
Product | Edition | Price (billed annually) | What's included |
| Tableau Cloud | Standard | From $15/user/mo | Web authoring, Tableau Desktop and Prep Builder, Tableau Pulse |
| Tableau Cloud | Enterprise | From $35/user/mo | Everything in Standard plus Advanced Management, Data Management, 10 sites, eLearning |
| Tableau Cloud | Cloud+ | Contact sales | Everything in Enterprise plus Tableau Knowledge, Tableau Agent in Tableau Cloud and Pulse, Premier Success, 50 sites, Release Preview access |
| Tableau Server | Tableau | From $15/user/mo | Web authoring, Tableau Desktop and Prep Builder, Tableau Agent in Authoring and Prep |
| Tableau Server | Enterprise | From $35/user/mo | Everything in Tableau plus Advanced Management and Data Management |
| Tableau Server | Server+ | Contact sales | Everything in Enterprise plus non-production environments, pre-built containers, Premier Success |
| Tableau Next | Tableau Next | From $40/user/mo | Tableau Agent, Tableau Semantics, native Slack integration |
| Tableau Cloud and Next | Tableau+ Bundle | Contact sales | Everything in Tableau Cloud+ plus Tableau Next |
7. Google Data Studio (formerly Looker Studio)
Best for: Freelancers, boutique agencies, and Google-centric marketing teams working with modest budgets.
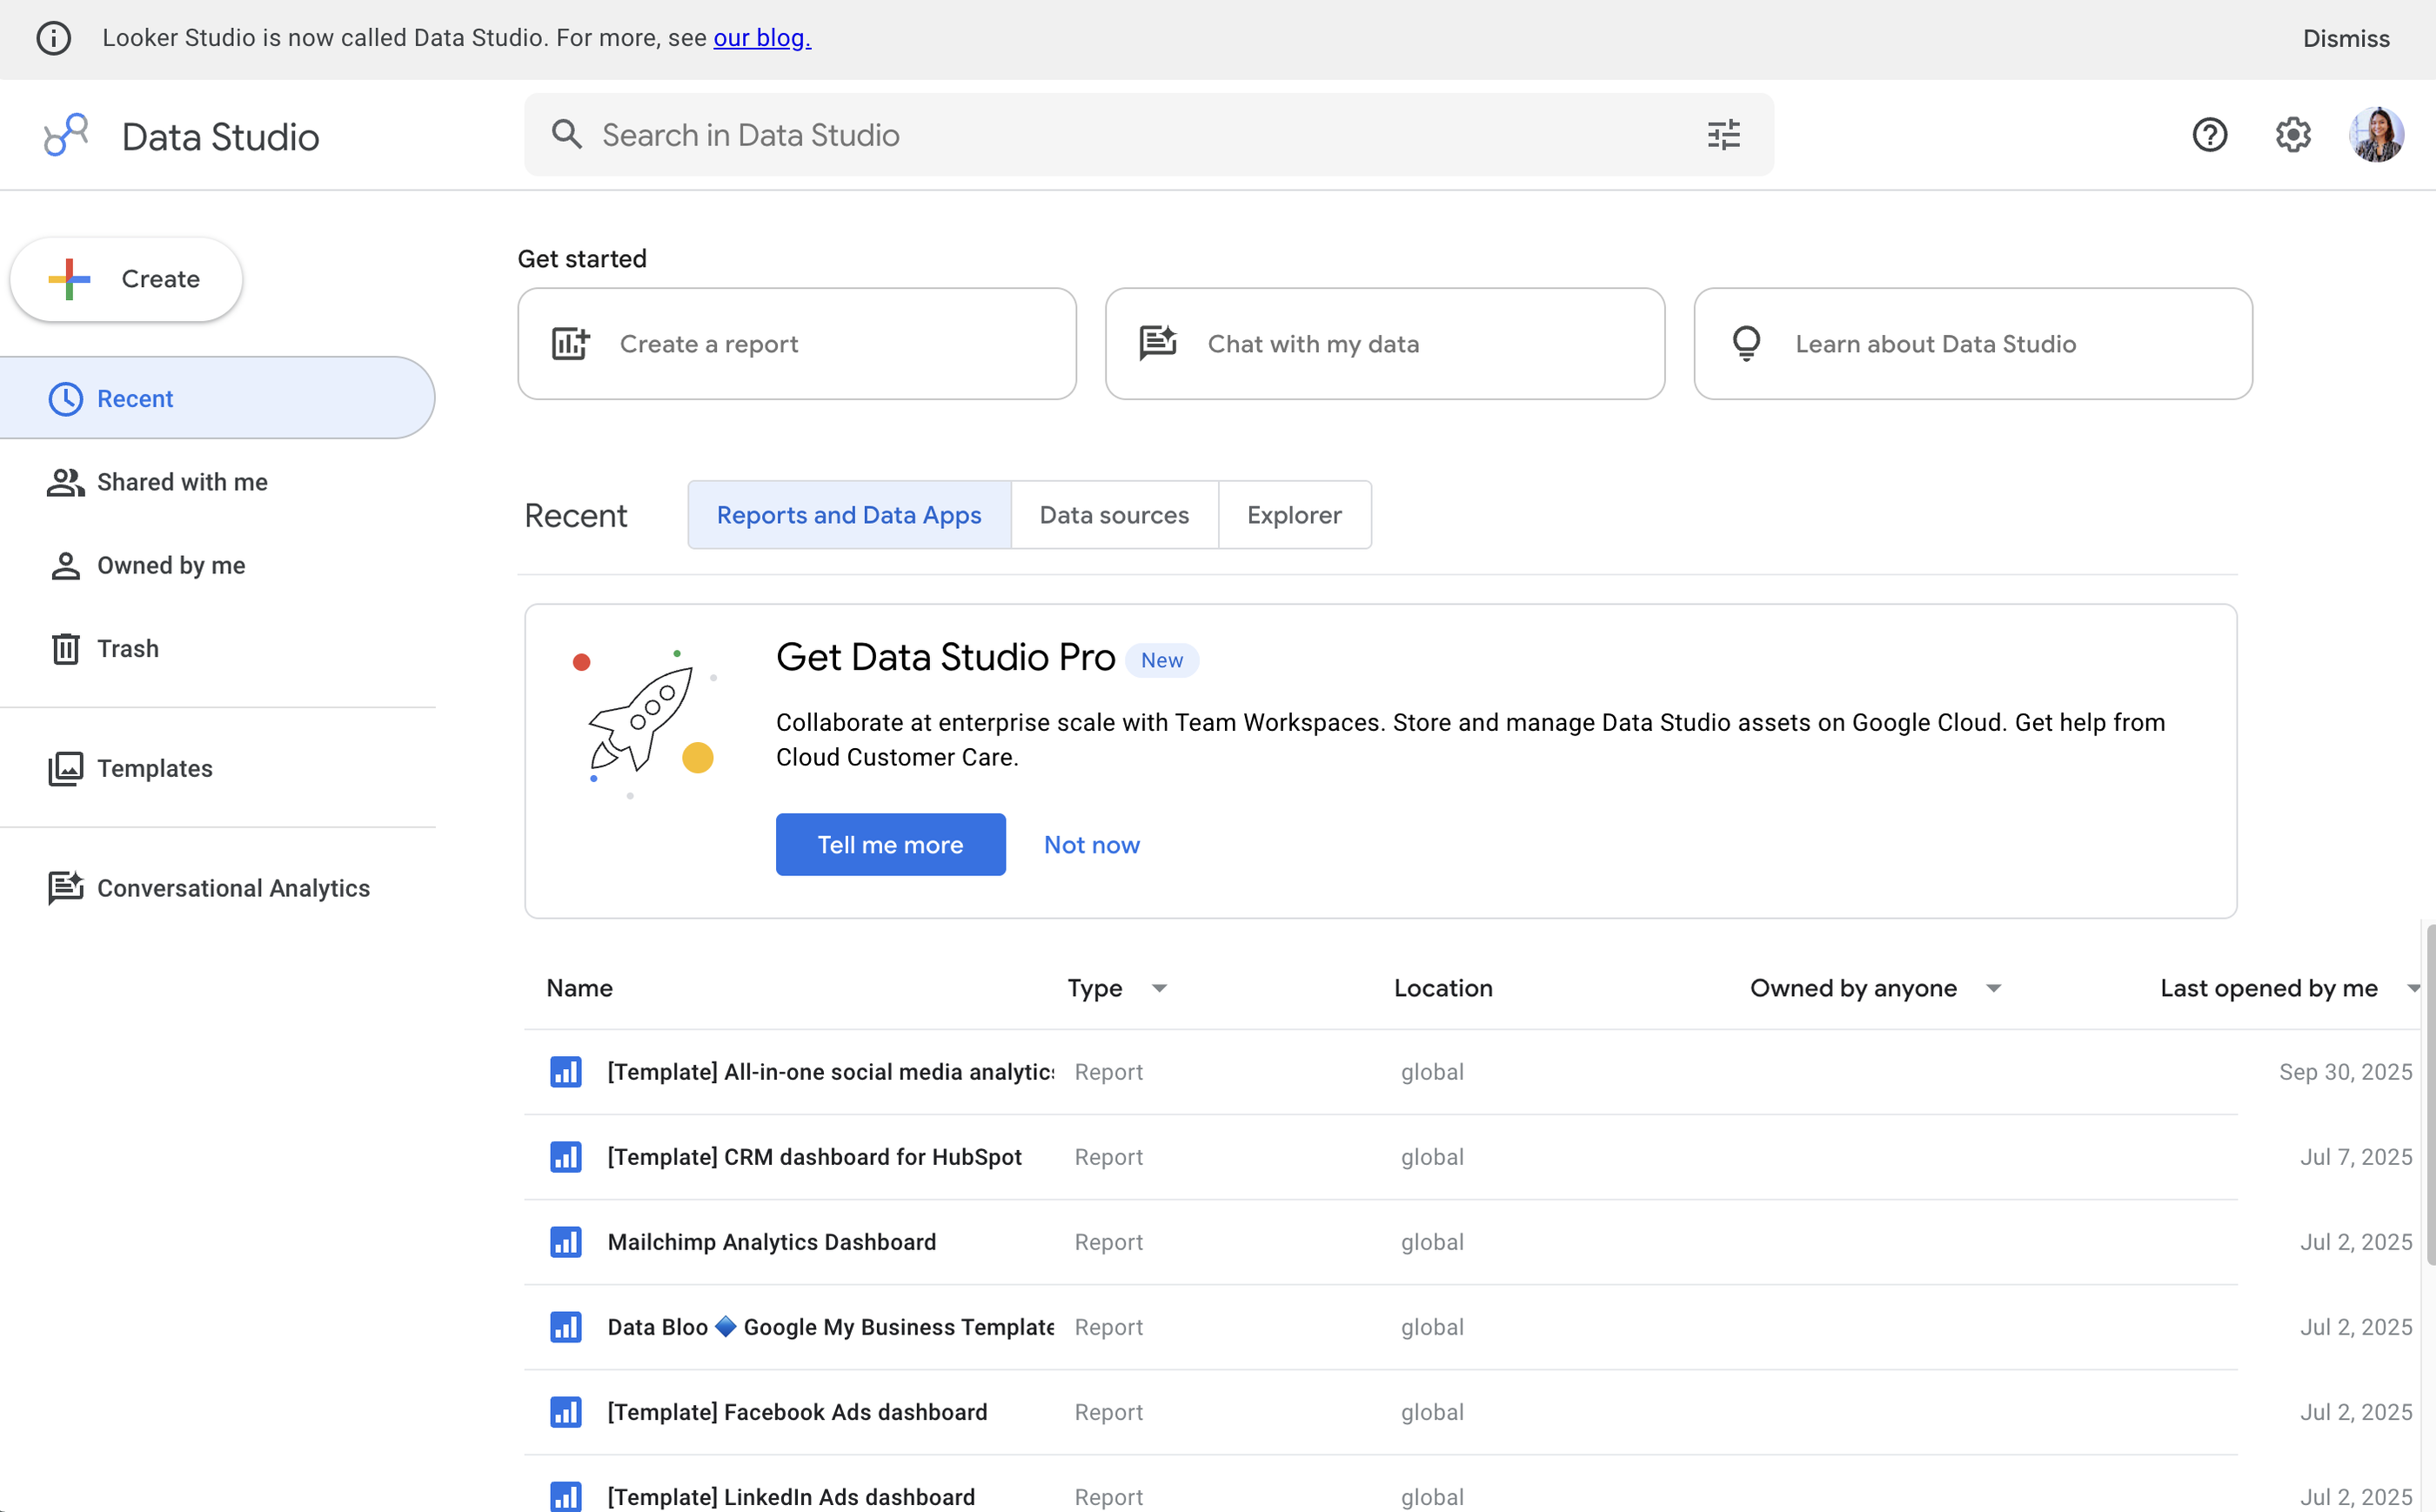
Data Studio (called Looker Studio from 2022 until Google's April 2026 rebrand) is Google's free reporting tool and a popular choice among marketers.
Data Studio comes with 21 native integrations with Google-based platforms like Google Ads, DV 360, Google Sheets, and Google Analytics. You can also connect to BigQuery, MySQL, and Microsoft SQL servers. Google says Data Studio connects to more than 1,400 data sources once you add partner connectors.
In 2026, Data Studio shipped three major upgrades:
1. The biggest update this year is Conversational Analytics, which became generally available to all Data Studio users in July 2026. You ask questions in plain language, and data agents built in BigQuery answer them inside Data Studio.
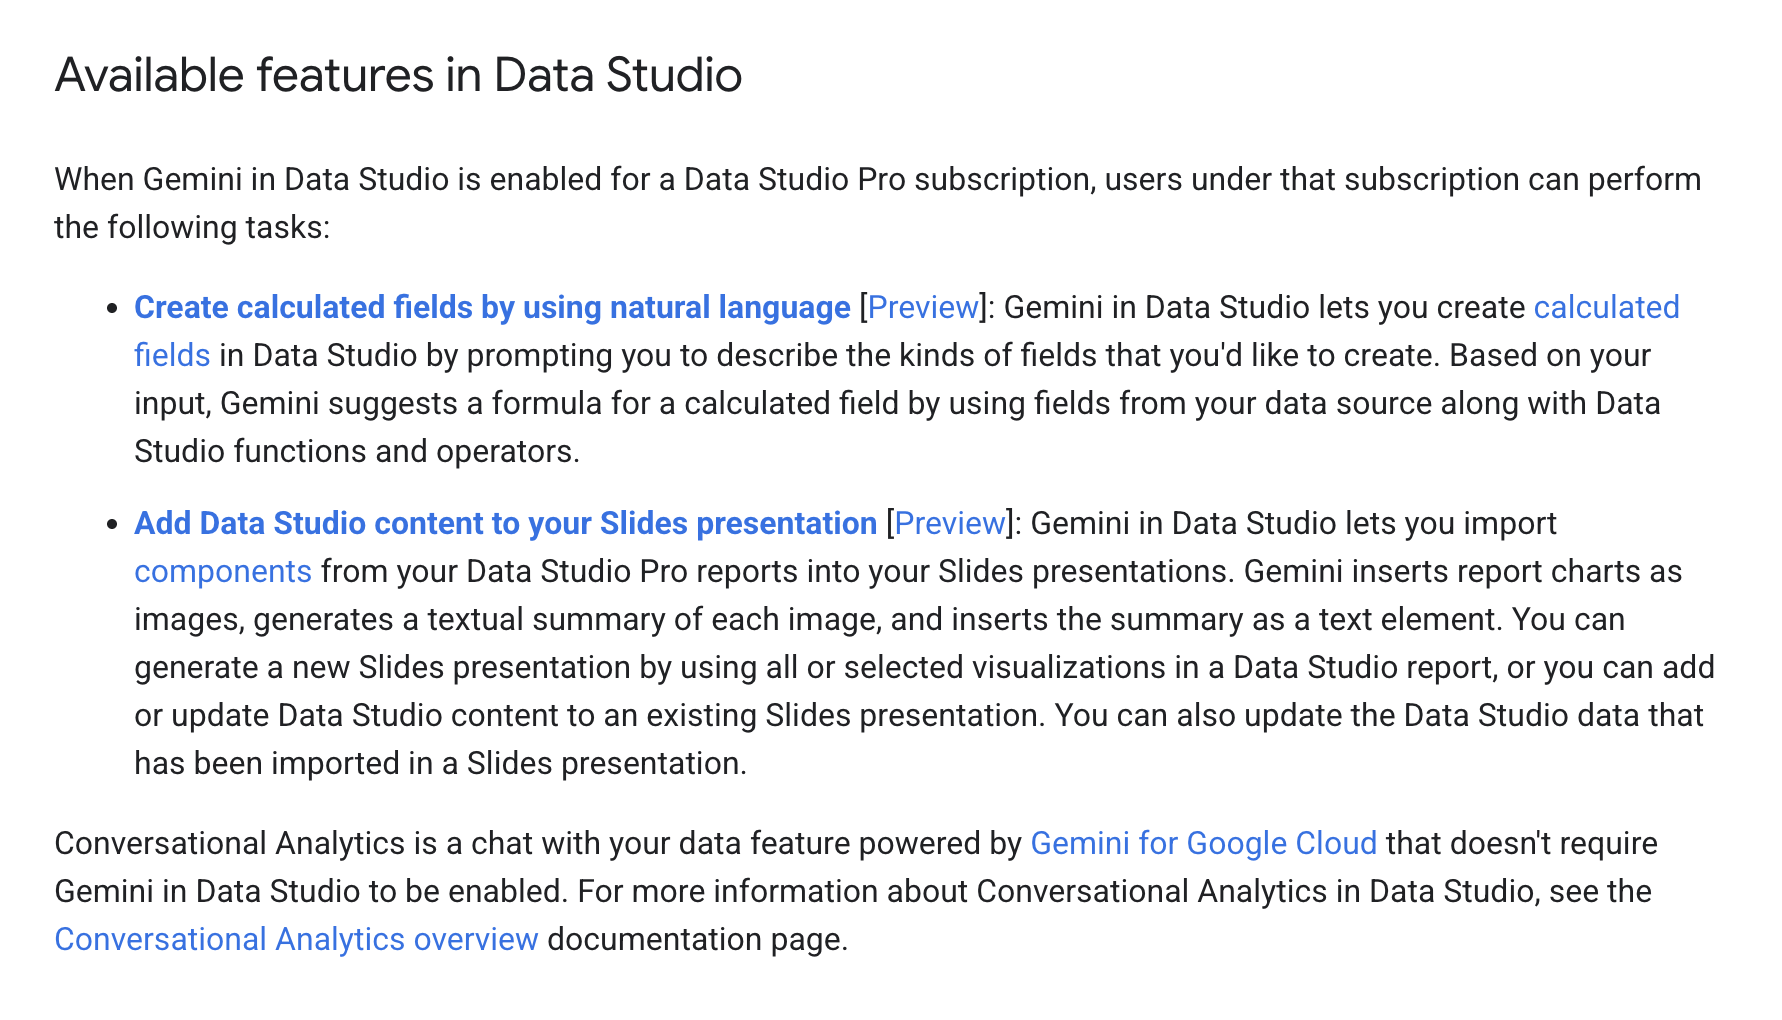
Gemini in Data Studio can also interpret natural-language prompts to help build calculated field formulas, reducing the manual effort required to write complex expressions.
2. In April 2026, Google renamed Looker Studio back to Data Studio and redesigned the home page, which now puts reports and data sources next to BigQuery data agents and Colab notebooks.
3. Report building got a steady stream of upgrades: histogram charts (January), viewer-triggered data refresh (June), fullscreen charts and copy-chart-as-image (August), and a union operator for blends (November 2026).
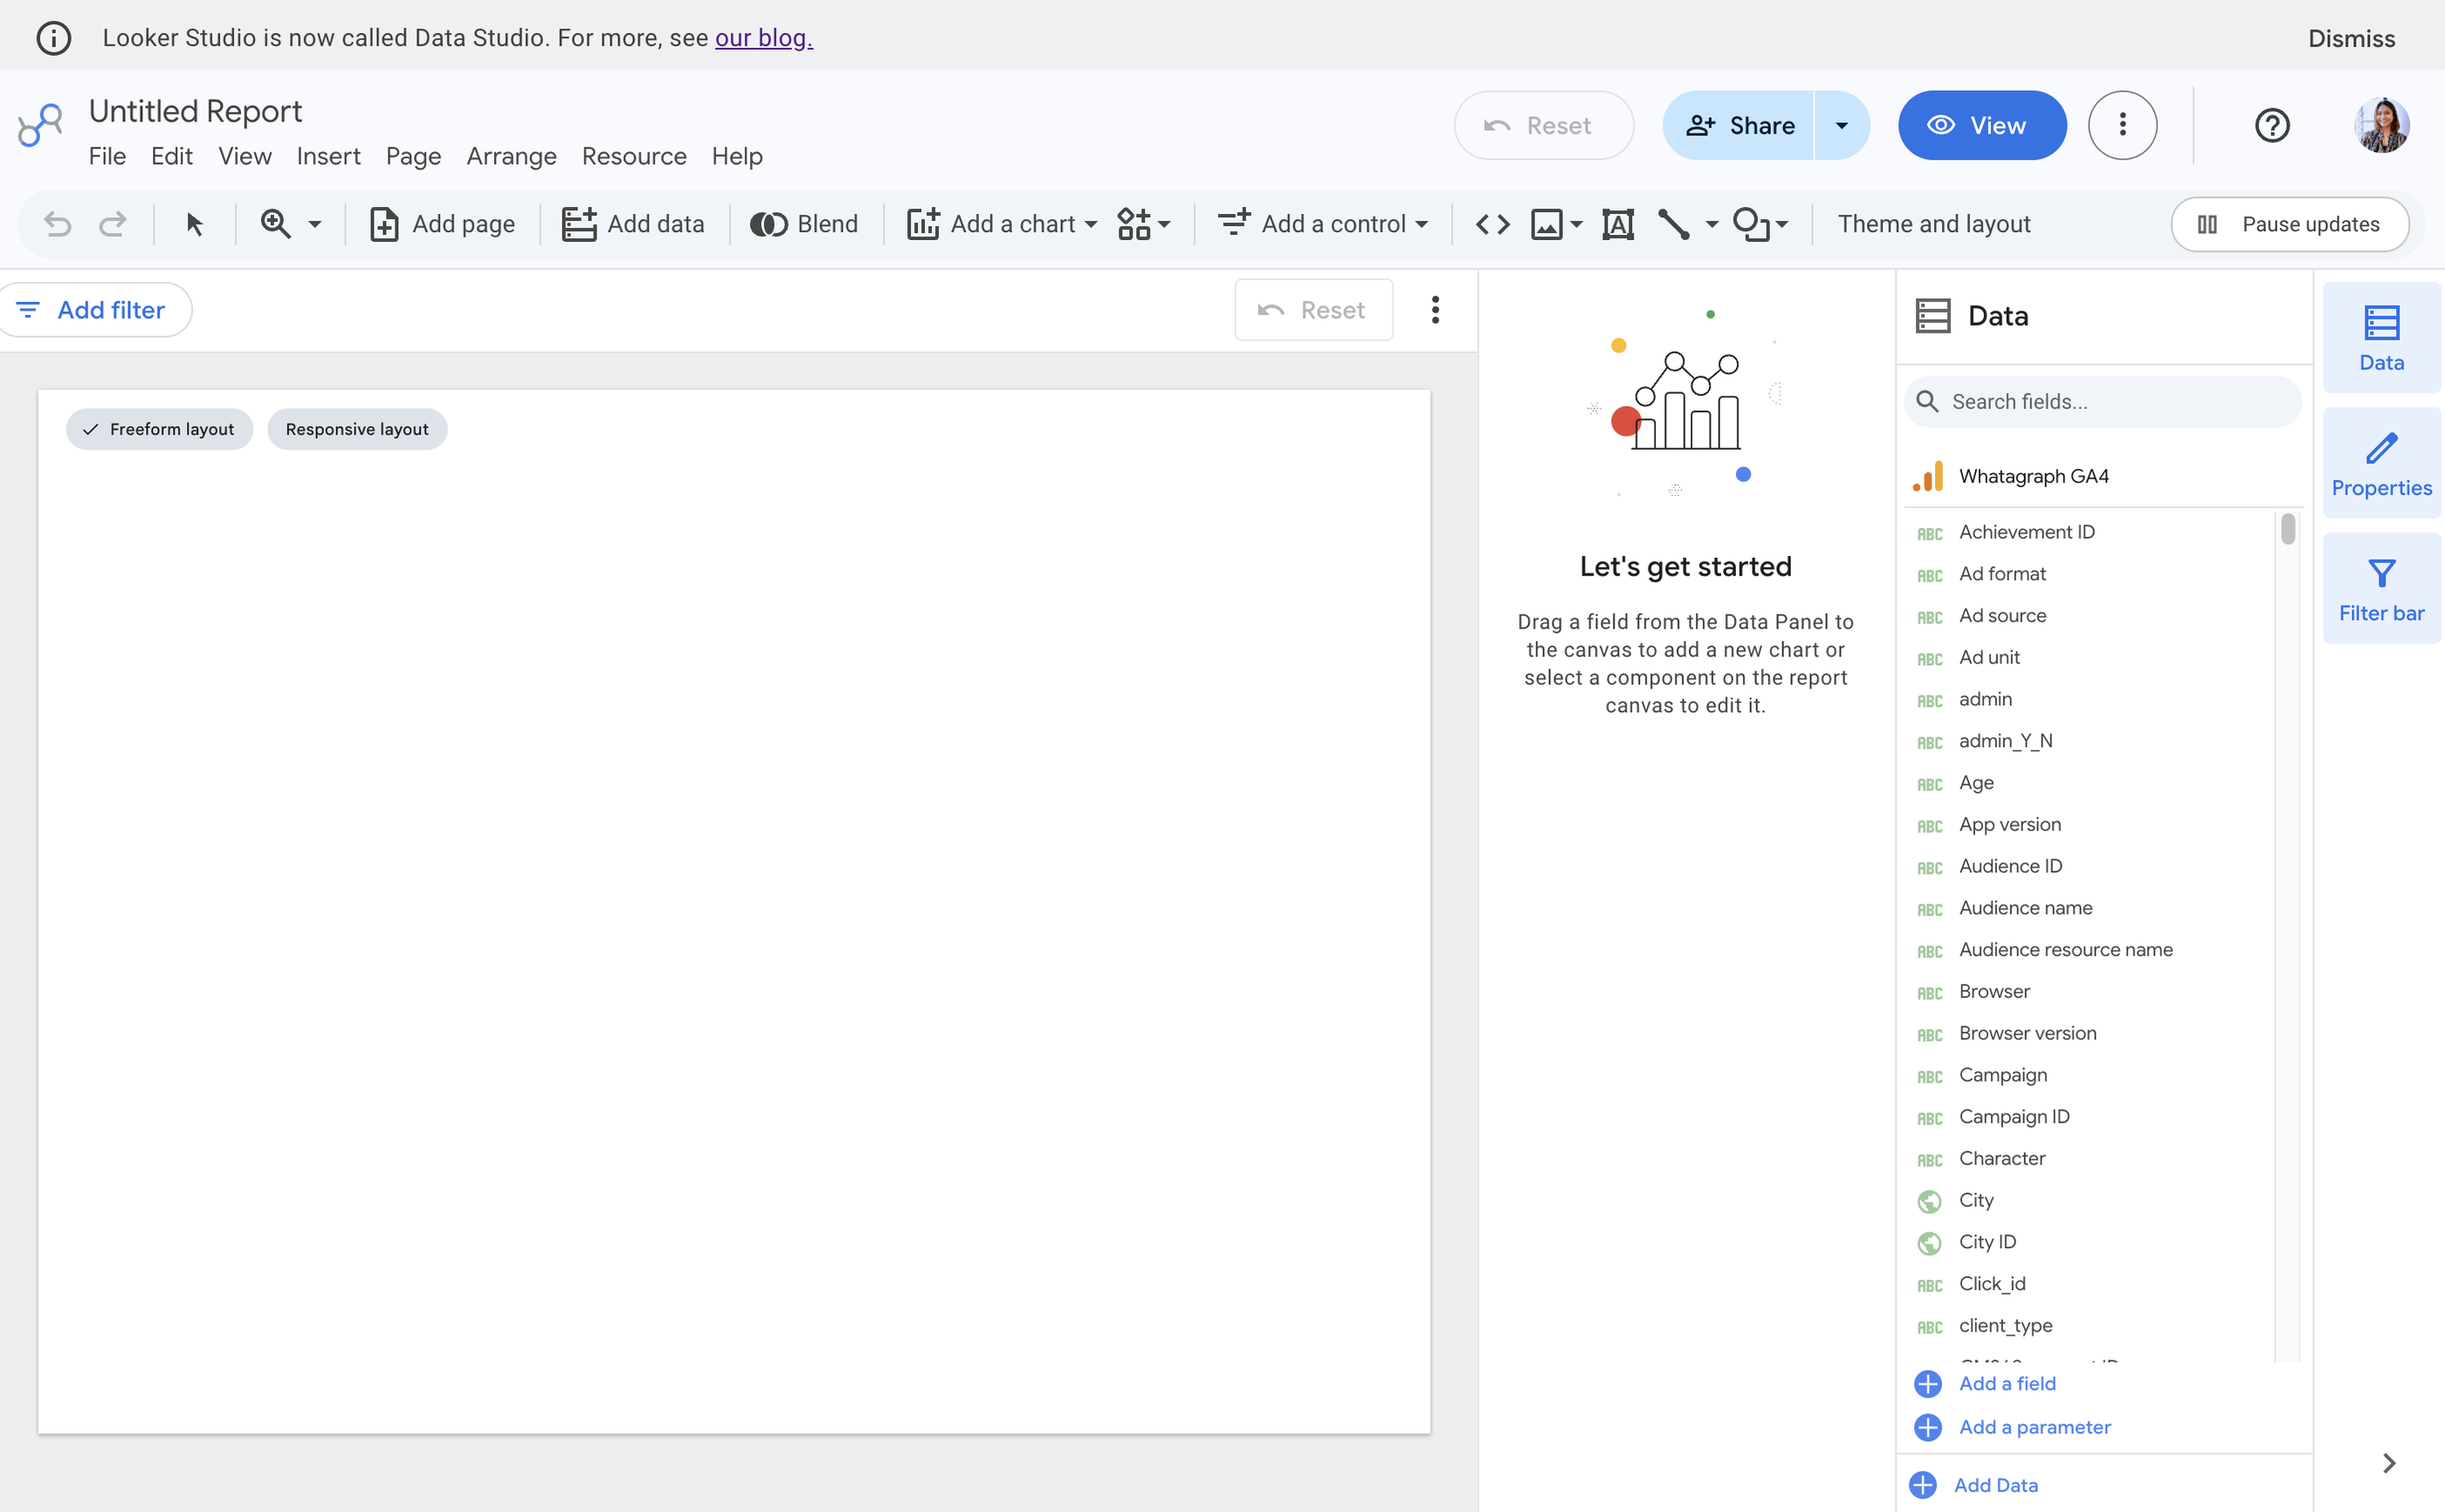
Compared to AgencyAnalytics, you can create very detailed and customized dashboards on Data Studio, depending on how well you know Data Studio's editor. But Data Studio can be slow, clunky, and doesn’t come with customer support (unless you buy the Pro plan).
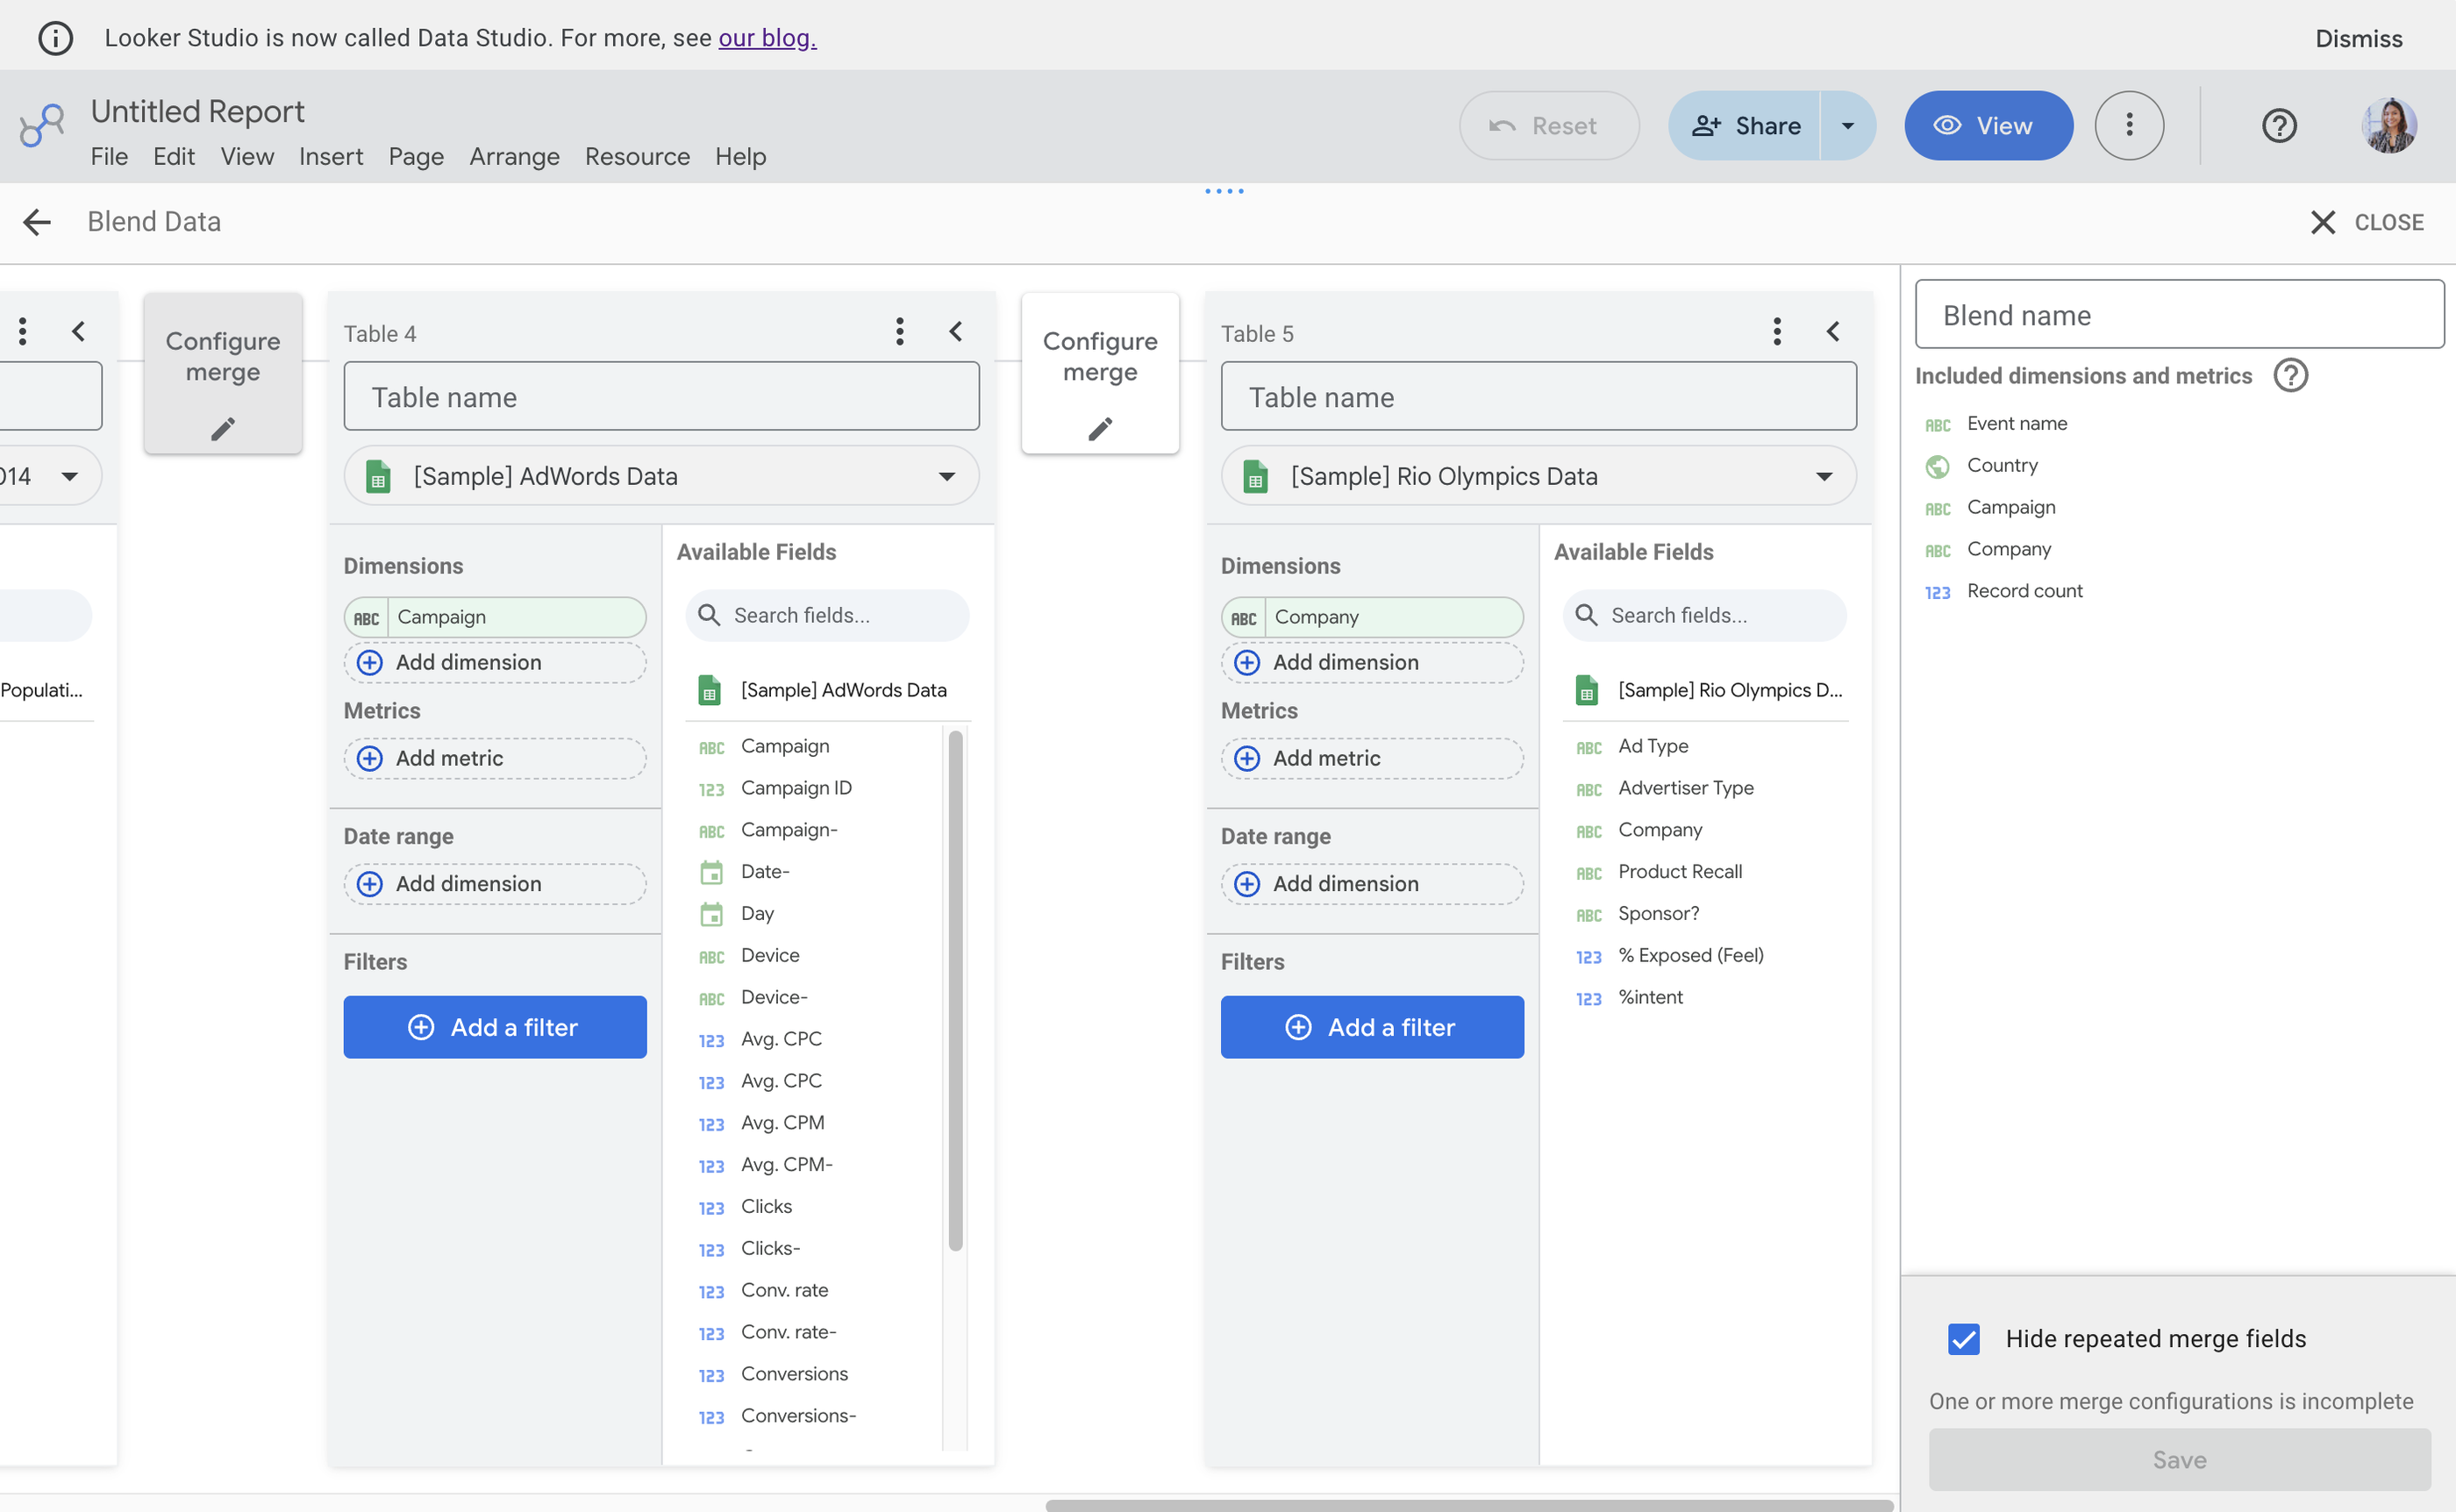
Plus, while Data Studio supports data blending, it’s report-specific. Unlike Whatagraph, which allows you to create a master metric once and use it everywhere, Data Studio requires you to rebuild complex blends for every new report.
Key features:
- Free Google connectors plus 1,300+ community connectors, many of them paid
- Drag-and-drop report builder
- Conversational Analytics with BigQuery data agents (all users)
- Team workspaces and content management (Pro)
- Fullscreen charts and chart export as PNG
- Google Sheets and Excel import
- Cross data source filtering
- Customer-managed encryption keys (Pro)
- Deeply embedded in the Google Cloud and BigQuery ecosystem
Data Studio reviews from real users
“What I like best about Looker Studio is how flexible it is for turning data into visuals.” (Source)
“Sometimes it gets really slow and lags when multiple data sources are connected.” (Source)
“Looker Studio is weak when it comes to integrating data from third-party tools outside the Google ecosystem, such as Bing or Yandex.” (Source)
Data Studio pricing 2026
Data Studio itself is free for report creators and viewers. Data Studio Pro is billed monthly per license, each subscription is tied to one Google Cloud project, and Google says the per-user price varies with subscription length. Even on the free version, most agencies pay for partner connectors, and sometimes for BigQuery.
Plan or cost | Price | What you get |
| Data Studio | Free | Self-service reports and dashboards, Google connectors, unlimited viewers, Conversational Analytics with BigQuery data agents |
| Data Studio Pro | $9/user/project/mo | Everything in Data Studio plus team workspaces, content management, Google Cloud support, and advanced security controls including customer-managed encryption keys (CMEK) |
| Partner connectors | $25 to $400+/mo | Third-party connectors such as Supermetrics or Power My Analytics for Meta Ads, TikTok or LinkedIn data, priced by data volume |
| BigQuery usage | Usually a few dollars a month for small-to-mid agencies | Storage and query costs if you store data in BigQuery to speed up slow reports |
8. Grow
Best for: Data analysts and operations managers at medium to large enterprises who need a centralized single source of truth.
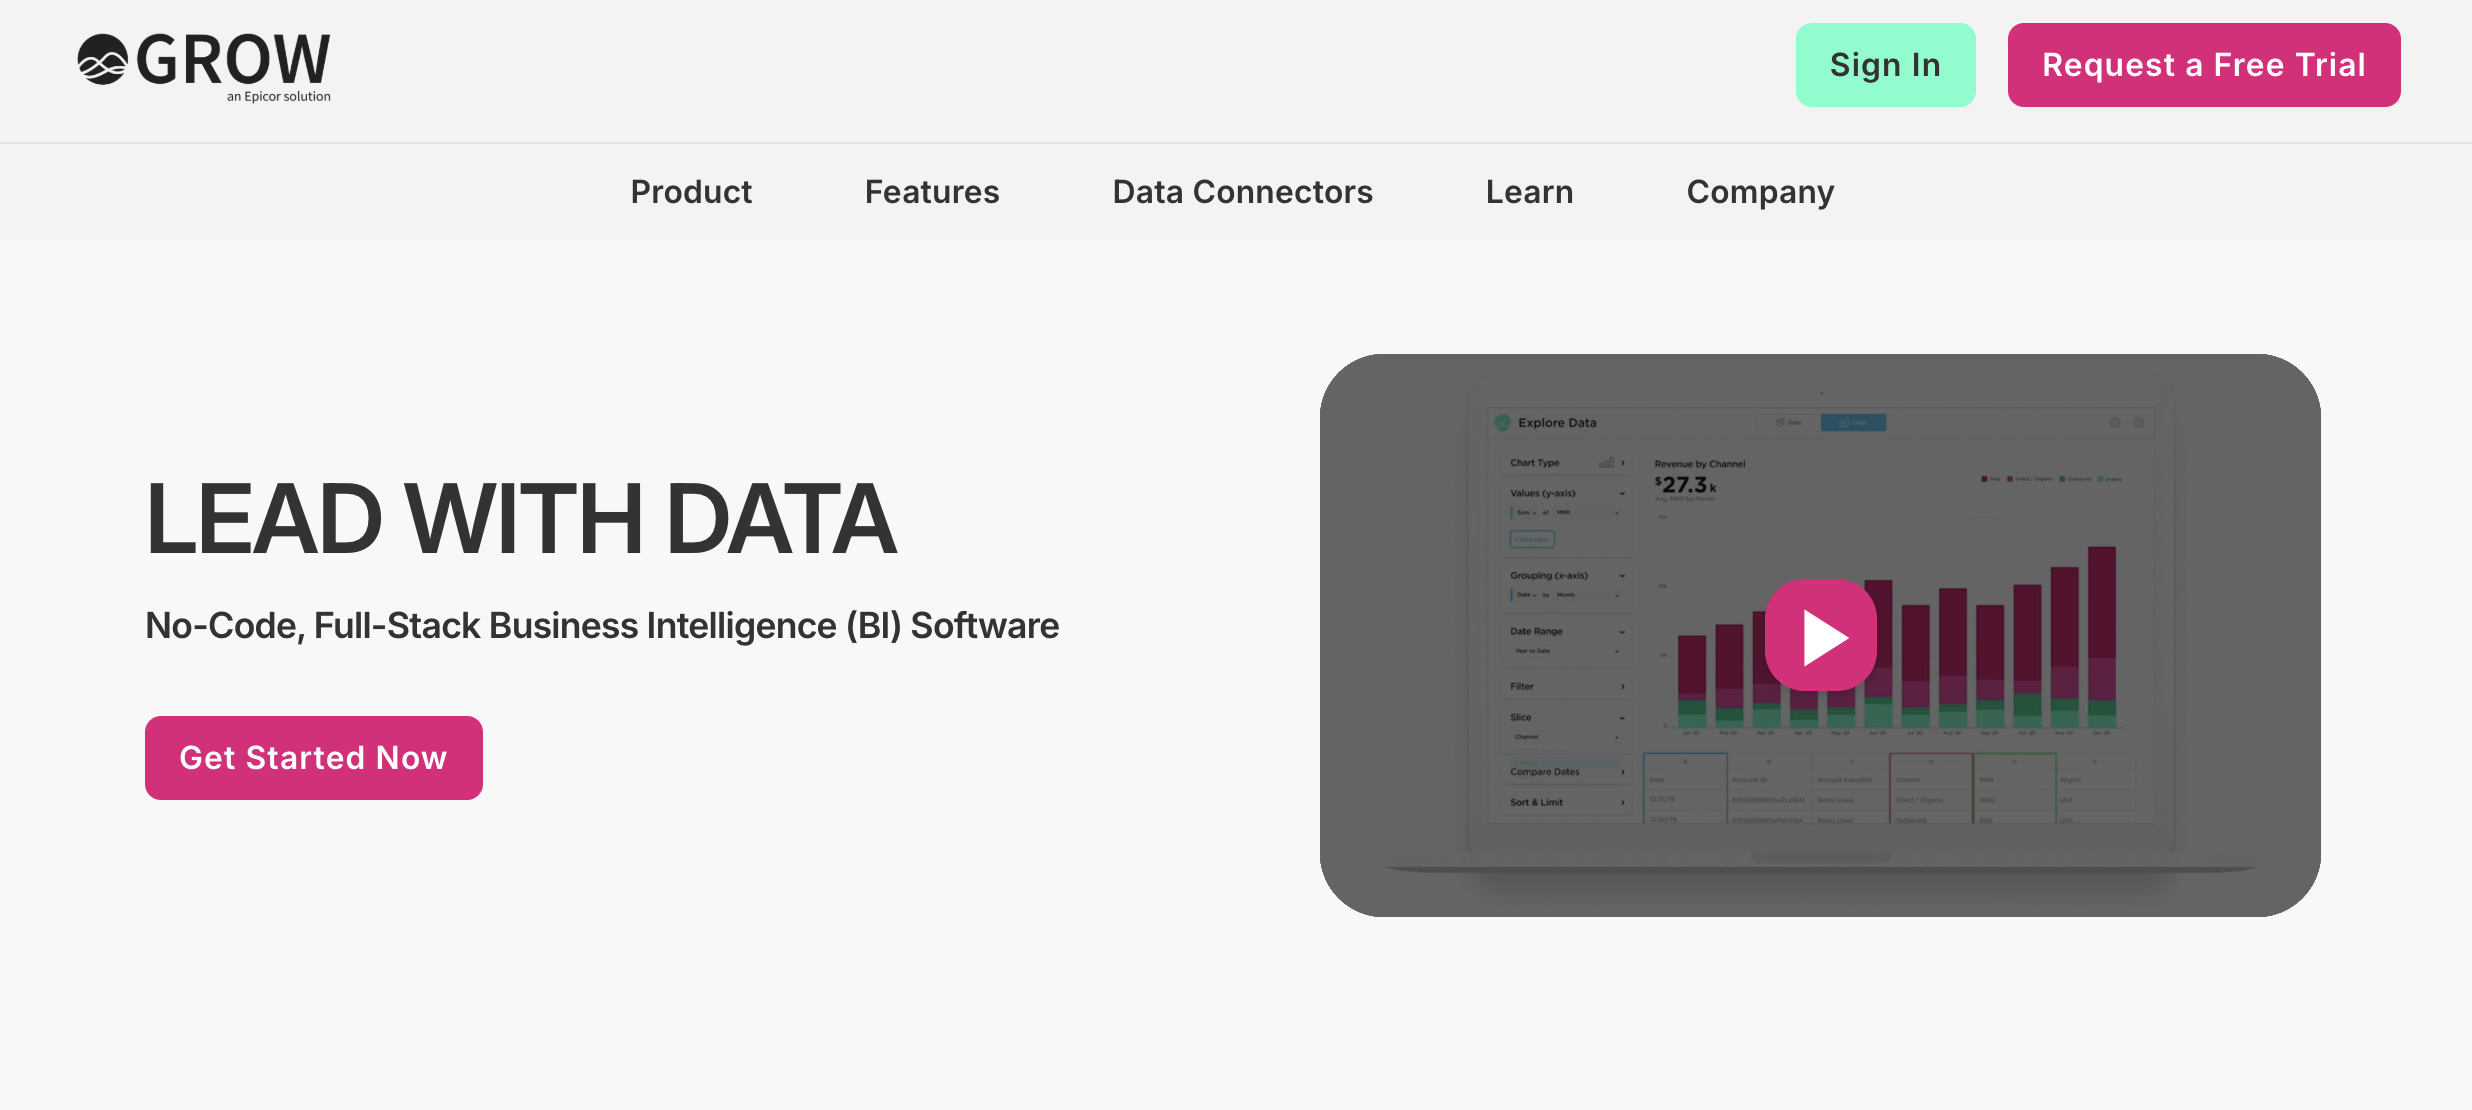
Grow is a no-code, full-stack business intelligence (BI) platform, owned by Epicor since 2022. Unlike simple reporting tools, Grow combines ETL (Extract, Transform, Load), data warehousing, and visualization into one unified environment.
You can now structure dashboards with flexible horizontal and vertical tabs, and set "Show/Hide" rules for specific panels based on the user viewing the report (e.g., a regional manager only sees their region’s data).
Grow's Data Explorer metric builder uses Smart Aggregations to group and aggregate transactional data automatically as you build a chart, which speeds up charting across its 150+ data connectors.
Grow's 2026 release notes don't include AI or natural-language features. Instead, they focus on connectors and security: updated APIs for Google Ads, LinkedIn Ads, Facebook and Instagram, deeper integrations with Epicor ERP systems like Kinetic, Eclipse and Prophet 21, and Secure Data Bridge (June 2026), an agent that sends approved SQL Server data to Grow without opening inbound firewall access.
Plus, Grow stores your data automatically on its platform so you don’t need to ship it to a third-party data warehouse.
You can create three types of dashboards on Grow:
- Dynamic dashboards which display data based on who is logged into the account.
- Dashboard Blueprints which are pre-built, single data source dashboards
- Custom & Sandbox dashboards which shows blended data sources and metrics
Grow dashboards also come with powerful filtering options based on date, number, or categorical logic.
You can then share them through emails, shareable URLs, Slack, TV-mode, or tables of raw and transformed data.
The key advantage of Grow over AgencyAnalytics is its reliability. Grow uses APIs to import data seamlessly from data sources, and it continually refreshes the data so your metrics are up-to-date and reliable.
However, Grow is more suitable for internal data storage and monitoring rather than for external reports. Their dashboards are very nitty-gritty which can overwhelm clients or the C-Suite.
Key Features
- 150+ native connectors including CRM platforms and Google Analytics
- Built-in data storage and warehousing
- No-code data transformation and pipelines
- Secure Data Bridge for on-premise SQL Server data (new 2026)
- Data Explorer with Smart Aggregations
- Customizable dashboards with show/hide rules by viewer role
- Real-time data updates
- Slack notifications, TV mode, and shareable URLs
- Snowflake and data warehouse connectivity
- Native connectors for Epicor ERP systems
Grow Reviews from Real Users
“Ease of use, Its like power of data which can be used at various levels of our organisation and has best value in analytics.” (Source)
“The platform is great overall, but connecting and syncing data sources can sometimes take longer than expected. Handling large datasets or complex dashboards may slightly affect performance.” (Source)
“Large dataset makes the software have performance challenges, leading to timeouts.” (Source)
Grow Pricing
Grow has been part of Epicor since a March 2022 acquisition and doesn't publish prices. Every plan is quoted through Epicor's sales team, and you can request a free trial from Grow's website.
Plan | Price | What's included |
| Grow (all plans) | Custom quote from Epicor sales | Unlimited users, 150+ data connectors, no-code ETL and data prep, built-in data warehousing, dashboards and alerts |
| Free trial | Free, on request | Requested through Grow's website; trial length isn't published |
9. NinjaCat
Best for: Large marketing agencies, media companies, and enterprise brands with dedicated data science teams that need agentic AI on top of a managed data platform.
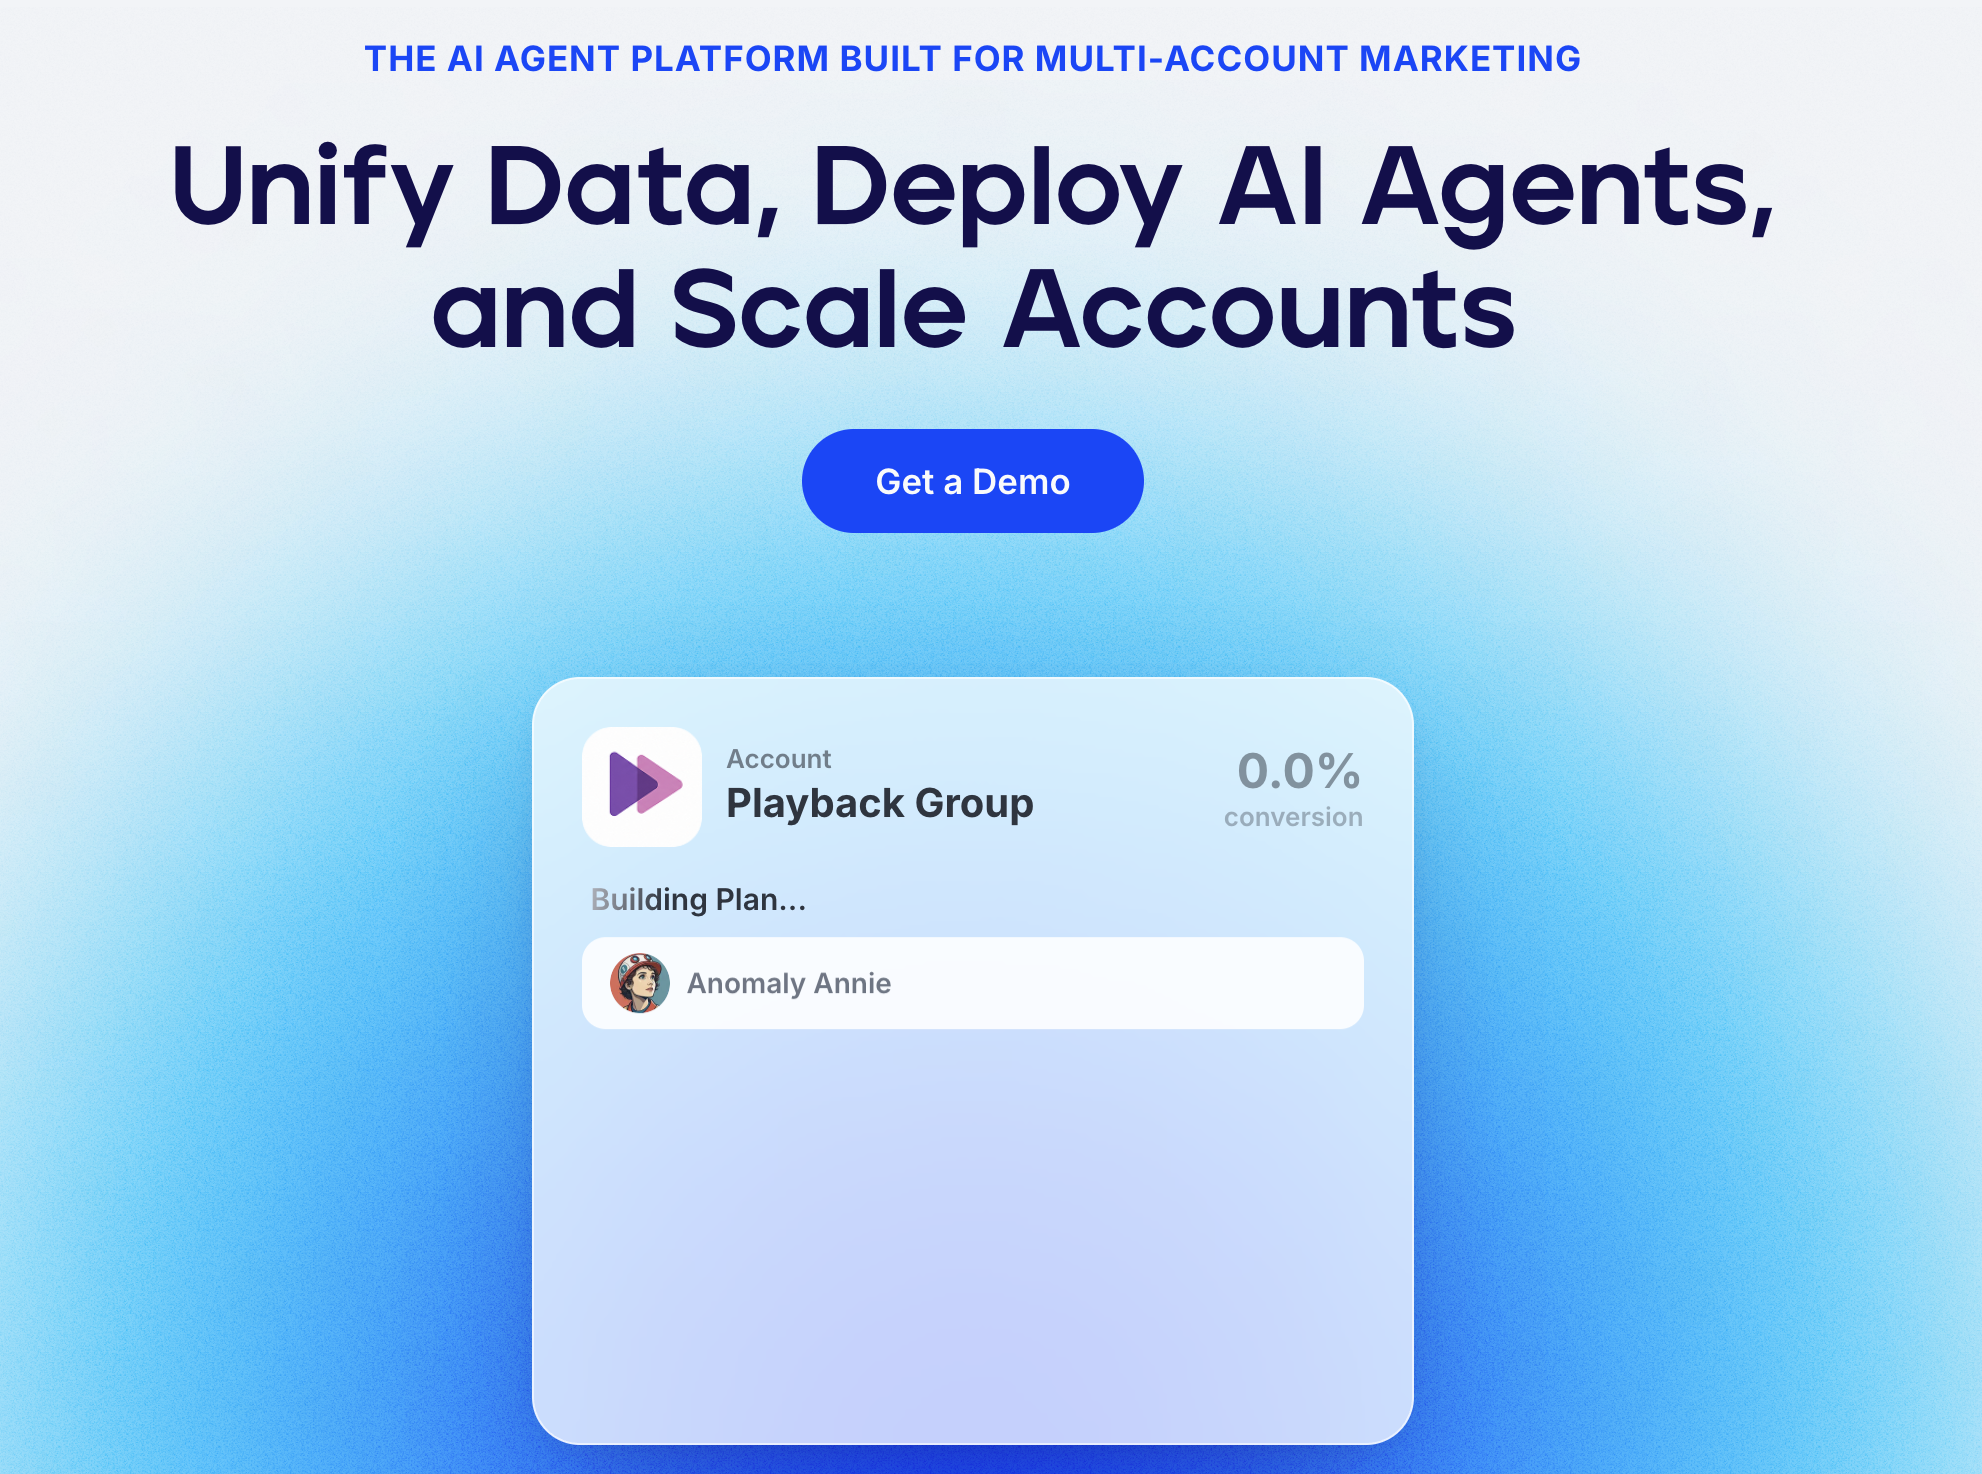
NinjaCat is now an AI agent platform for multi-account marketing teams, built on a managed marketing data cloud and sold as NinjaCat AgentOS, a significant 2026 shift away from positioning itself as a reporting tool.
The headline update is the expansion of its AI Agents library: autonomous agents that don't just surface insights but chain together to execute workflows. In NinjaCat AgentOS, every agent runs on governed data with client-specific memory, configurable permissions, human approval controls and AI usage limits, and agents can work inside Slack, Zoom calls and Google Drive.
A typical chain looks like this: an anomaly detection agent spots a 40% CPC spike overnight, sends a structured Slack alert to the paid media team with affected accounts and severity, a second agent diagnoses the root cause (a competitor entered your top PPC keywords), and a third generates three response options. Detection, alert, diagnose, recommend.
NinjaCat connects to 150+ pre-built connectors and stores your marketing data in a fully managed data warehouse. You can run no-code data transformations, create custom calculations, and export to Snowflake, BigQuery, Amazon S3, Tableau, or Looker Studio. NinjaCat Data Apps let anyone ask questions about their data in plain language, without writing SQL.
NinjaCat also handles SEO reporting, rank tracking, and backlink monitoring via its built-in SEO tools, making it one of the more complete platforms for agencies managing both PPC and organic search workflows.
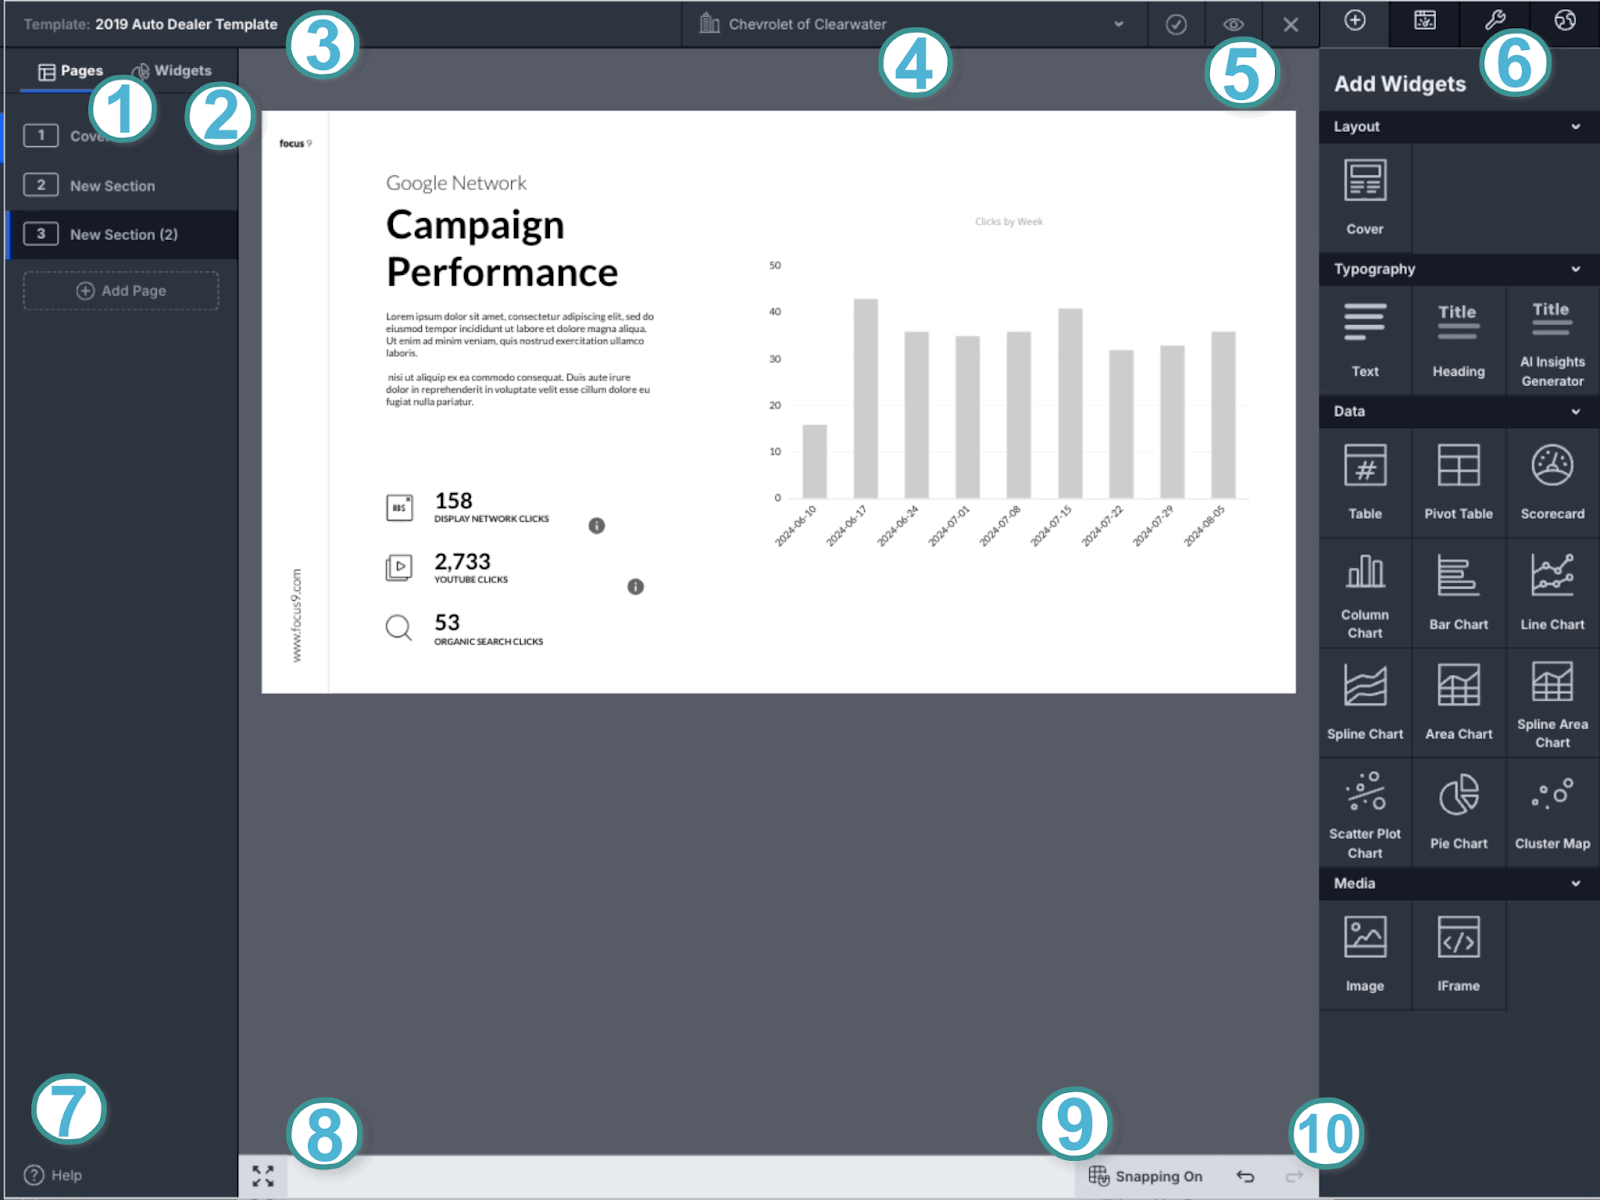
Graphic designers will be familiar with NinjaCat's layout, which looks a lot like Figma. However, if you’re a marketer without a design background, this can be quite confusing and overwhelming.
Key Features
- 150+ pre-built connectors
- Fully managed Data Cloud with built-in warehousing
- AI Agents for PPC hygiene, creative audits, anomaly detection, spend monitoring, and client communications
- ETL and semantic data modeling
- AgentOS with client-specific memory, permissions and human approvals
- AI agents in Slack, Zoom and Google Drive
- Data Apps for plain-language questions
- SEO tools with rank tracking and backlink monitoring
- White-label reporting
- Data export to Snowflake, BigQuery, and Amazon S3
- Report templates and interactive dashboards
NinjaCat Reviews from Real Users
“Sometimes Ninjacat can be a bit overwhelming with all of the features and solutions it has, but that is not really a bad thing.” (Source)
“The technology is sophisticated and can do a lot. Because of that, things can break down from time to time.” (Source)
“Making it easier to connect with various apps and configure the AI agent would help increase adoption.” (Source)
NinjaCat pricing 2026
NinjaCat doesn't publish prices or offer a self-serve plan. Every contract is custom, and access starts with a demo request. But our NinjaCat pricing guide breaks down what’s publicly available on the internet.
Plan | Price | How it's priced |
| NinjaCat (all plans) | Custom contract, from about $1,500/mo | Typically based on the number of data sources, reporting volume and AI agent usage |
| Free trial | Available on request | No self-serve sign-up; starts with a demo |
10. Cyfe
Best for: Boutique agencies and small business owners who need an affordable monitoring hub for office TVs.
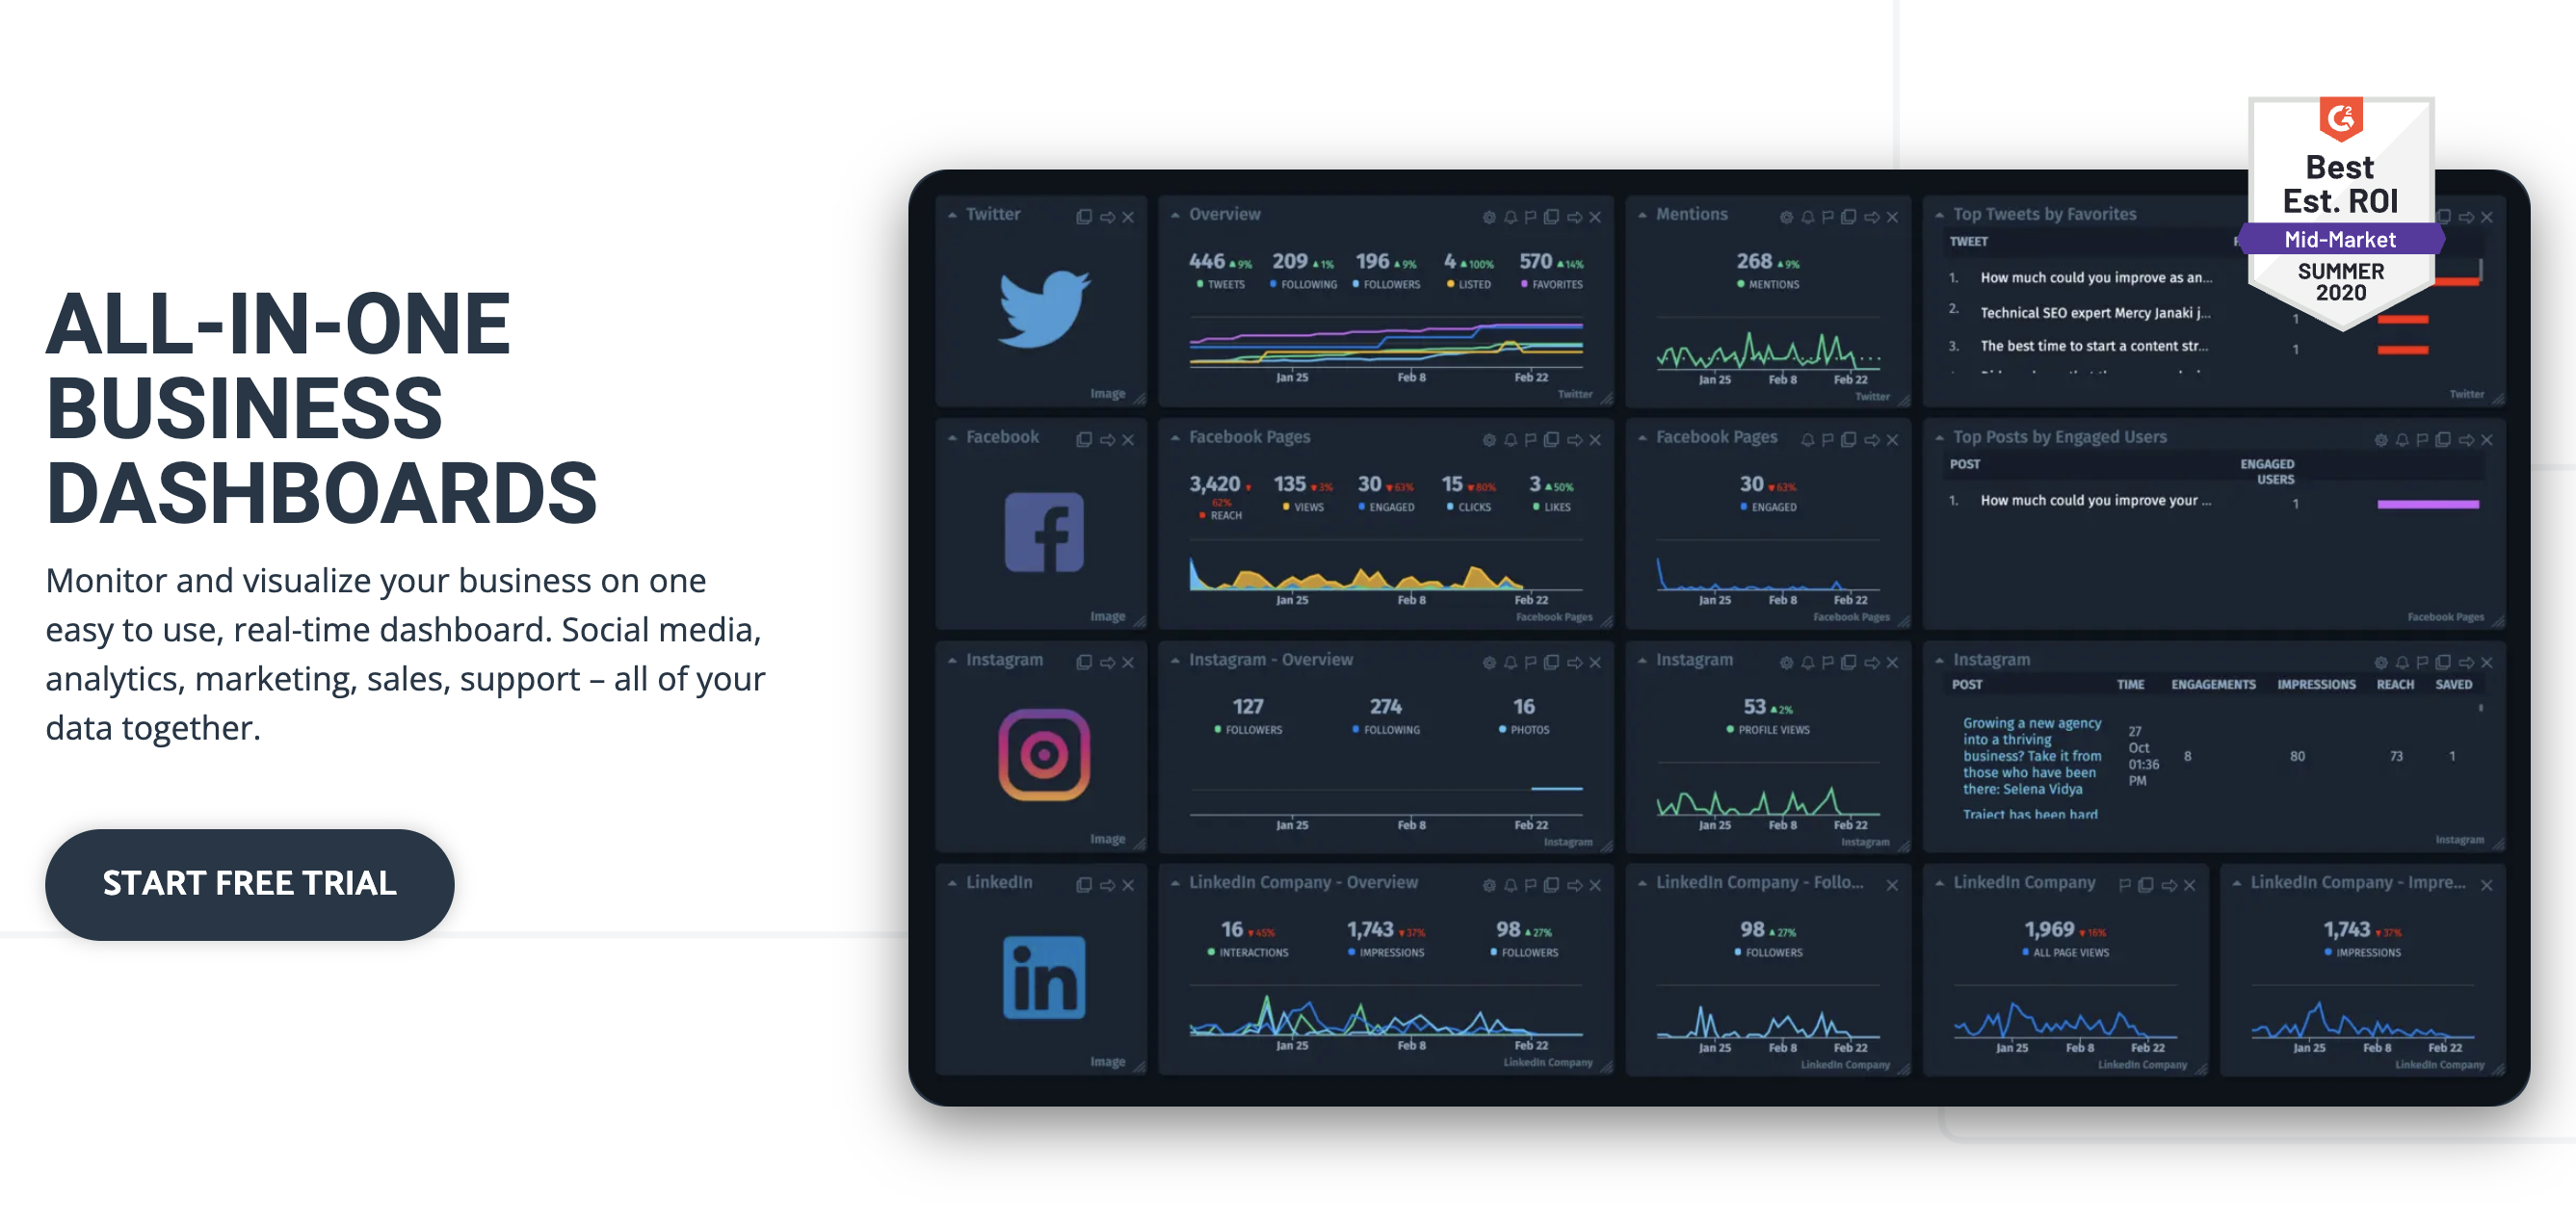
Cyfe is a business dashboard app and reporting platform that brings data from 100+ integrations into one place for monitoring.
Cyfe hasn't announced major product updates in 2026. Its TV Mode, included on every plan, enlarges dashboards to fill office monitors of any size. Cyfe is part of Traject, and its website footer now lists ScraperAPI, which announced in April 2026 that it had acquired Traject Data.
You can pull data from 100+ integrations including social media, email, SEO, and sales and finance tools. You can also bring in custom data via .CSV, Google Sheets, SQL, private URL, or push API.
To build visualizations, you can start from their dashboard templates or pre-built widgets. Cyfe also comes with “Embedded Analytics” where you can take an entire dashboard or a widget and embed it to emails, webpages, or applications.
For SEO managers, Cyfe offers a SERPs widget which lets you monitor a domain's keyword rankings daily, plus a Moz widget for backlink counts and domain authority. This is similar to AgencyAnalytics’ Rank Tracker tool.
However, Cyfe does not come with any advanced data calculations or organization features, nor can you transfer data to warehouses or other destinations.
Key features:
- 100+ integrations including social media, SEO tools, Google Analytics, Google Ads, and CRM platforms
- Custom and pre-built widgets
- TV Mode for full-screen office displays
- Keyword rank tracking and Moz backlink metrics
- Embedded analytics (all plans)
- White-label reporting (Agency plan)
- Custom domain
- Custom data import via CSV, Google Sheets, SQL, private URL, and push API
Cyfe Reviews from Real Users
“Nice look and feel…Very basic data sources work okay.” (Source)
“no Customer Service- Email in and pray for answer (prayers left unanswered).” (Source)
“Support really sucks. This never used to be the case BTW.” (Source)
Cyfe pricing 2026
Billed monthly, with a 14-day free trial. Every plan includes all features: unlimited history, TV Mode, public URLs, custom logo, custom themes, custom SSL domain, unlimited data exports and embedded analytics.
Plan | Price | Dashboards | Users | Extras |
| Starter | $29/mo | 2 | 1 | All features |
| Standard | $39/mo | 5 | 2 | All features |
| Pro | $65/mo | 10 | 5 | All features |
| Premier | $119/mo | 20 | Unlimited | +$5 per extra dashboard |
| Agency | From $190/mo | 100 | 15 | 10 clients included, +$19 per extra client; 100% white label, branded widgets, custom CSS, client management, sub-user invites, white-label reports |
11. TapClicks
Best for: Medium to large agencies, media companies, and brands with dedicated data teams who need an all-in-one marketing operations platform beyond just reporting.
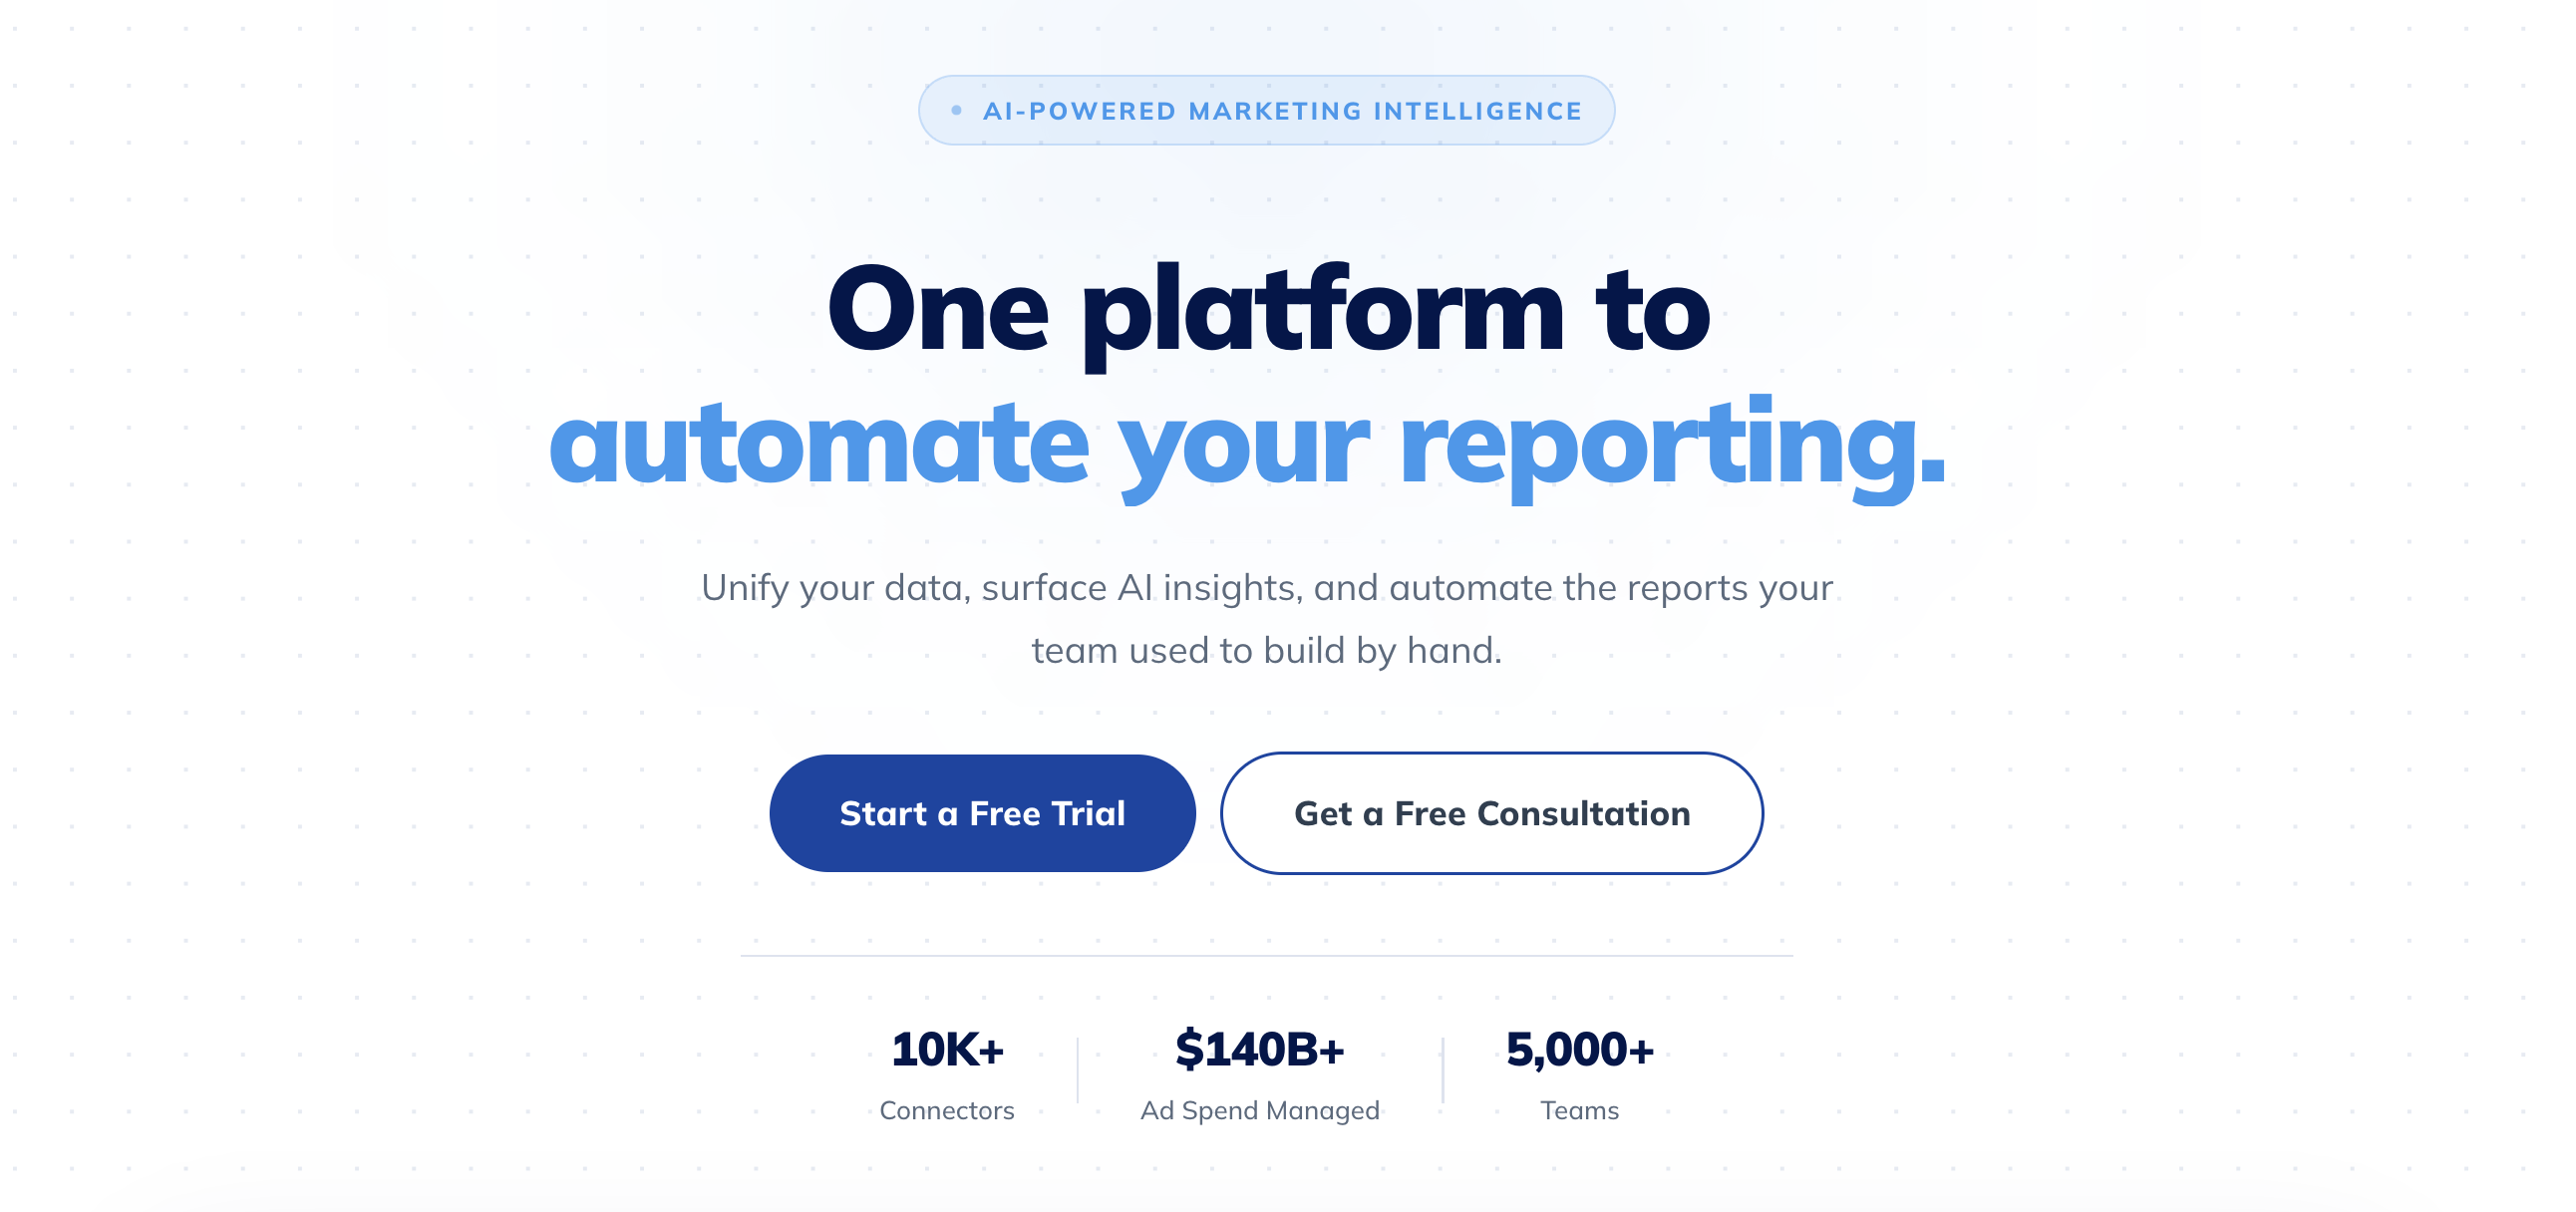
TapClicks is a marketing operations platform that now describes itself as an AI-powered marketing intelligence platform.
Think of it less as a reporting tool and more as an enterprise marketing operations system: data management, dashboards, analytics, AI agents, and campaign order and workflow management unified under one platform.
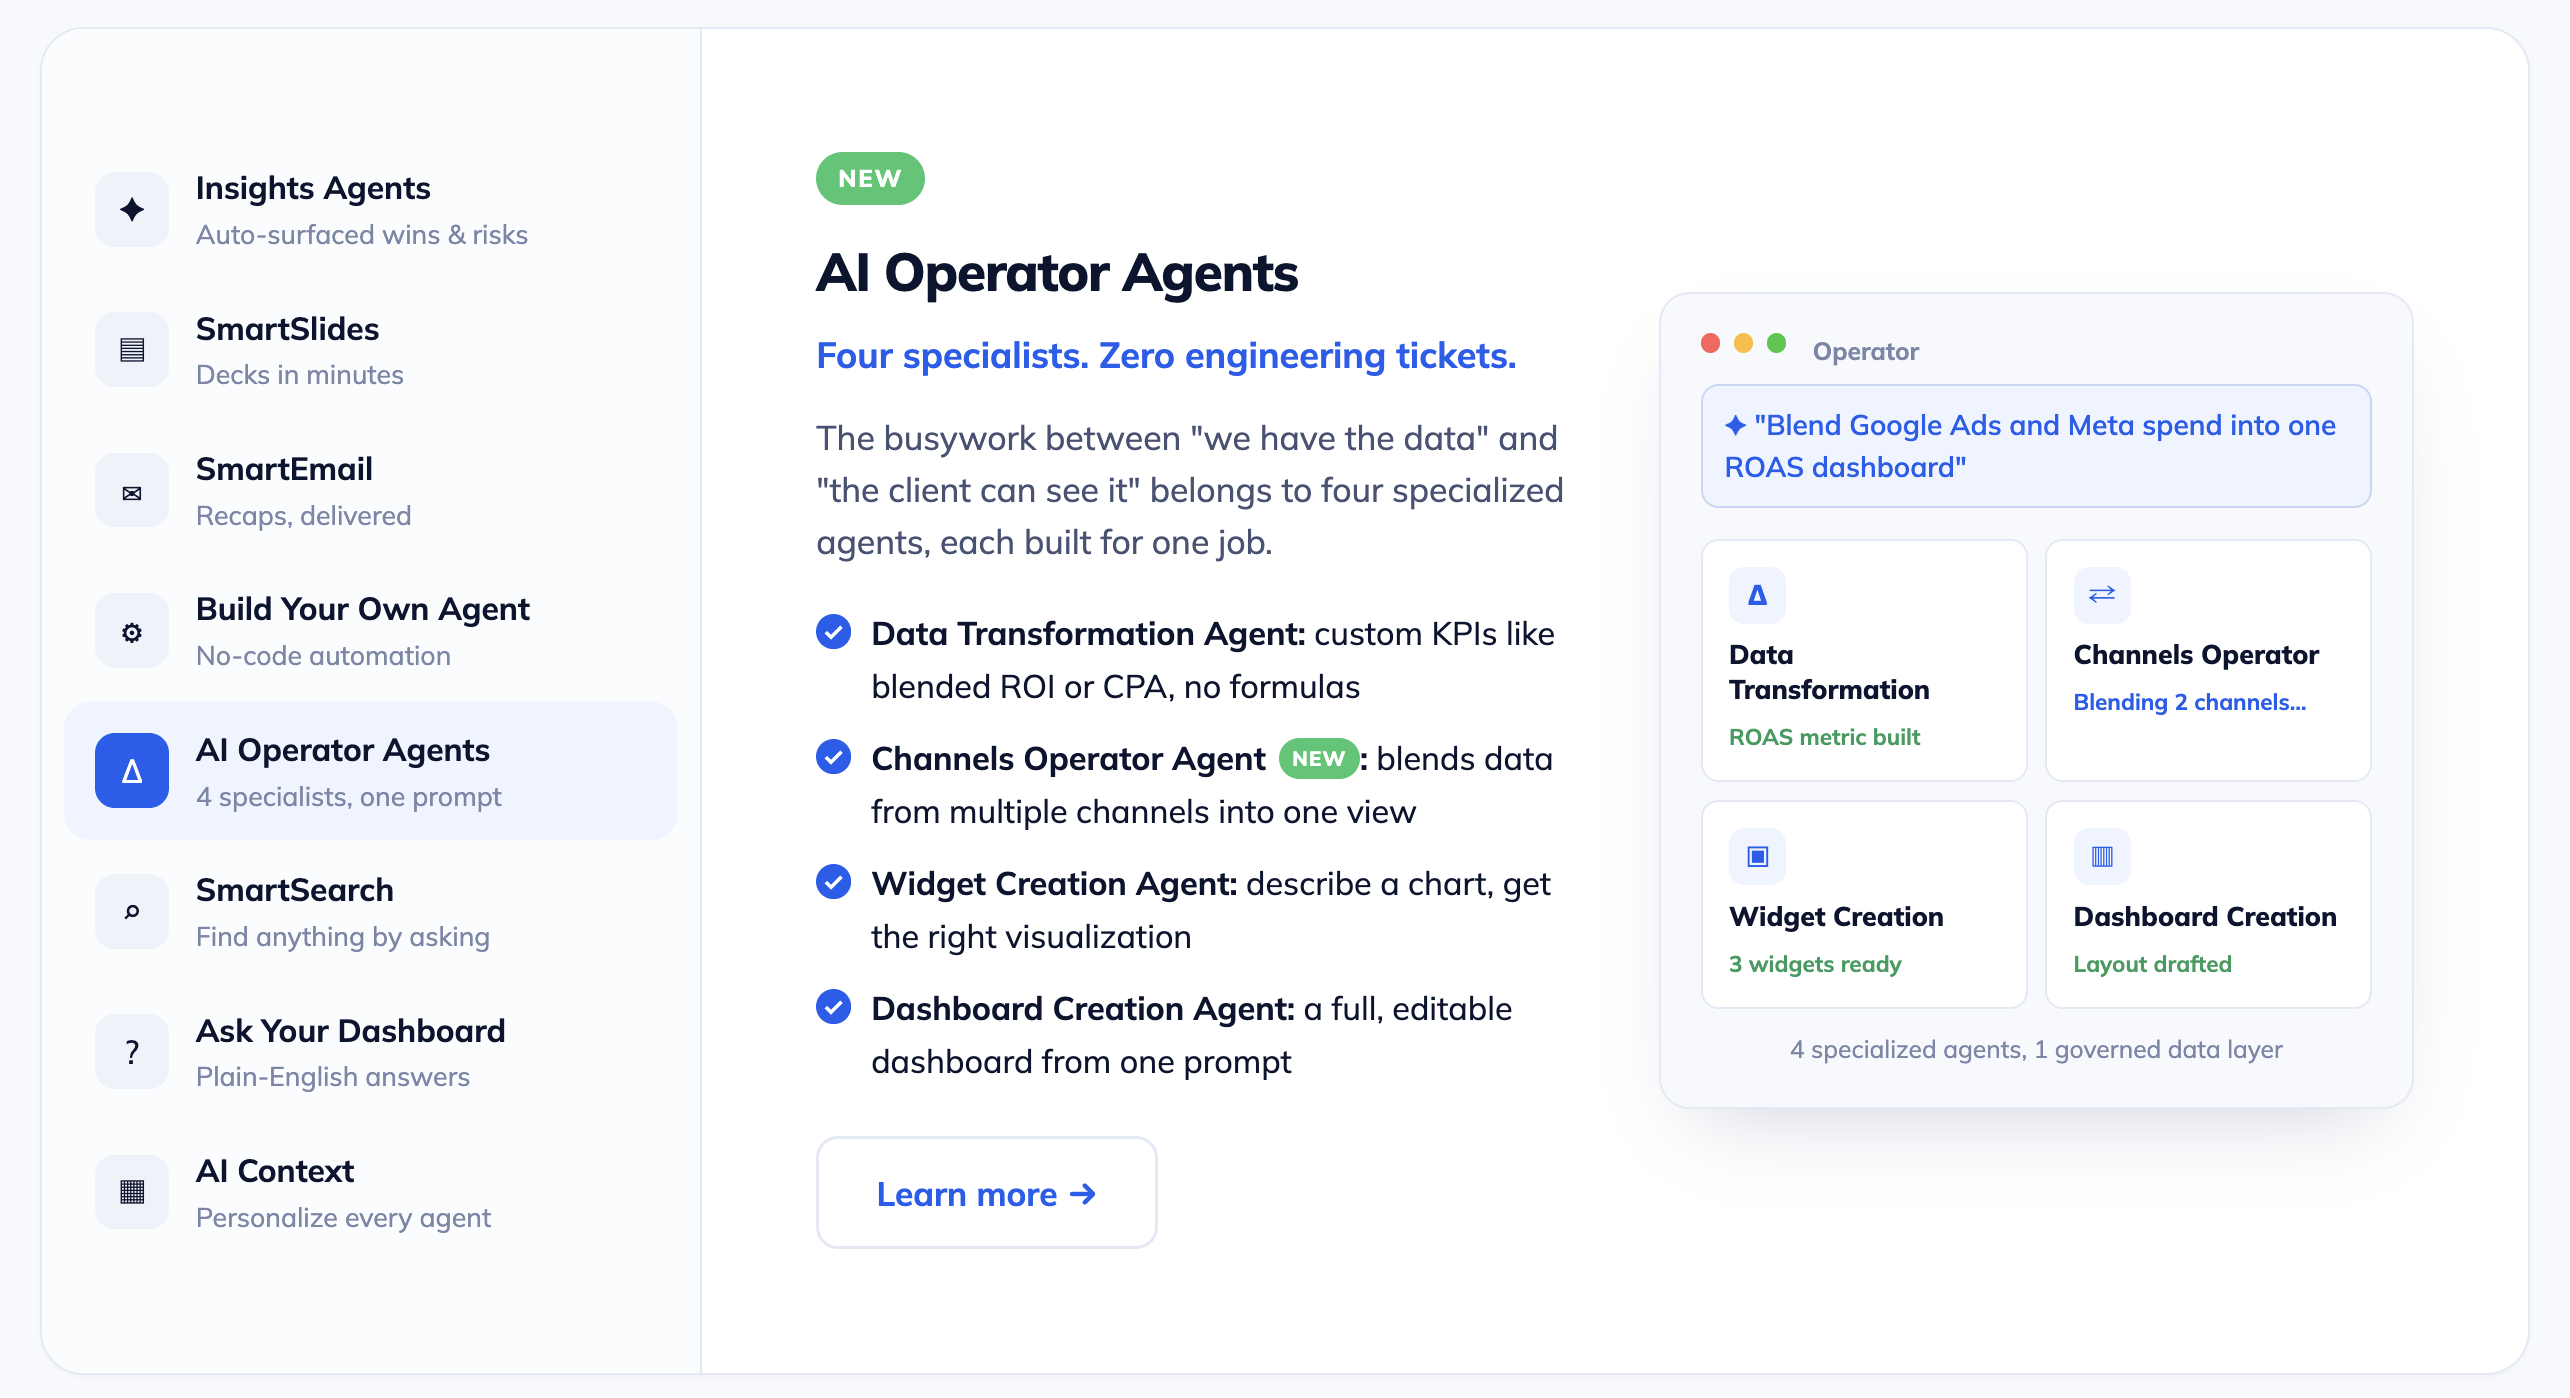
In April 2026, TapClicks announced a major AI platform expansion:
- AI-powered widget creation that builds dashboard widgets from natural language prompts
- AI Insights Agents that analyze campaign performance, identify trends, and feed their findings into SmartSlides presentations
- Ask Your Dashboard, a chat that answers questions using your dashboard data as context
SmartReports, launched in late 2025, now generates branded PowerPoint decks (SmartSlides) and AI-authored email summaries (SmartEmail) automatically on schedule. These replace the most manual parts of the client reporting workflow for digital marketing teams.
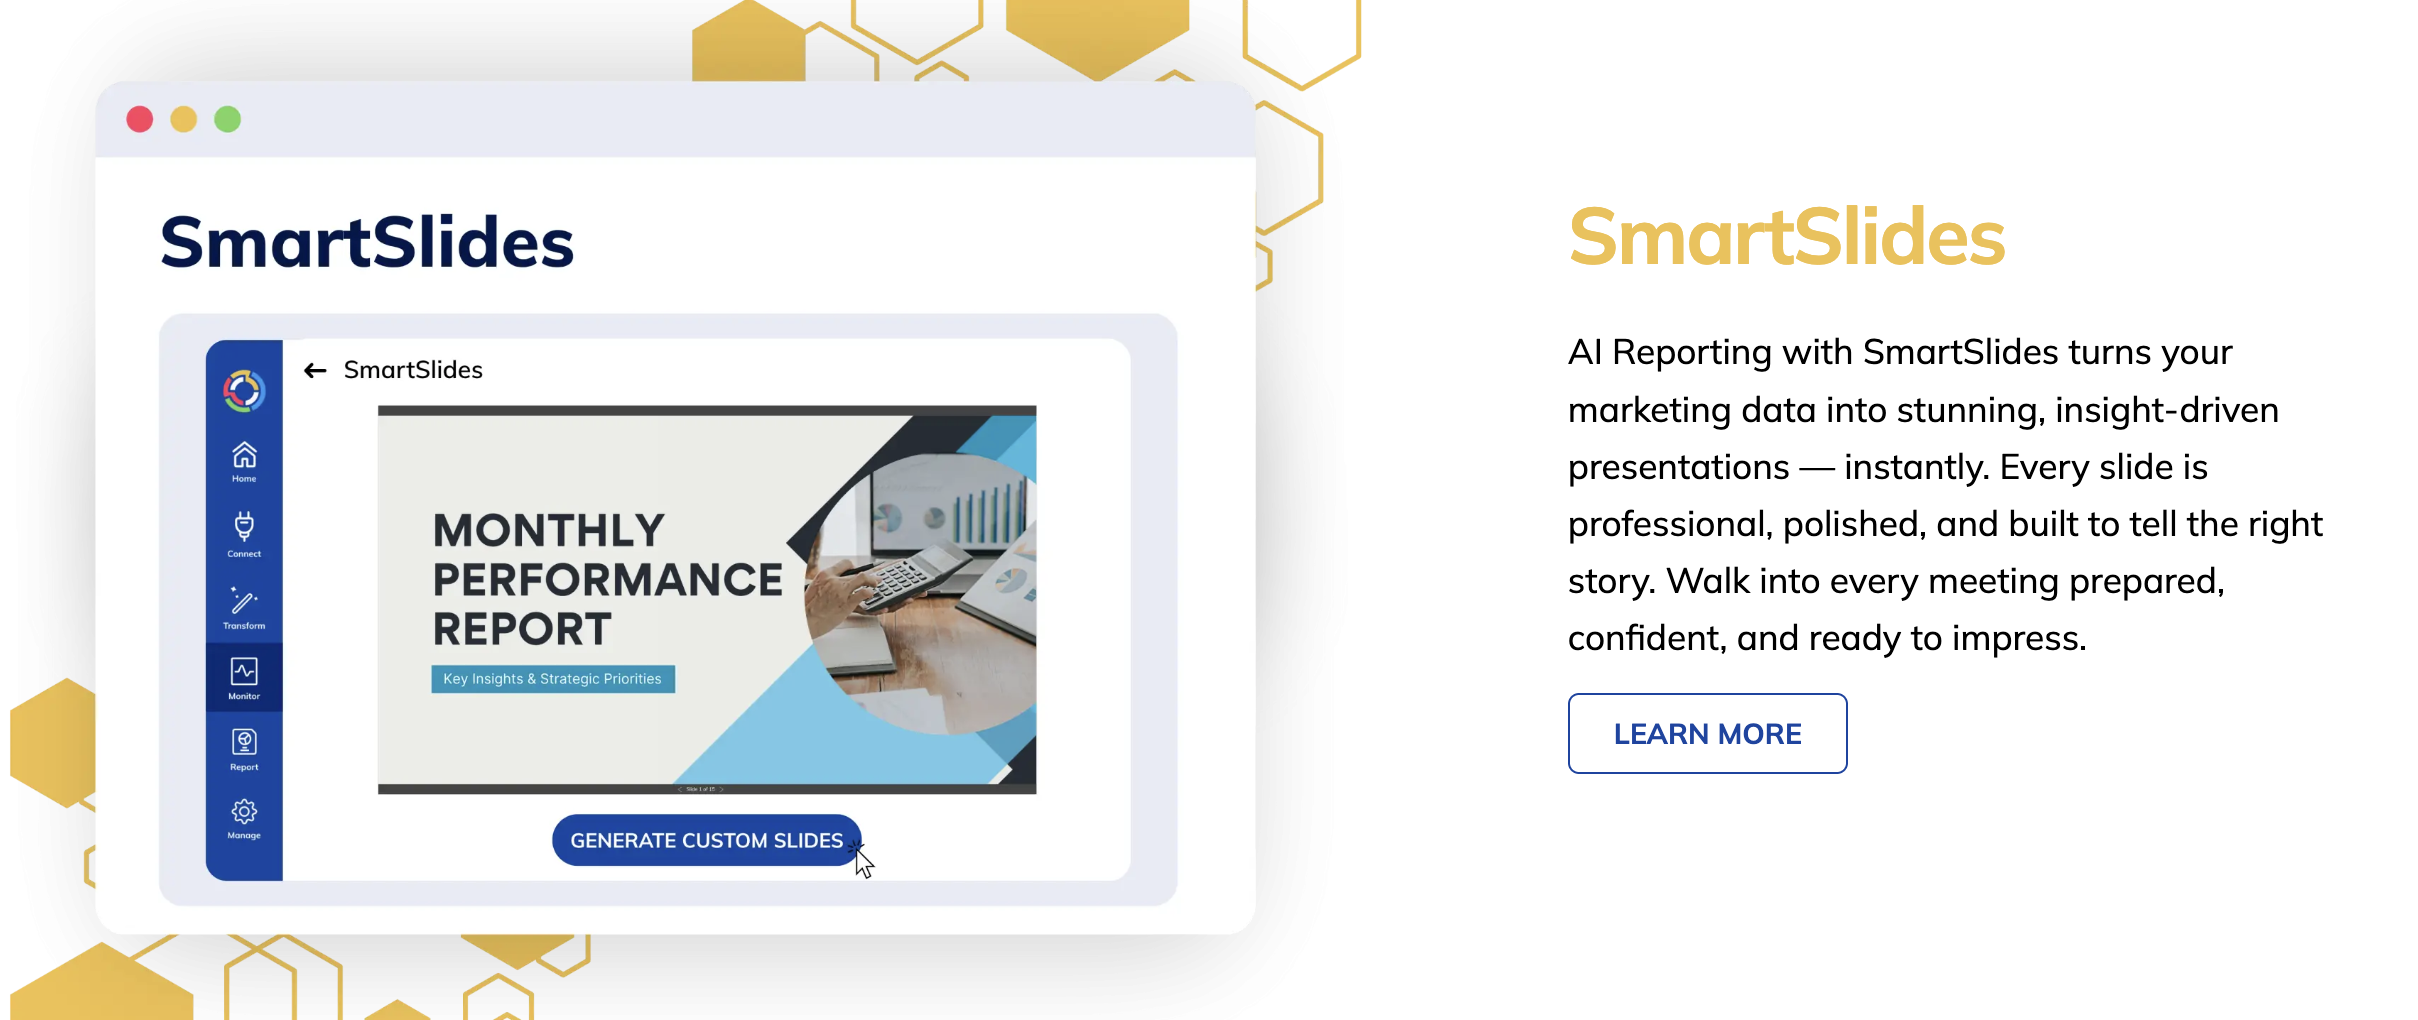
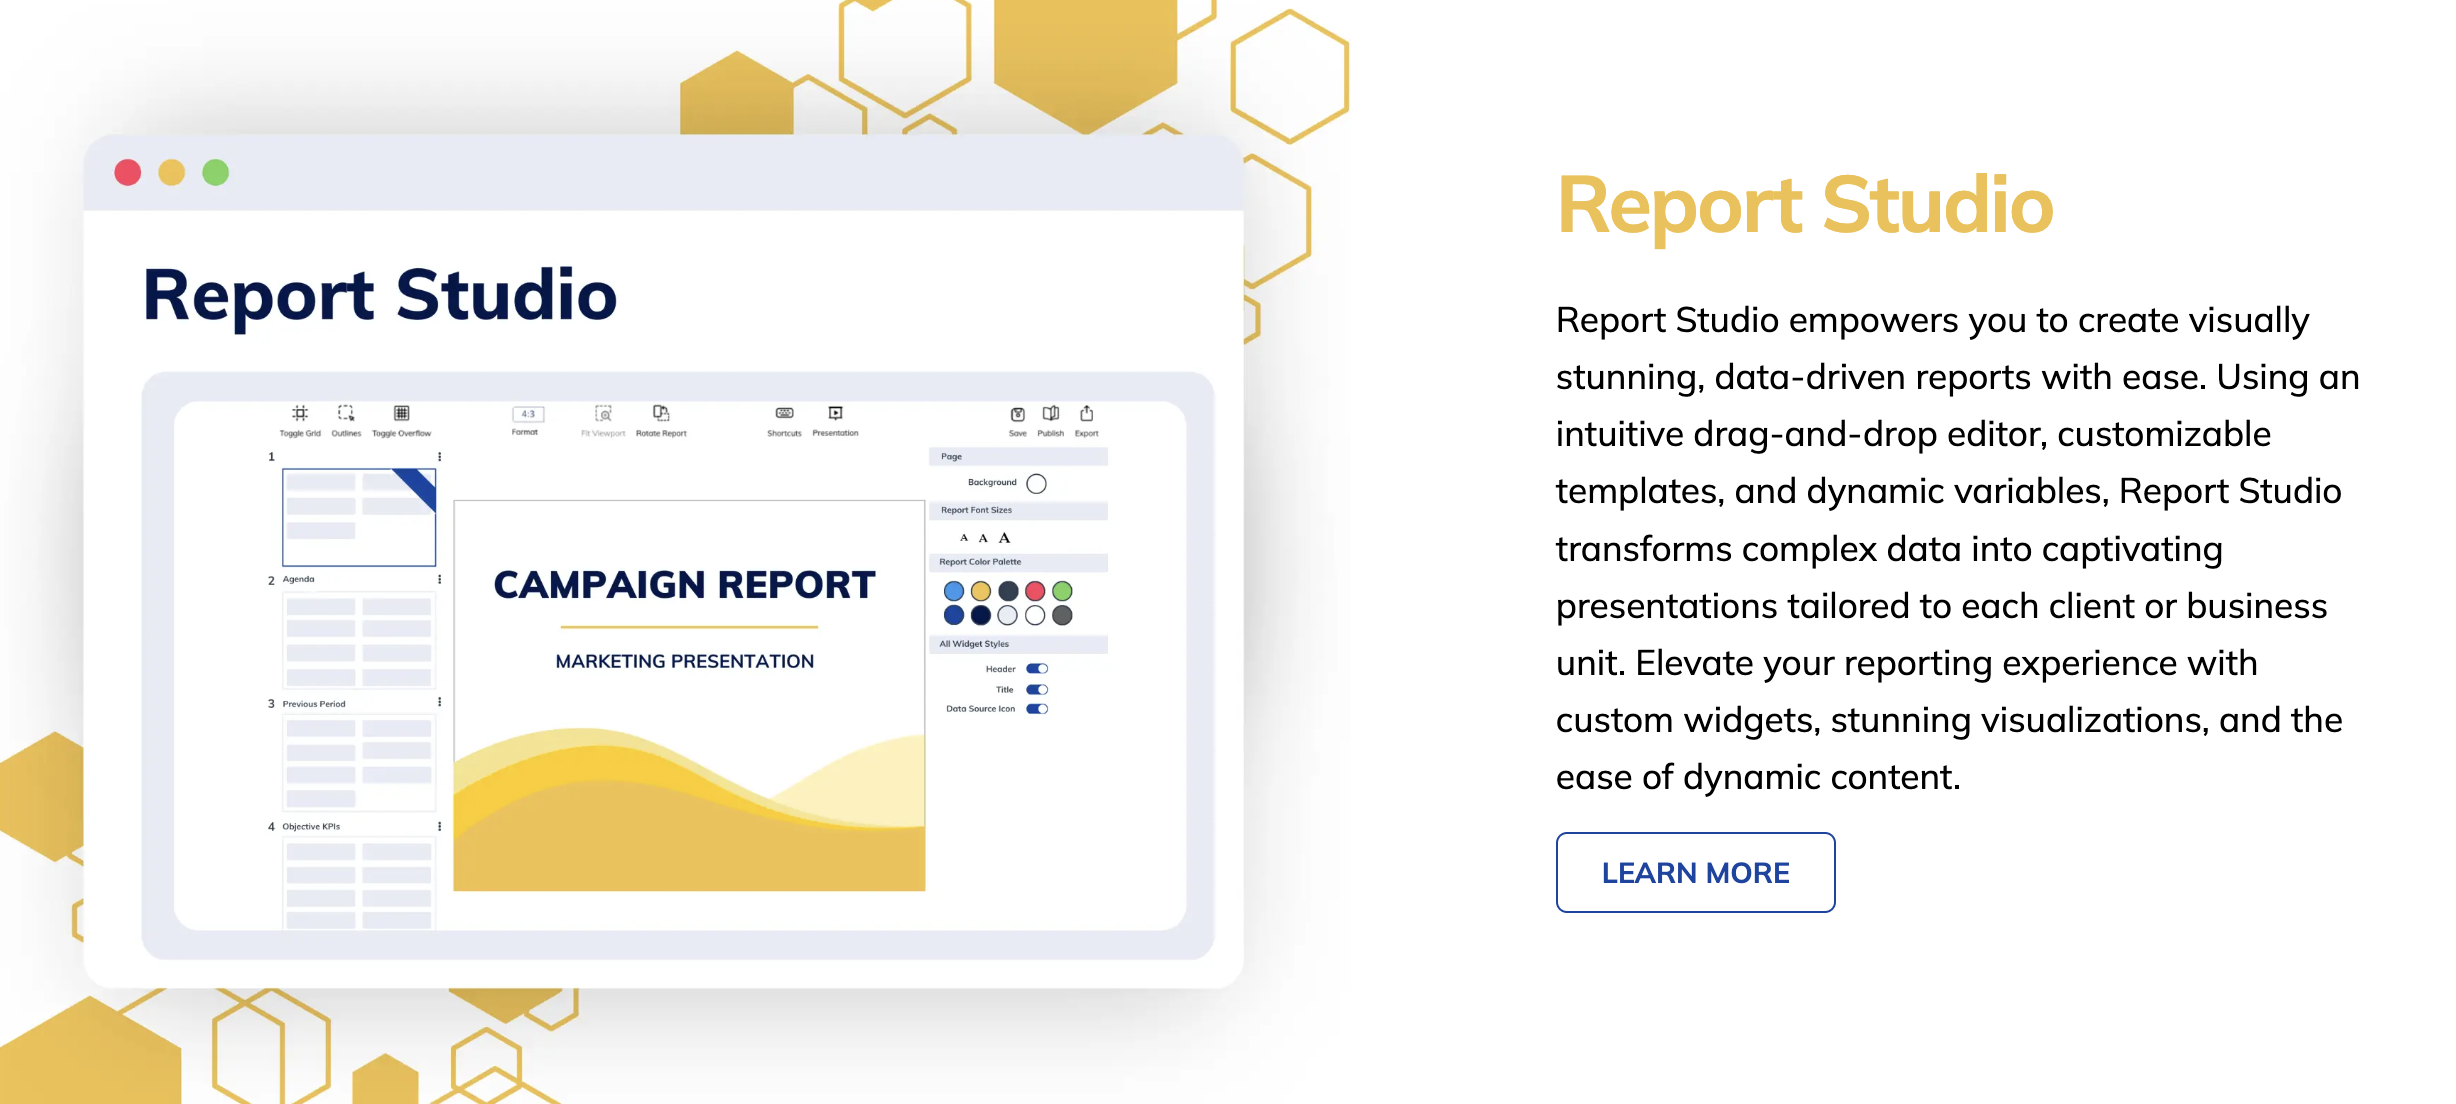
The June 2026 release added AI Dashboard Creation, slide-by-slide SmartSlides generation, smart layout suggestions for Report Studio, and pivot table widgets. SmartReports and higher plans also include MCP access, so you can connect TapClicks data to Claude, Gemini or ChatGPT, with usage limits.
In February 2026, TapClicks also launched SmartStory, an entry plan from $199 per month that turns data from 30+ core connectors into AI-generated PowerPoint and PDF presentations for small agencies and growing teams.
TapClicks connects to 250+ data sources, stores marketing data in a managed data warehouse, exports to Snowflake, BigQuery, Amazon S3 and other destinations through its Data Exporter, and offers TapOrders and TapWorkflow to carry campaigns from order entry to launch.
For large agencies running complex multi-channel operations, TapClicks' comprehensiveness has genuine value.
The persistent pain points remain. User reviews note that TapClicks connections break regularly, data inaccuracies surface in reports, and TapClicks is difficult to use even with extended CSM support and onboarding.
TapClicks' pricing is mostly quote-based: only SmartStory has a published starting price, and each plan's startup bundle includes 10 clients.
Key Features
- 250+ integrations
- TapData ETL and managed data warehouse
- SmartReports: AI-generated PowerPoint decks (SmartSlides) and email summaries (SmartEmail)
- AI Insights Agents and Build-Your-Own Agent
- SmartAnalytics dashboards with pivot tables and Ask Your Dashboard chat
- Goals and pacing with predictive analytics, plus AI benchmarking widgets
- MCP access for Claude, Gemini and ChatGPT
- SmartStory AI presentations (from $199/month)
- TapOrders and TapWorkflow for campaign order and workflow management
- Data export to Snowflake, BigQuery, and Amazon S3
- White-label reporting and automated reporting workflows
TapClicks Reviews from Real Users
“This is a very useful and good product. It's also so easy to use.” (Source)
“I dislike TapClicks because the initial setup can be a bit overwhelming, and sometimes the data syncing isn't as smooth as I'd like.” (Source)
“Some of the visualization options are limited.” (Source)
TapClicks pricing
TapClicks sells four plans. Only SmartStory has a published starting price; the others are quote-based and start with a demo. Every plan includes a startup bundle of 10 clients, and the 14-day free trial needs no credit card.
Plan | Price | What it adds |
| SmartStory | From $199/mo | SmartSlides PowerPoint reports with AI insights, TapData Lite connectors, automated data warehousing, basic branding |
| SmartReports | Custom quote | Everything in SmartStory plus the full 250+ connector package, Report Studio, scheduled reports, SmartEmail, MCP access, AI Insights Agents for Report Studio, mobile apps |
| SmartAnalytics | Custom quote | Everything in SmartReports plus unlimited dashboards, users and accounts, custom data blends and calculations, AI widget and dashboard creation agents, Ask Your Dashboard, goals and pacing, event alerts |
| SmartSuite | Custom quote | Everything in SmartAnalytics plus Build Your Own AI agents, AI benchmarking widgets, leads and attribution manager, setup services |
Summary: which AgencyAnalytics alternatives is right for you?
The right AgencyAnalytics alternatives depend on what kind of company you are and what you need in a reporting tool:
- If you're a mid-size agency or multi-location operator managing dozens of clients across multi-channel campaigns, and you want one governed data foundation and agents to automate recurring tasks, choose Whatagraph.
- If you're a small agency or freelancer on a budget, choose DashThis for template-based client reports, or Data Studio (formerly Looker Studio) if most of your data lives in Google.
- If you want KPI dashboards for internal teams, choose Geckoboard or Cyfe for office TVs, or Databox for a conversational AI analyst.
- If you have an in-house data or BI team that needs formula-level control, choose Klipfolio, Tableau or Grow.
- If you're a large agency or media company with a dedicated data team, choose NinjaCat for governed AI agents or TapClicks for reporting plus campaign workflow management.