Discover a Powerful Klipfolio Alternative
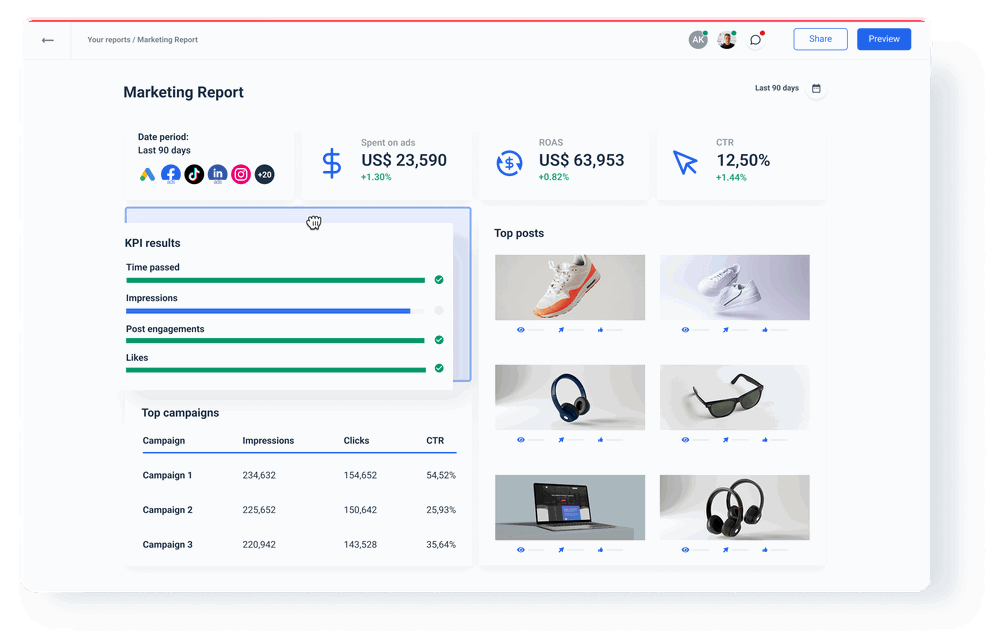
Whatagraph is a fast and easy-to-use platform for monitoring and reporting on marketing performance with excellent support and automation features. As a Klipfolio alternative, Whatagraph allows you to create, edit, and share multi-channel dashboards and reports, display ad creatives, and save hours on marketing data tasks.
- Unlimited dashboards
- Live chat support
- No tech background needed


3 Reasons to Choose Whatagraph as Your Klipfolio Alternative
No technical or data knowledge needed
Klipfolio’s learning curve is still steep for some users despite all available training resources and support documentation. On the other hand, connecting, organizing, visualizing, and sharing data in Whatagraph is fast and easy and doesn’t require additional data modeling skills or specific tech knowledge.
Visualizations are easier to build and adapt
Klipfolio has a time-consuming process of creating each individual Klip and adding them to the dashboard. There’s a separate manage & edit environment for dashboards and Klips. Whatagraph, however, provides one intuitive environment to build and share reports and dashboards using ready-made widgets.
Overall faster platform with multiple time-saving features
No matter how many tabs, pages, or widgets you have, Whatagraph will handle it without downtime or slowing down. You can save and reuse almost anything as a template from a whole report down to a single calculation. Link multiple dashboards or reports to one template and edit them all at once.
A One-stop Shop Alternative to Klipfolio
A single platform for all your marketing reporting and data needs. Clear pricing plans with no hidden limits. User-friendly and easy to navigate, no technical background needed. Built with marketing agencies and professionals in mind.
 | ||
|---|---|---|
| Connect | ||
| Native integrations | ||
| Unlimited historical data | ||
| Consistent refresh rate | ||
| Organize | ||
| Granular data analysis | ||
| Unify and rename dimensions and metrics across all dashboards | ||
| Group and aggregate data | ||
| Blend data from multiple channels to use as a new blended source | ||
| Visualize | ||
| Visual customization | ||
| Unlimited reports | ||
| Intuitiveness and ease-of-use | ||
| One work environment | ||
| Media widgets | ||
| Report and dashboard templates | ||
| Bulk dashboard edit | ||
| Executive cross-channel overviews | ||
| Share | ||
| Automated reporting | ||
| Data export | ||
| Data transfers to a warehouse | ||
| General points | ||
| Live chat support | ||
| Speed and stability | ||
Klipfolio Pros and Cons – What Do Users Say?
The reach and freedom that Klipfolio gives to implement what ever you need & want. They also have a partner program and certifications. The support services is very good and documentation are well explain. Easy Multi-API Conexion.
It's rather complex to create custom reports, I did two training sessions and still had to contact support regularly to assist with setting up custom reports.
Biggest pro is the number of connectors. Klipfolio connects basically to every tool we use. Almost equally important is the flexible access to data. This means Klipfolio isn't so dependent on the formatting of the raw data.
There is a learning curve. Getting started is really easy, but if you need more complex stuff, it takes some learning-by-doing to get the hang of it. It's like Microsoft Excel, if you need more, you need to practice.
If you need to calculate something or making a complex formula to get to the right information to display can be very difficult, It is not so clear how each formula works, the articles don't explain everything you need.
Frequently Asked Questions
What are the best Klipfolio alternatives?
Some of the best Klipfolio alternatives include:
- Whatagraph
- Geckoboard
- NinjaCat
- Databox
- Improvado
You can read detailed reviews, features, and pricing of each tool in this Klipfolio alternative article.
Is Whatagraph a good alternative to Klipfolio?
Yes, Whatagraph is a powerful Klipfolio alternative. For starters, With Whatagraph, you can create an unlimited number of reports and dashboards in any pricing plan, while in Klipfolio, you are limited to 15, 30, or 60 dashboards.
Also, creating custom visualizations or reports is much quicker in Whatagraph, especially for non-technical users. Everything from connecting data to sharing insights takes place in one intuitive environment in Whatagraph, while in Klipfolio, you have to switch between your dashboard, Klips, and data sources space.
Finally, Whatagraph lets you schedule a no-code data transfer to your BigQuery data warehouse.
Are Klipfolio reviews mostly positive or negative?
Klipfolio reviews are mainly positive, with users praising the clean dashboard view and abundant data sources and feeds. However, those who moved to Whatagraph or other competitors to Klipfolio point out the lack of dashboard customization options, steep learning curve, and longer time needed to create a desired visualization
How does Klipfolio pricing work?
Klipfolio pricing is based on the number of dashboards you can create. Three pricing plans are available for 15, 30, and 60 dashboards.
Another pricing differentiator is the data refresh rate, which goes from 1 hr to up to 1 minute for the Team+ plan.
You can upgrade any plan with more dashboards, alongside other perks for an additional fee, such as priority support, large data sets, and faster refresh rates.
As a worthy competitor to Klipfolio, Whatagraph lets you create as many dashboards and reports as you want, regardless of the pricing plan you choose.
What if my data source is not among the integrations?
If your data source is not among the supported integrations, you have three options.
1. Use our custom API to connect the source directly,
2. Export your data to Google Sheets,
3. Export your data to Google BigQuery and connect it as a source.
Can you export data from Whatagraph?
Yes, you can export data from Whatagraph. You can move your data to a BigQuery data warehouse. In case you want to continue data analysis in another business intelligence tool such as Tableau or Power BI, you can export Whatagraph data as Excel or CSV files.
How much training do I need to use Whatagraph?
You don’t need a lot of training to use Whatagraph at all. Whatagraph has a very mild learning curve, so that after going through our demo, you should be able to connect sources, create interactive dashboards, and share them effortlessly with your clients. Of course, if you get stuck, you can reach our customer support via live chat.


