LinkedIn Integration
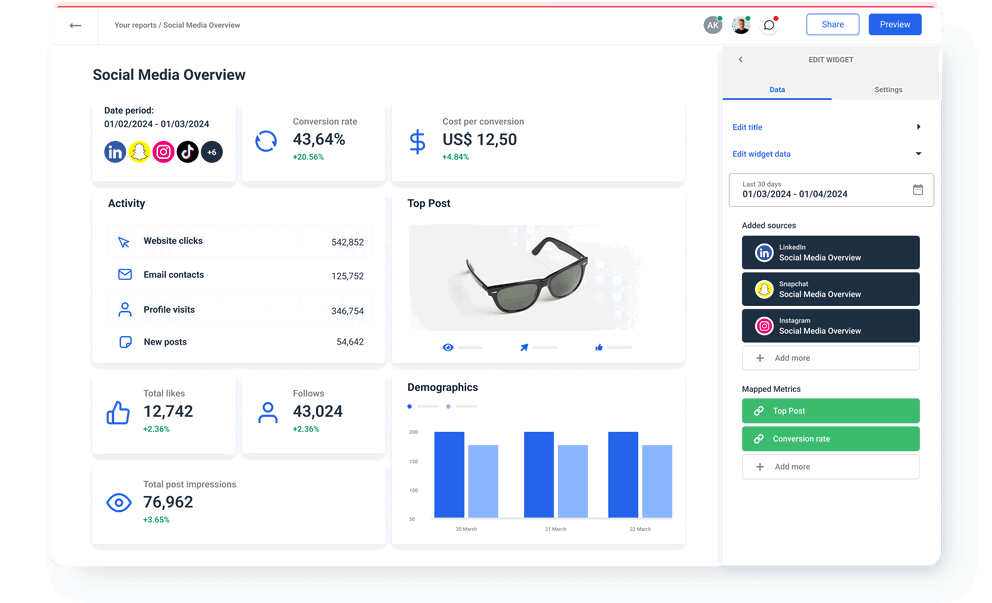
Connect your LinkedIn data and use Whatagraph’s advanced visualization to analyze and share the performance of your LinkedIn campaigns. A fully managed LinkedIn integration pulls data directly from your LinkedIn marketing account to our stunning custom reports. In a few clicks, map the outreach and conversions of your social posts. Blend and organize your LinkedIn profile metrics before visualization to present only the most impactful data points. Share insights from your marketing data automatically as scheduled emails or live links.
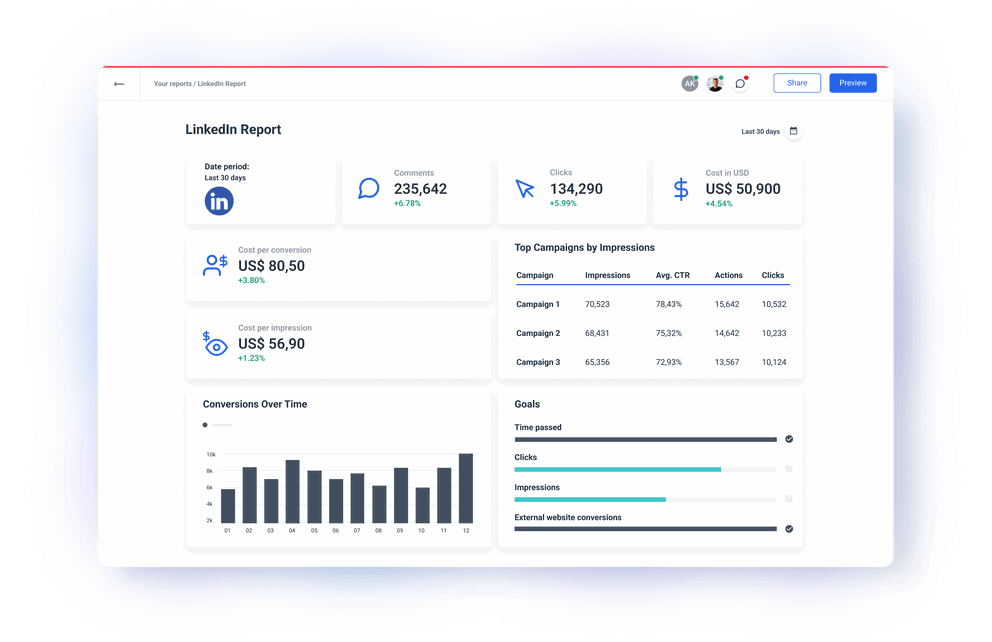
Manage all your LinkedIn page metrics via a direct connector to LinkedIn API

Blend your LinkedIn data with performance insights from other social media
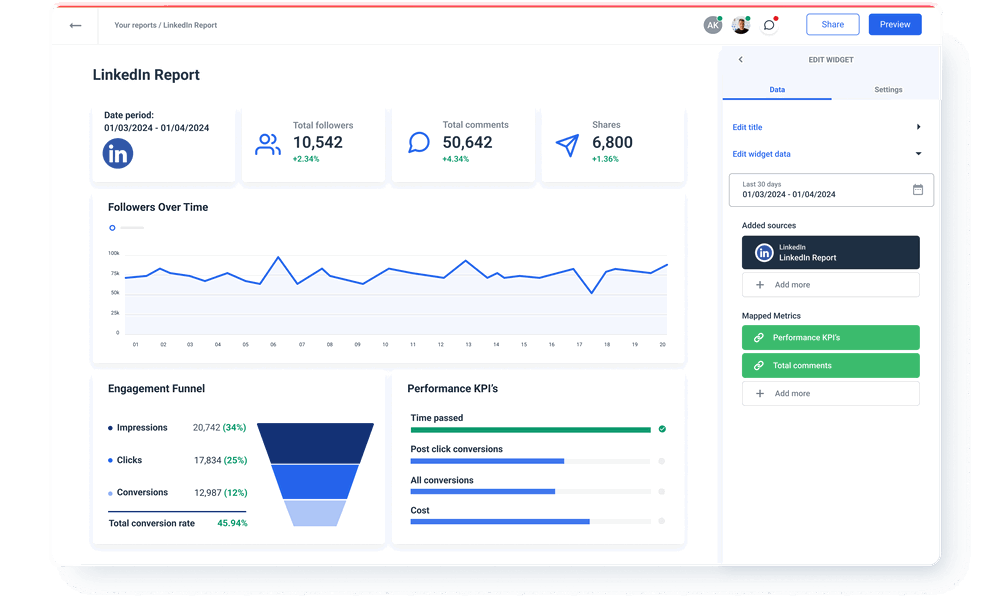
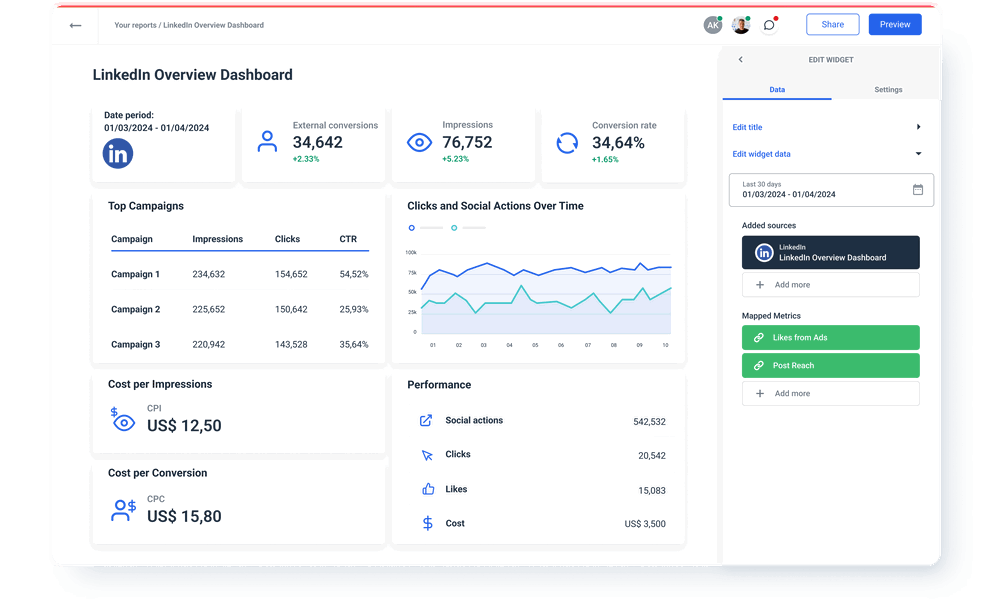
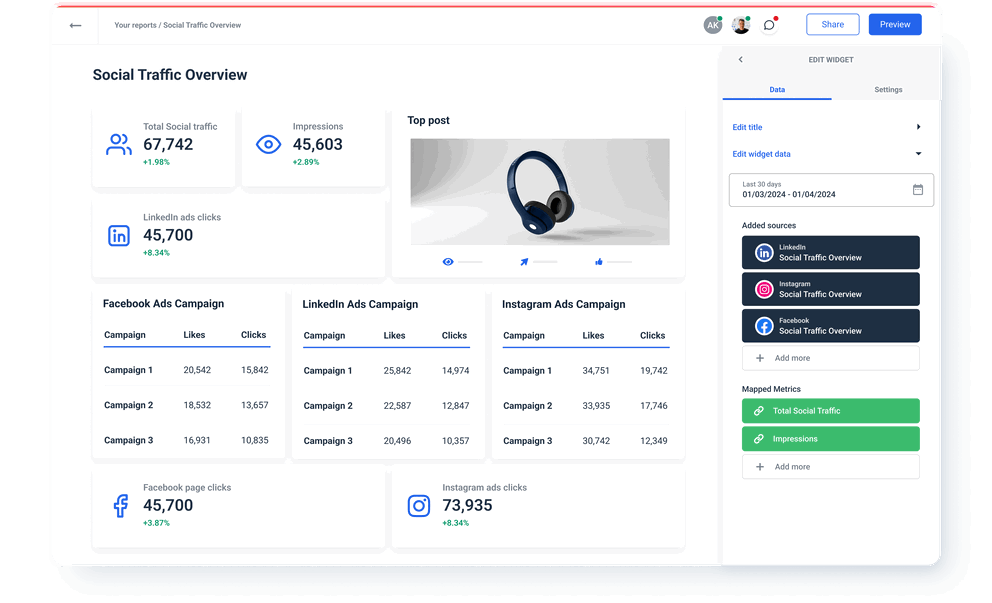
LinkedIn metrics available instantly in Whatagraph
All
LinkedIn Total
38LinkedIn Comments
2LinkedIn Reactions Through Selected Date Range
7LinkedIn All Time Comments
2LinkedIn All Time Reactions
7LinkedIn Metrics
Search...

Total all mobile views

Total all desktop views

Total all page views

Total mobile life at page views

Total desktop life at page views

Total life at page views

Total mobile overview views

Total desktop overview views

Total overview views

Total mobile careers views

Total desktop careers views

Total careers views

Total mobile about views

Total desktop about views

Total about views

Total mobile people views

Total desktop people views

Total people views

Total mobile insights views

Total desktop insights views

Total insights views

Total mobile jobs views

Total desktop job views

Total job views

Total mobile link clicks

Total mobile jobs clicks

Total mobile employees clicks

Total jobs clicks

Total banner clicks

Total unique impressions

Total shares

Total comments

Total likes

Total clicks

Total impressions

Total followers

Comment mentions

Share mentions

Comments through selected date range

Top level comments through selected date range

Reactions through selected date range

like reactions through selected date range

empathy reactions through selected date range

praise reactions through selected date range

maybe reactions through selected date range

interest reactions through selected date range

appreciation reactions through selected date range

All time Top Level Comments

All time Comments Count

All time Like Reactions

All time Praise Reactions

All time Maybe Reactions

All time Empathy Reactions

All time Interest Reactions

All time Appreciation Reactions

All time Reactions
Check out related integrations:
Explore marketing automation and custom report features




Pick a template and start reporting
Frequently Asked Questions
What other marketing data sources can I connect with Whatagraph?
Apart from LinkedIn sources, you can connect a range of popular marketing platforms like Google Analytics 4, social media like Facebook Page and Instagram, PPC like Google Ads, Microsoft Advertising, LinkedIn Ads, CRMs like Salesforce and HubSpot, as well as email marketing and e-commerce platforms. If you can’t find the integration for your data source, you can connect it via a Custom API or by exporting it to Google Sheets docs or BigQuery data warehouse and adding it as a source.
Do I need Looker Studio to visualize LinkedIn data?
No, you don’t need Looker Studio (Google Data Studio) or any other tool to visualize your LinkedIn data. Whatagraph is an all-in-one marketing data platform to connect, organize, visualize, and share all your data. This makes Whatagraph a better choice than other data platforms that provide only the connection functionality, so users need to use a separate tool to visualize their LinkedIn data insights.
How to connect LinkedIn data to Whatagraph?
Whatagraph has a pre-built LinkedIn connector, so you don’t have to purchase and configure third-party data connectors. Adding a new LinkedIn source is simple:
1. Go to the Data Sources menu and locate LinkedIn among the channels.
2. Click Connect an account.
3. From there, you’ll be redirected to log in to your LinkedIn account.
4. Once forwarded to LinkedIn, authorize to connect data from LinkedIn, select your account and name your data source.
5. The new LinkedIn source will appear.
You have successfully created a connection to your LinkedIn API. Create a custom report or dashboard and add your LinkedIn account as a source.
When you connect LinkedIn company page data to Whatagraph, you can organize datasets to get more granular insights by device, campaign ID, date, etc. You can visualize data in various widgets and share the insights via automated email attachments or live links for near real-time access.
Can I export data from LinkedIn reports?
Yes, you can export data as Excel spreadsheets or CSV files. This way, you can easily move it to Tableau, Power BI, or other data destinations for further analysis.
Effortlessly create reports and dashboards
What others think about Whatagraph
I made a switch from GDS and Sheets for reporting to Whatagraph, and I am saving literal hours each week on performance report creation. Our small firm actually managed to onboard 2 new clients as a result of all the time we saved on managing data and reporting. The customer service is also really helpful and easy to reach.
Having active customer support to help fix any issues was a big contributor, but we also really liked the ability to save templates and connect sources to multiple charts/widgets at once without having to edit them individually. And having the grid layout is much easier to stay consistent with than the free form setup that Data Studio has.
The system has standard templates that are easy and fast to use. Also you can build your own report with lightning speed. It is very easy to use, has a lot of integration, and let get started very fast.
We love Whatagraph - we would definitely recommend and our account manager is great! I love how easy this tool is to use, everyone on the team finds it much more user-friendly than other dashboards. Integration was easy, we sent some example reports to the team who duplicated these for us. We literally had to log in and send it to our clients!
We are showing our clients the work that we're doing for them and this is incredibly important for our clients ROI. They want to see results and having a tool like Whatagraph that can show data from virtually every source we use is hugely important.
The tool is easy to use; you do not need to have development resources. Even my junior project managers are capable of making campaign reports in minutes. There are a lot of pre-made templates you can use as well as many pre-made widgets.
Really easy to connect data sources within the tool. The library of report templates has been helpful. The customer support team has been responsive to all of our needs. Our team enjoys the simplicity of setting up the reports and how the data is presented.


