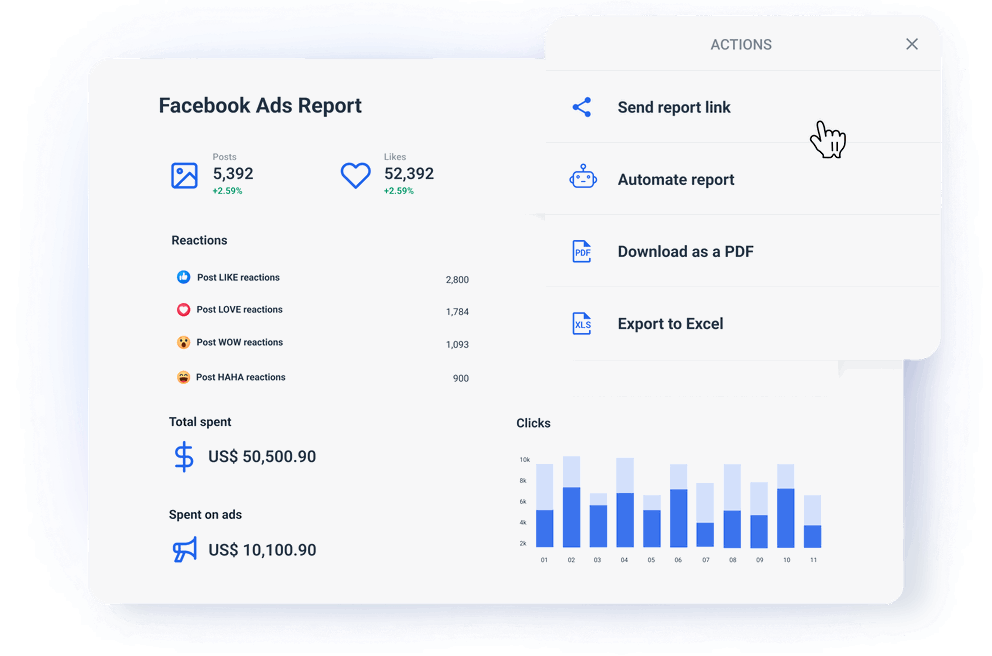
How do I track my Facebook Ads performance?
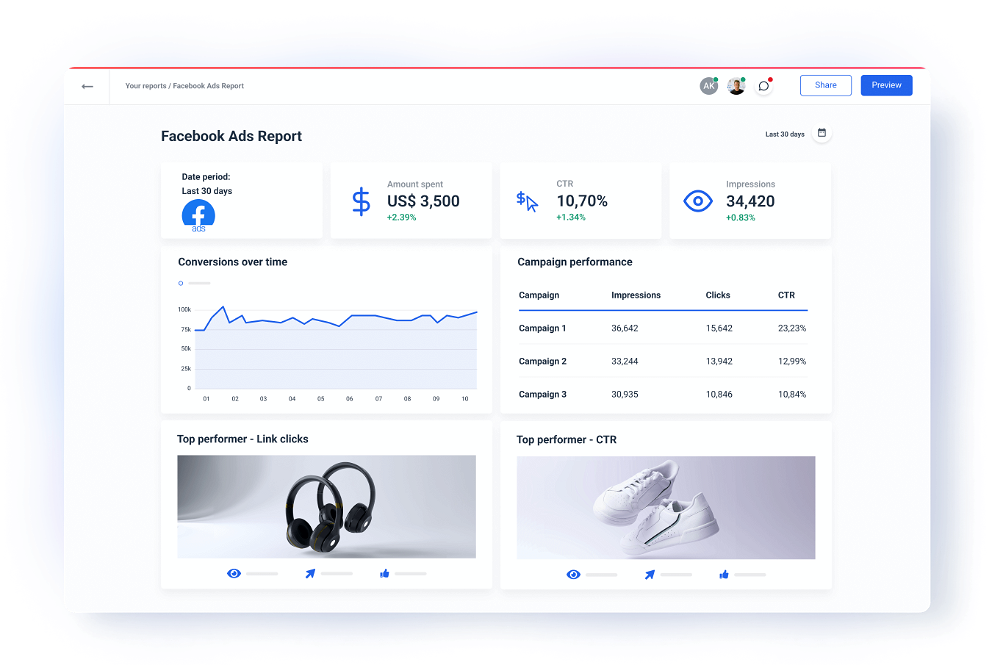
Instead of manually pulling data from 10+ campaigns, Facebook advertising reporting tools like Whatagraph offer a better alternative.
These tools allow you to pull data from your Facebook Ads Manager and visualize it in easy-to-read reports.
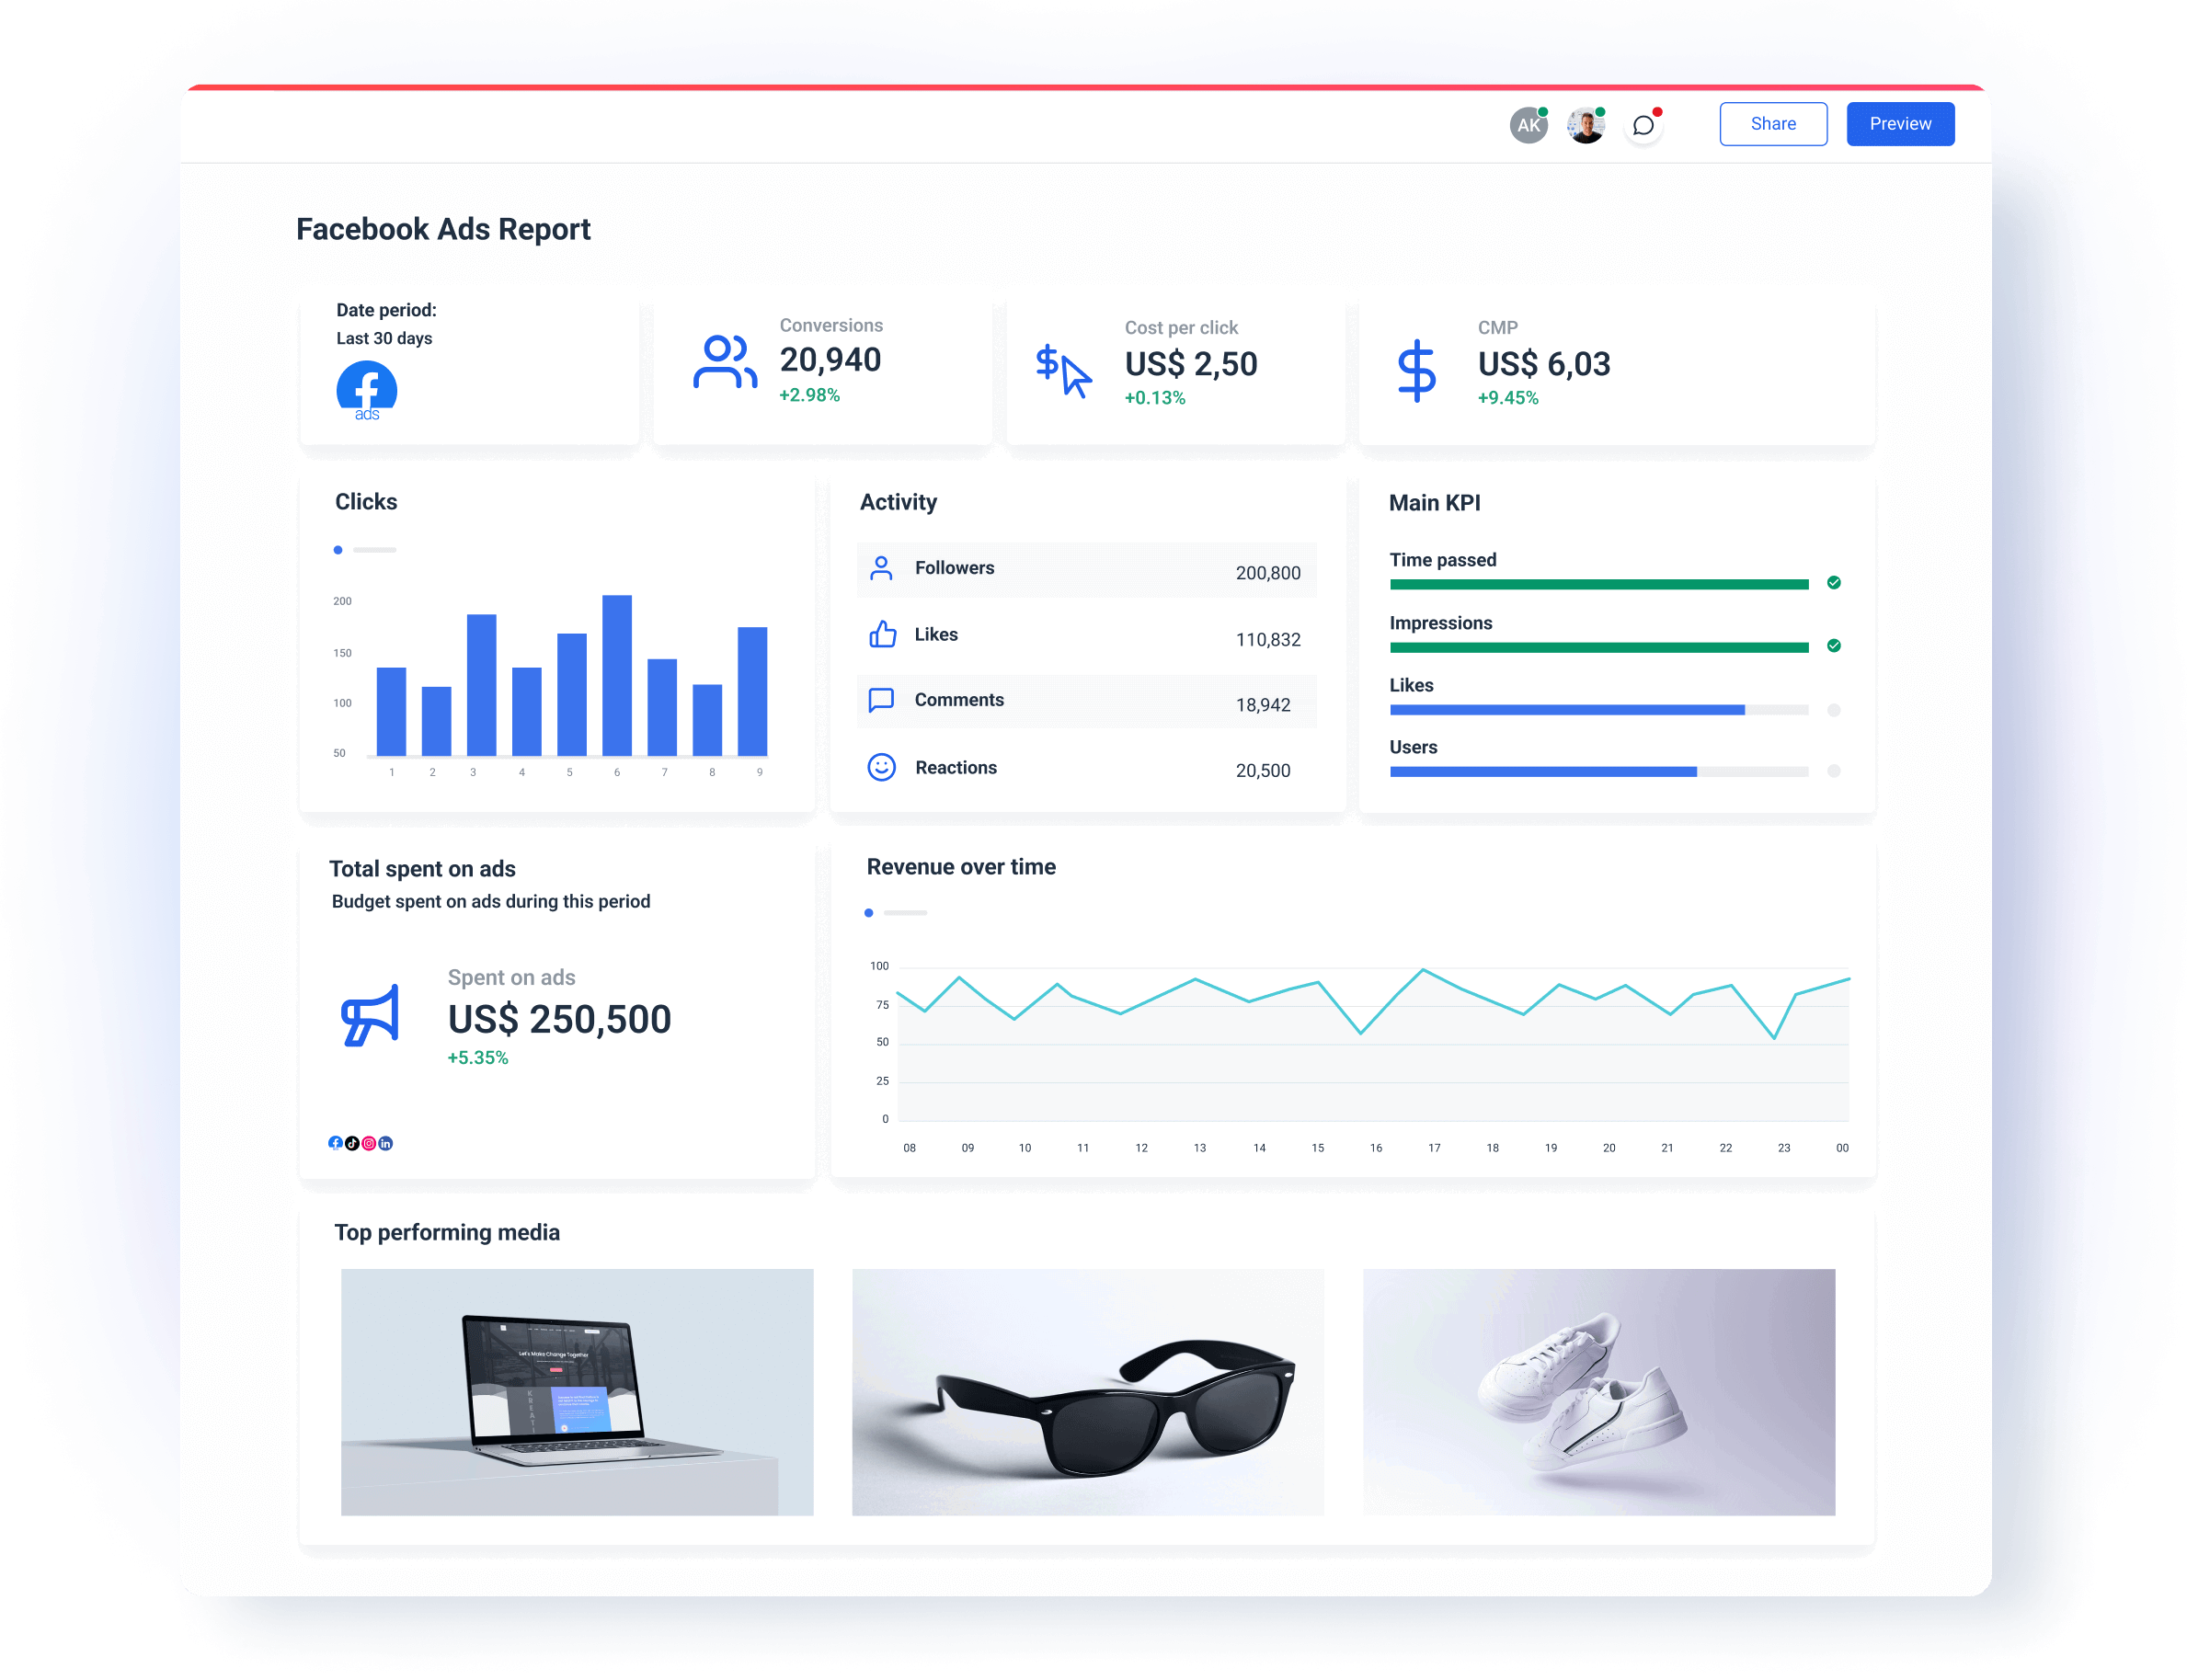
How to choose the best Facebook Ads reporting tool?
Not all Facebook Ads reporting software are created equal.
To get the most out of your tool, we recommend looking for one that offers:
1. Ease of use
You shouldn’t be a developer to be able to build a Facebook Ads report.
Anyone on your team—from senior marketers to junior account managers—should be able to create reports that highlight key Facebook Ads metrics.
Prioritize Facebook ads tracking tools with:
- Pre-made Facebook Ads dashboards and report templates
- An interface that’s easy to learn for all users (not just the internal expert)
- Drag-and-drop widgets and charts for visualizing ad performance
- Data aggregation to combine Facebook Ads data with other sources
- Reliable customer support for troubleshooting issues
All this means your team can build Facebook Ads reports without spending hours on manual work or technical know-how.
2. Stable integrations
Stable integrations are a must, as they prevent having daily connectivity issues or inconsistent data.
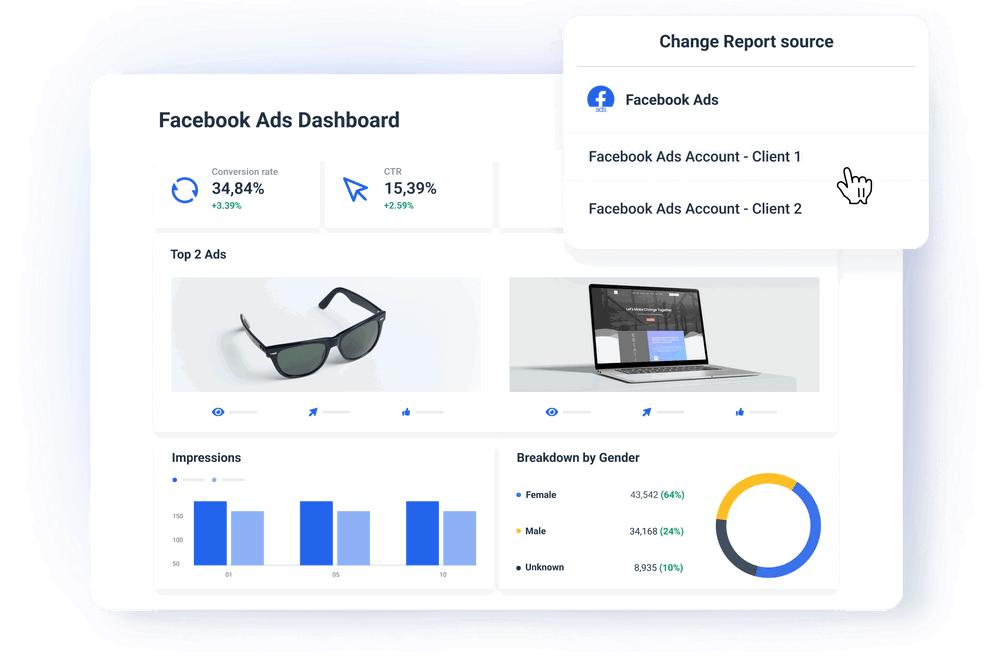
To solve this, the best platforms offer fully managed Facebook Ads integrations.
No extra setup or connectors needed, which makes the integrations more stable, seamless, and reliable.
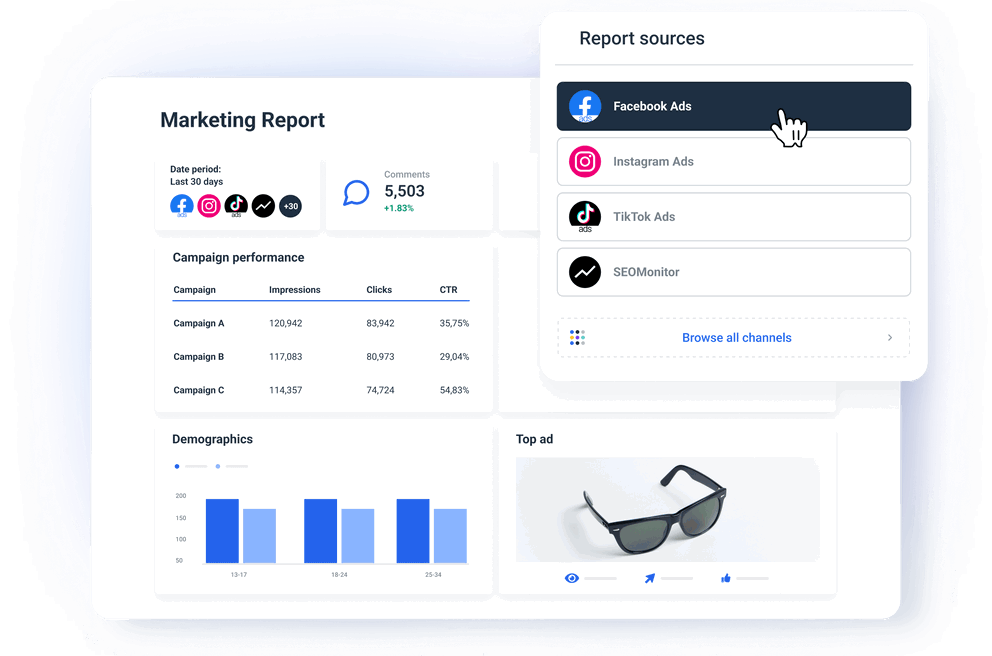
And not only should Facebook Ads integration exist, but other integrations should as well. After all, you probably want to add insights from multiple data sources into your reports.
Aside from Facebook Ads integration, look for integrations with:
- Paid advertising platforms, like Facebook Ads, Google Ads, and TikTok Ads
- Social media platforms, like Facebook, Instagram, and LinkedIn
- SEO tools, like Ahrefs, Semrush, SE Ranking, and AccuRanker
- Analytics tools, like AppsFlyer, Google Analytics, and Matomo
- Email marketing tools, like ActiveCampaign, Klaviyo, and MailChimp
Whatagraph integrates with all of these, and much more. You can choose from 55+ fully-managed integrations and start pulling data in just a few clicks.
3. Highly customizable
On Whatagraph, you can pick and choose which metrics/KPIs you want to highlight using drag-and-drop widgets.
The metrics differ for each channel, but for Facebook Ads, you can highlight:
- Performance metrics, like reach, impressions, clicks, and CTR
- Conversion metrics, like unique purchases, CPC, and off-site conversions
- Engagement metrics, like unique likes, page engagement, and video plays
- Catalog segment metrics, like adds to cart with shared items value
- Converted product metrics, like content views and website purchases
These can be displayed individually, or you can combine multiple metrics into one widget and create custom metrics and dimensions.
For example, say you want to report on "Add to cart" across Facebook Ads and TikTok Ads. You can set up a custom metric for this, such as:
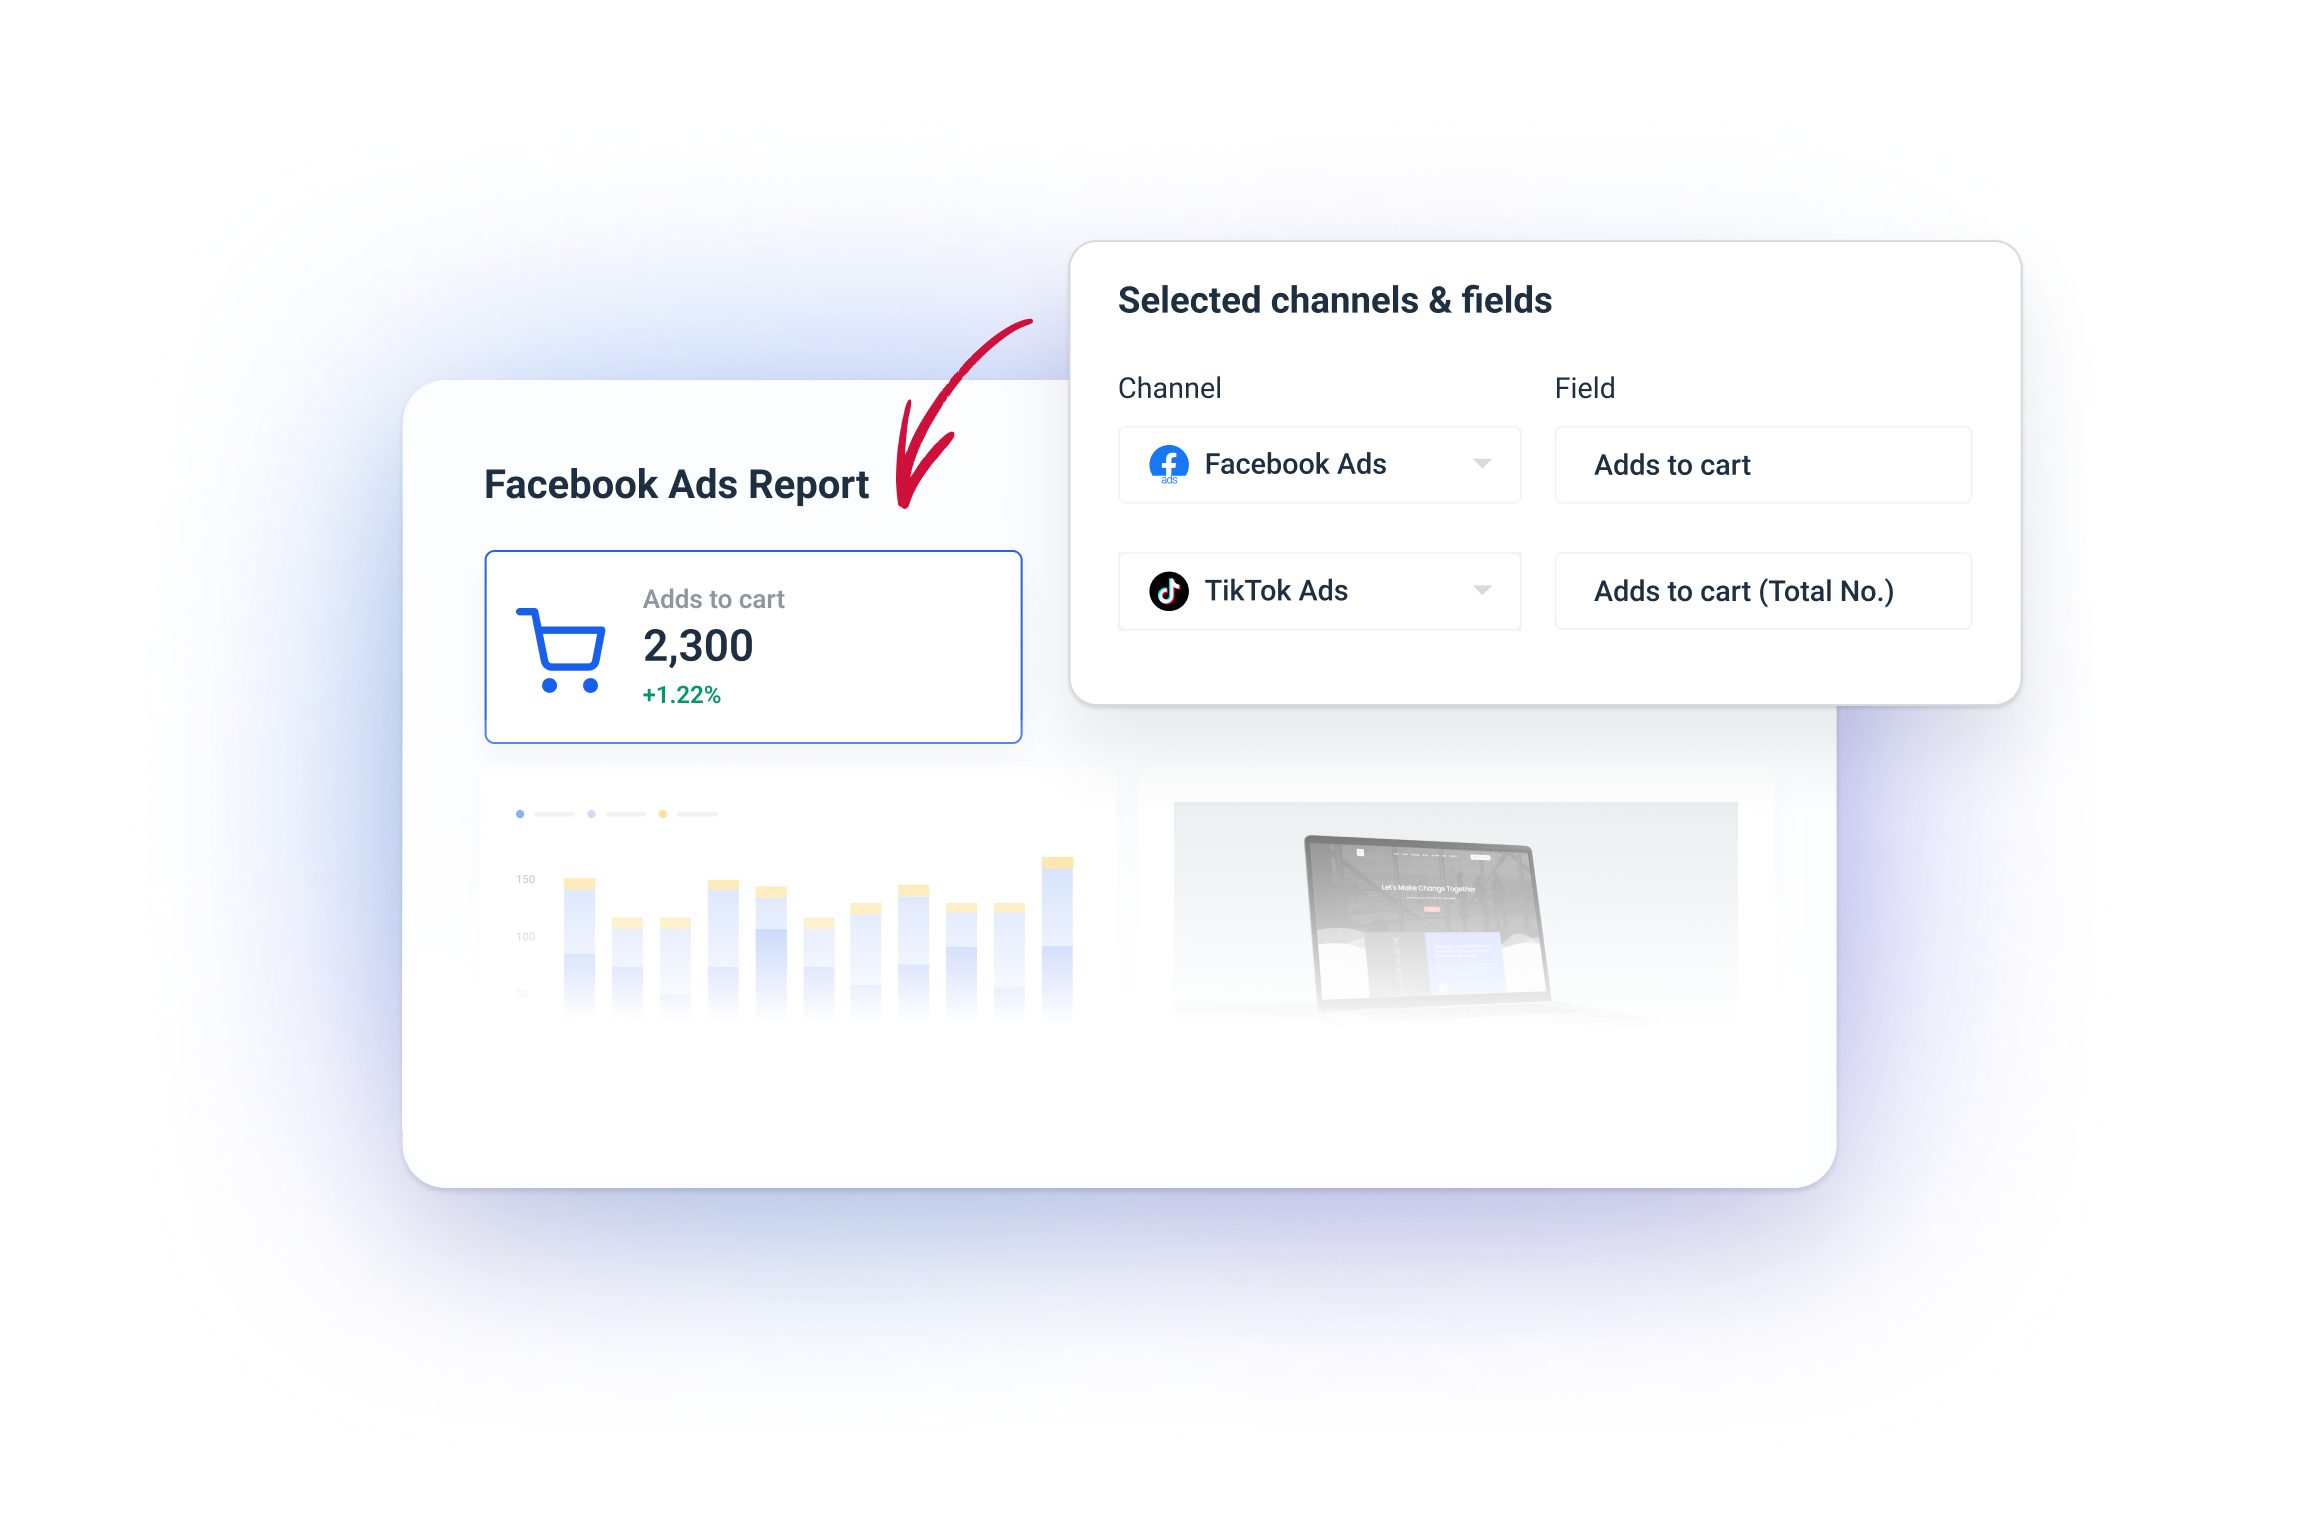
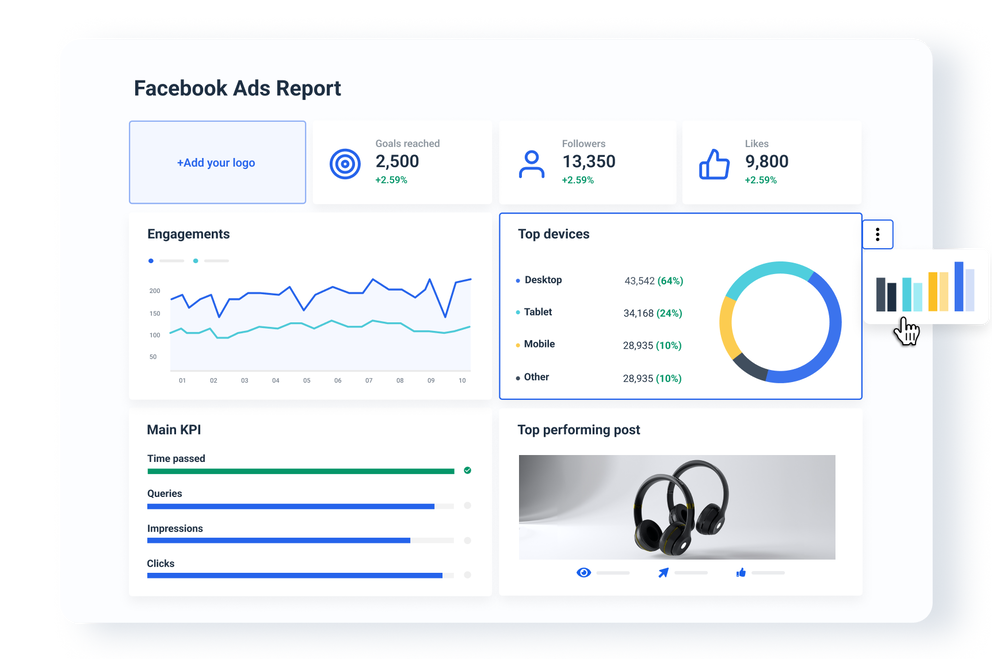
Not only can you customize data, but also the look of the reports.
This includes:
- Changing color schemes in your reports
- Using your own custom domain and logo
- Adding comment boxes, notes, and headers
- Personalizing the cover page
- Using emojis and icons
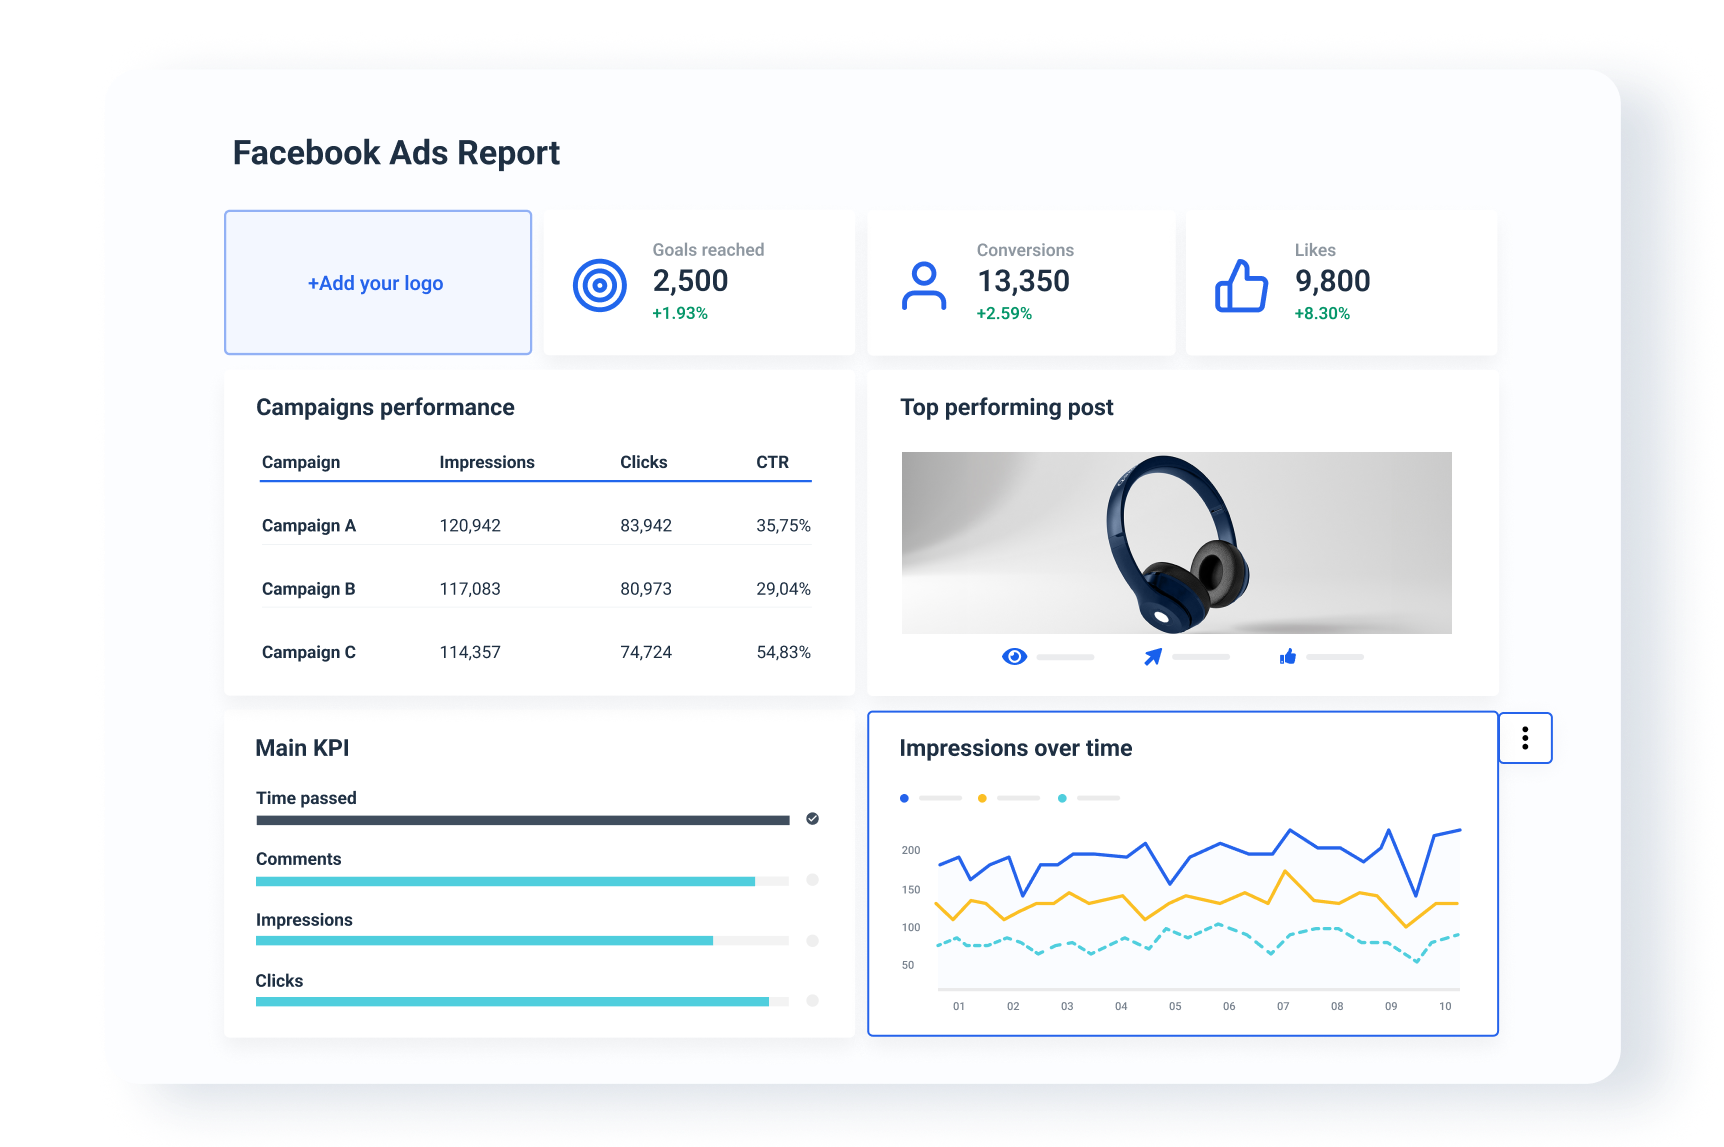 Having access to custom reports and white-labeling is important, especially for marketing agencies that value full control over the look and feel of their reports.
4. AI insights and summaries
You can automate many parts of reporting, but how about writing performance summaries? Or, getting insights from your Facebook ad account?
AI reporting features solve these.
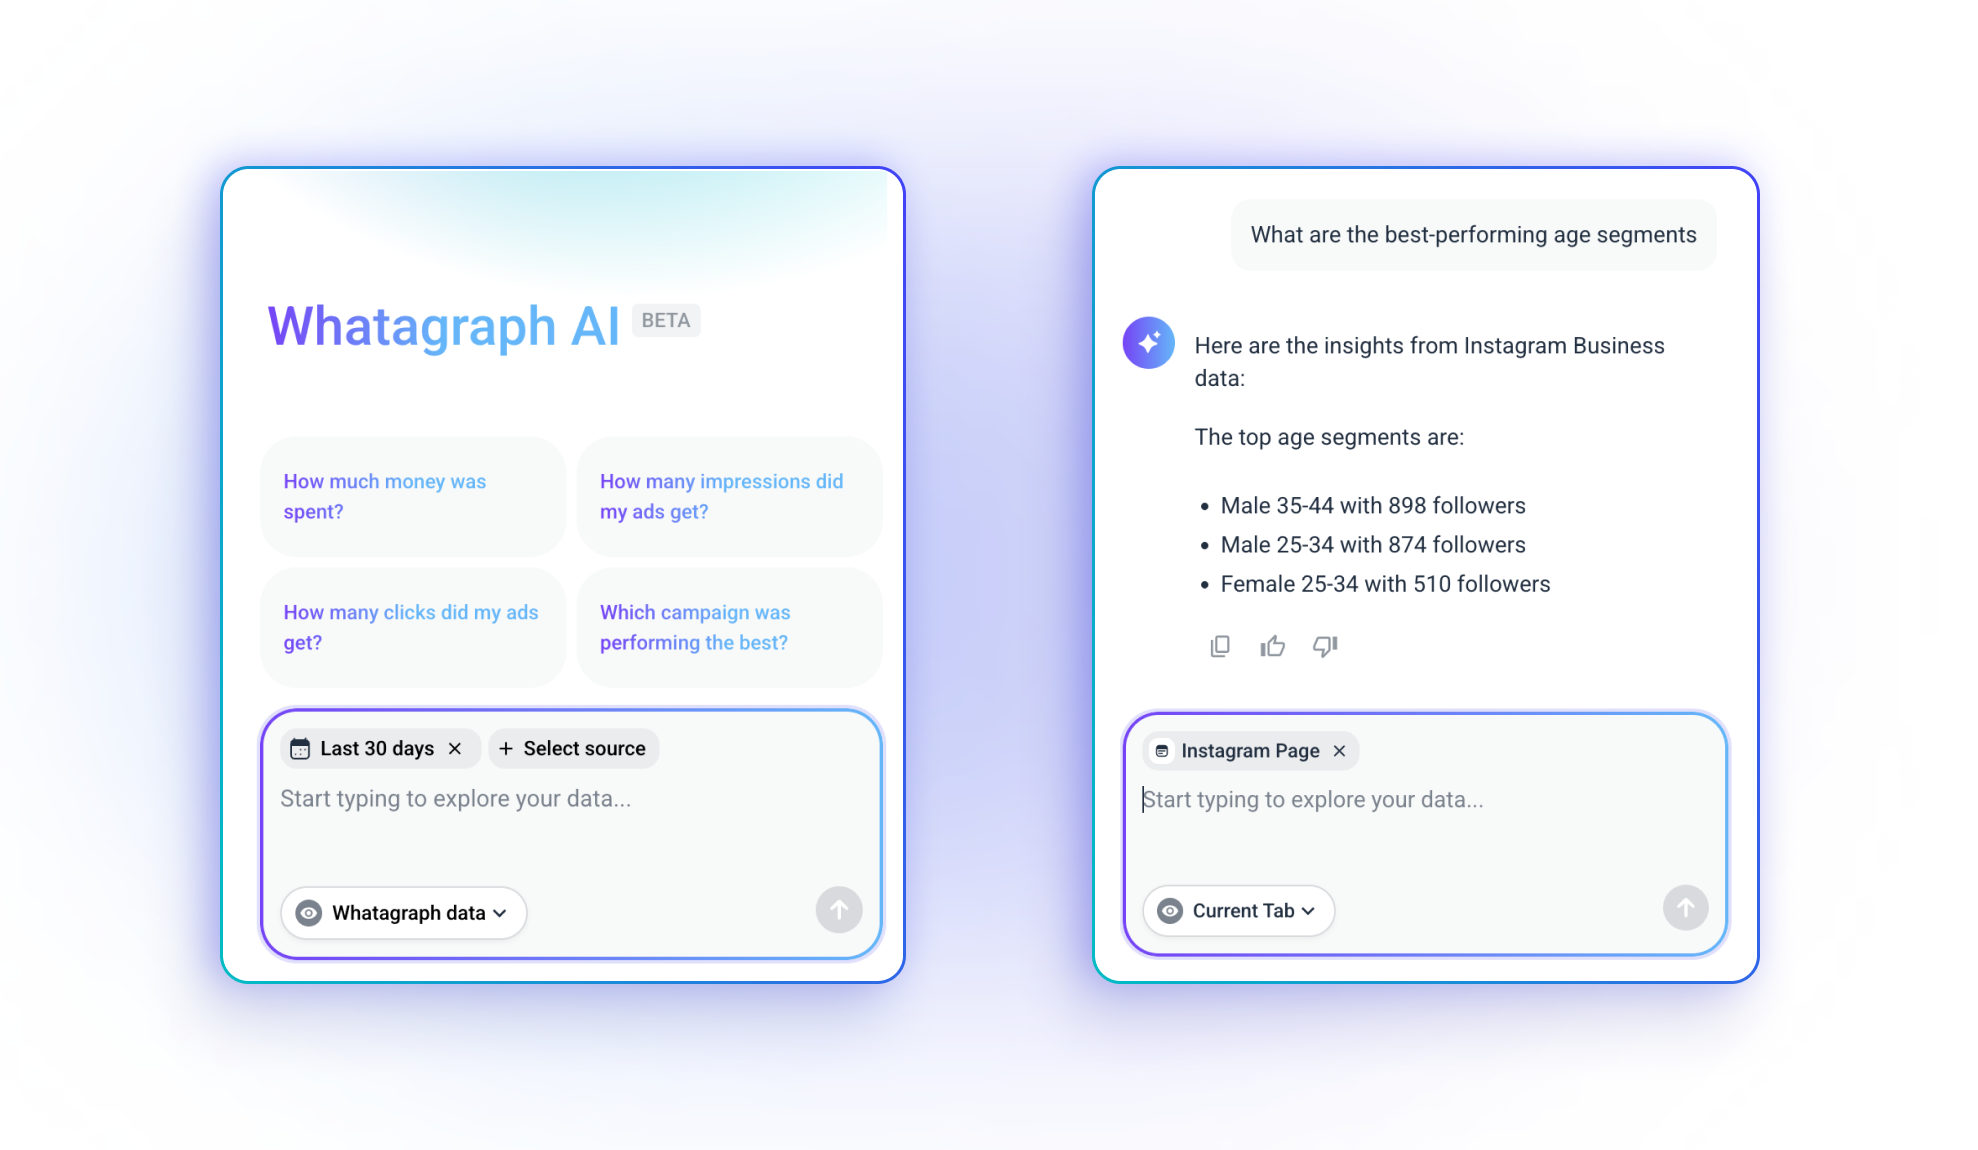
On Whatagraph, you’ve got access to two innovative AI features:
- AI chatbot: Ask the AI chatbot any questions you have about your Facebook Ads data. For example, “Which ad set had the best ROAS this month?” or “What was our top-performing campaign by CTR?”
- AI summaries: Ask AI to write a Facebook Ads performance summary, which you can add directly to your reports. Edit it further to add a bit of a human touch.
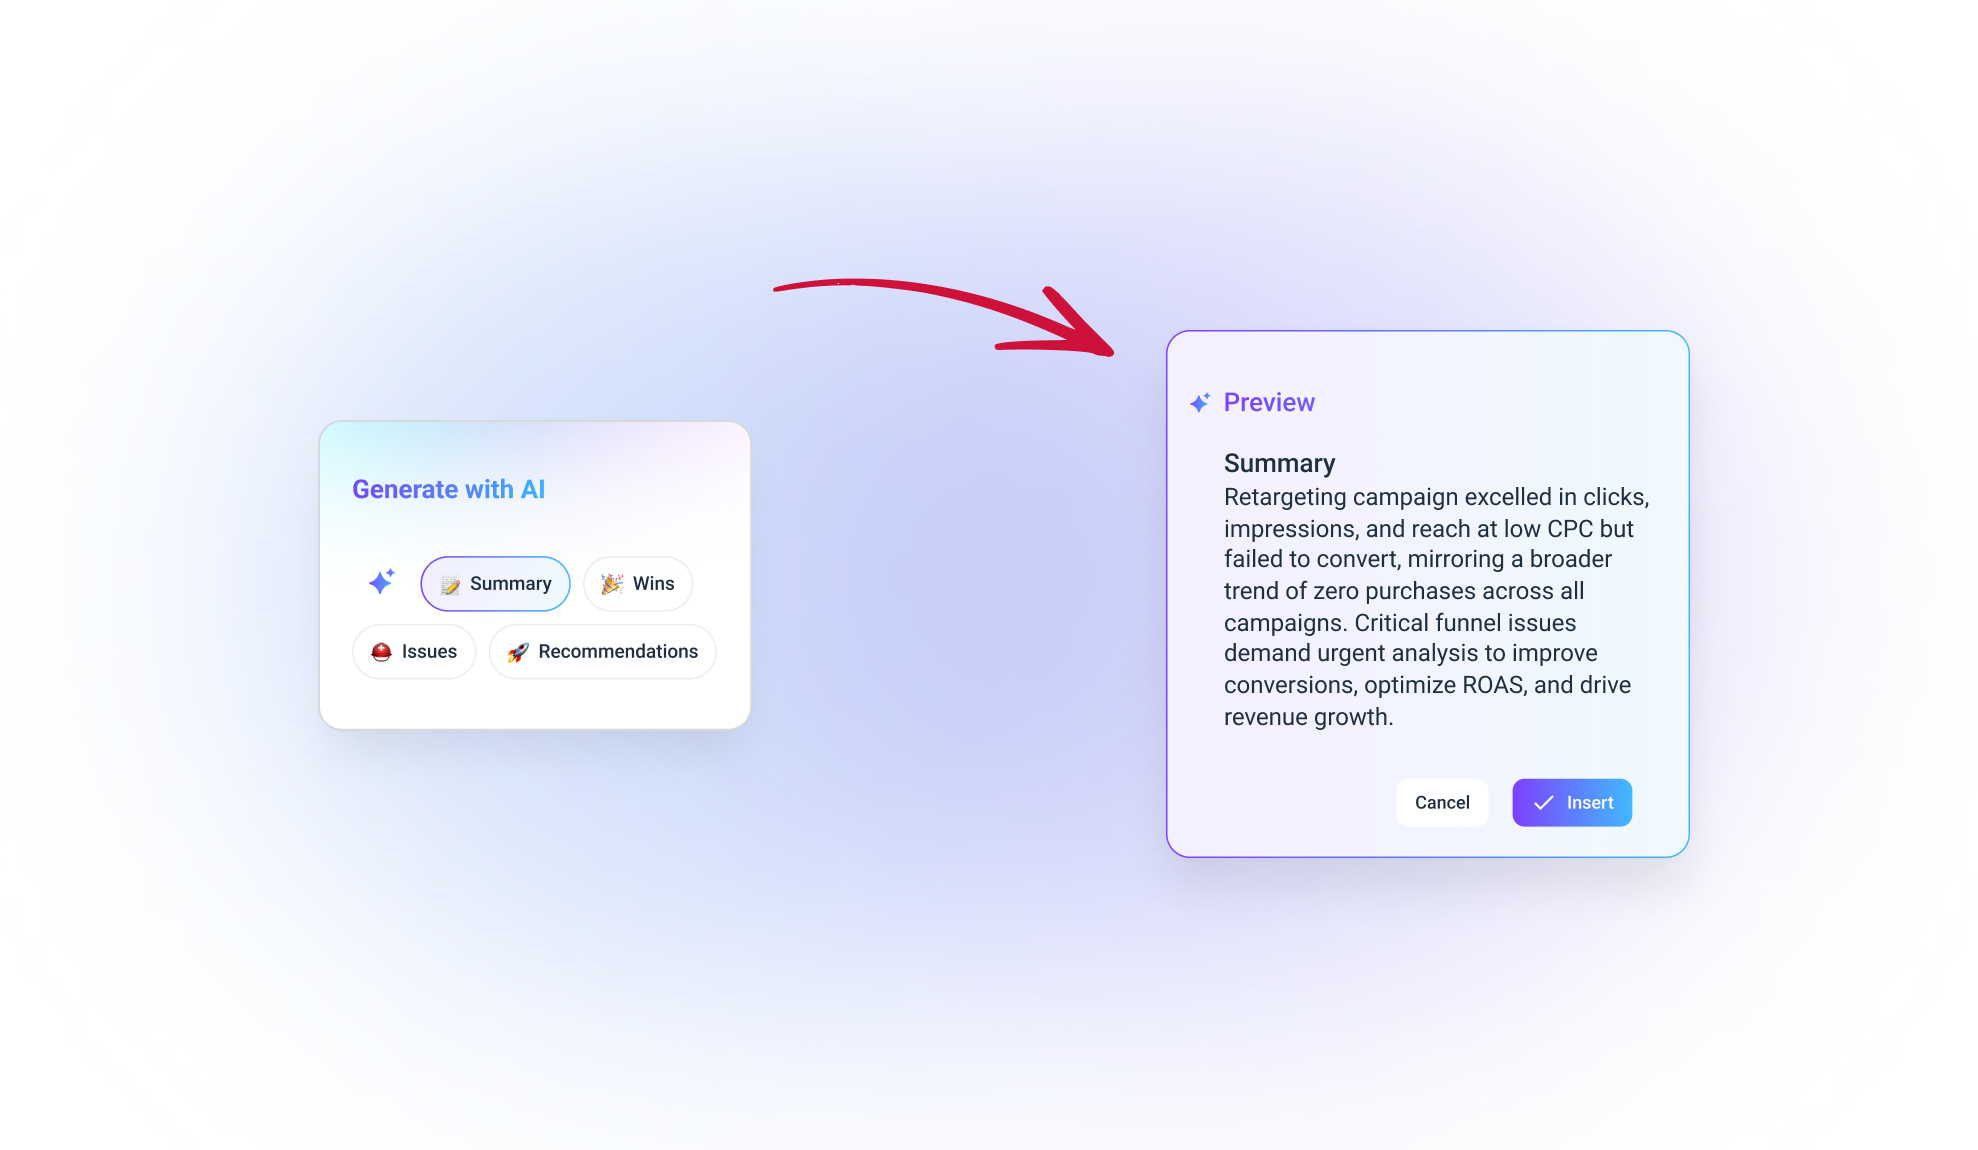
All of this means you don’t have to write summaries from scratch.
You can instantly turn Facebook marketing data into clear insights that you can show to clients.
5. Fast and friendly customer success
No matter how easy your Facebook Ads reporting tool is, you may still need help going through things.
At Whatagraph, all users (no matter their plan) can reach us via live chat. We promise first response times of under 4 minutes, and most issues are resolved within four hours.
All users also get access to a dedicated Customer Success Manager who will help you:
- Migrate your data from your previous tool (if you were using one)
- Set up your first folders, dashboards, and reports
- Make custom data blends, metrics, and dimensions
- Anything else you need help with
How do I automate Facebook Ads reporting?
The best way to automate Facebook Ads reporting is to use a dedicated Facebook reporting software.
For example, Whatagraph helps to automate Facebook Ads reporting in four steps:
Step 1. Connect to your data sources.
Adding a new data source, like Facebook Ads, can be done in a few clicks on Whatagraph.
From the “Data sources” page, click on “Connect new source” and search for Facebook Ads.
You’ll be asked to log into your Facebook account, so the data can flow in freely.
Step 2. Organize your data.
Once you’ve integrated your Facebook Ads account, you can get right into organizing your data.
This means:
- Creating data blends
- Standardizing campaign names
- Matching metric names
- Unifying dimension names
- Segmenting data by specific geographics or demographics
Organizing data may sound like a complex task, but it’s surprisingly easy—and can be done without writing a single line of code.
Step 3. Visualize the data.
Data visualization involves building the actual reports.
You can visualize data in three ways with Whatagraph:
- Start from a blank page and use our drag-and-drop widgets
- Use one of our premade templates
- Use our smart builder
Then, choose Facebook Ads as a data source and set your time range.
After this, you can add metrics, which can be done in 4 different ways:
1. Build your own metrics
2. Drag and drop pre-made metrics onto the report
3. Use widget templates
4. Use offline data
For new users, we always recommend using pre-made widgets.
Step 4. Share your Facebook Ads reports.
Once you’ve visualized your data, it’s time to share it with team members and clients.
Whatagraph gives you a few options for this:
- Email: Schedule and send white-labeled emails on a regular cadence (like weekly or monthly)
- Links: Create report links and share tjem with anyone you’d like
- File: Export reports as Excel or CSV files
Alternatively, it’s possible to transfer data to BigQuery and Looker Studio.
What are the key metrics to track in Facebook Ads reporting?
Ad spend: The total amount you’ve spent on all Facebook Ads campaigns. Simple metric, but good for showing clients how much the total campaign spending is.
Impressions: Essential for understanding how widely your ads are displayed. Impression is the number of times your ads were on screen for your target audience.
Clicks (all): The number of clicks your campaigns have brought. A good indicator of how engaging your ads are and how well they capture interest.
Cost per link click (CPC): Important for understanding how much you pay for each click. High CPC often indicates you need to change something in your ad campaigns.
Click-Through Rate (CTR): The percentage of people who clicked through your Facebook ad. A high CTR means your ads are resonating with the target audience.
Engagement: Engagement is a good indicator of how well your ads are received. It includes the number of post comments, shares, reactions, and saves your ad has received.
Top performing ad sets: A list of the 5-10 best-performing ad sets. Gives you a quick overview of what types of ad sets work and what you should prioritize.
