


How to Track Google My Business Data?
Tracking Google My Business data is important for improving your client’s local SEO performance and optimizing how they appear in local search results.
Here are several ways you can track and analyze GMB data to gain valuable insights:
1. Download Google Business Profile reports
These spreadsheet GMB reports make sense only for internal use in small businesses in which the CEO is also the Head of Marketing, and SEO specialist, etc.
It’s difficult to spot a trend or react to a change using multiple sheets. It’s even more difficult to inform someone who knows even less about marketing.
That’s why some small local business owners decide to:
2. Integrate GMB data with Google Analytics
Apart from GMB metrics, now you can track traffic driven to your website directly from your GMB listing via:
- UTM parameters: UTM tracking codes to the website link in your GMB profile to track website traffic and conversions generated from GMB clicks in Google Analytics.
- Behavior flow: How visitors who come from GMB interact with your website, such as what pages they visit and how long they stay.
However, tracking GMB data with Google Analytics has a big downside — the platform is huge and difficult to learn. You can ask someone to set up some basic reports, but changing anything yourself requires some skills.
And we didn’t even come to the reporting part. GA is very limited in the choice of report types and offers zero customization.
That is why marketing agencies should:
3. Use Whatagraph for advanced tracking and reporting
Whatagraph allows you to automate GMB data collection, create custom GMB reports, monitor performance, and automate report sharing with clients.
But let’s go from the start.
Why do we think Whatagraph is a No.1 choice as a GMB reporting tool for agencies?
Easy to set up and use
With a reporting tool that's easy to use, you'll spend less time figuring out complex software and more time delivering results for clients (and onboarding new ones!).
Whatagraph makes it easier to:
- Set up automated marketing data connections that refresh in real-time (no maintenance needed)
- Create any report you want within minutes with little or no training
- Add new widgets, graphs, and charts using drag-and-drop
- Customize each report for a specific client (without coding or design skills)
- Automate the report sending on a schedule that fits the client
With Whatagraph, you can put your reporting process on autopilot. You can use it to create engaging reports in less than an hour without asking for help from developers, graphic designers, or data engineers.
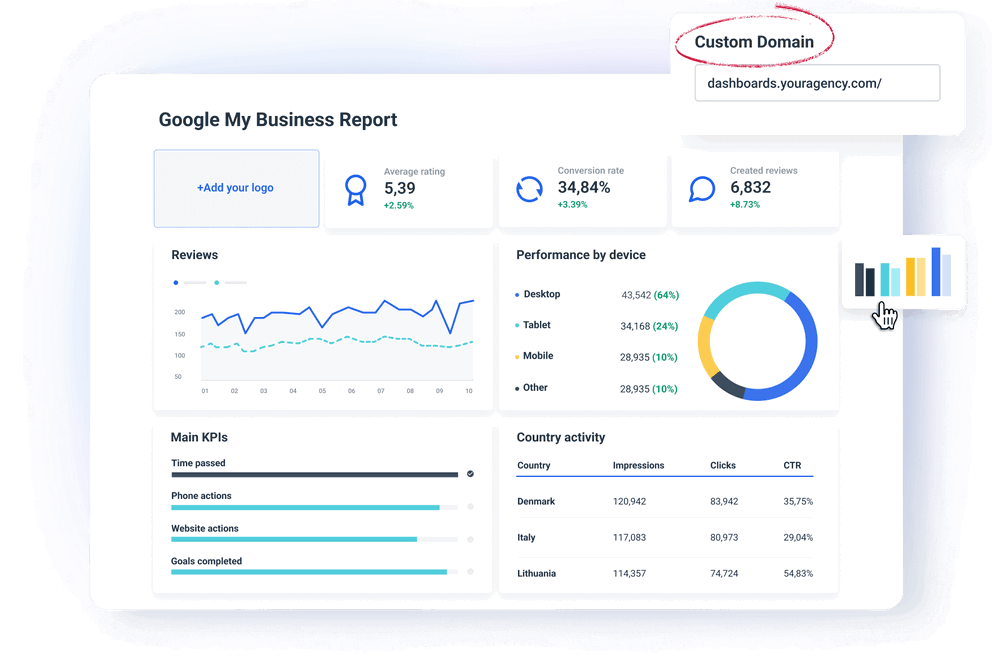
Highly customizable
Different clients have different optimization goals. This means the Google My Business reporting tool you choose must allow you to choose which key metrics to highlight in your reports.
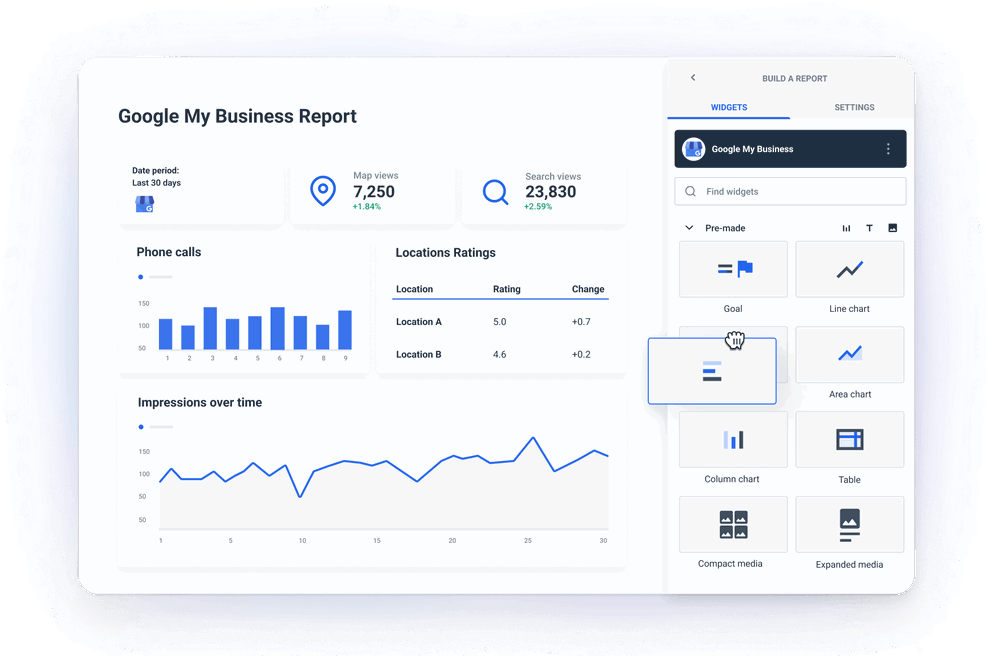
In Whatagraph, for example, this is very easy to do using drag and drop metrics widgets. All metrics from your GMB account are available as single-value widgets, graphs, charts, or tables.
Anyone on your team can easily build reports without hiring a data scientist.
On the visual side, you can:
- Upload your logo or the client’s logo to the report
- Create color schemes that match your or your client's brand colors
- Add text, headers, and footers
- Create more tabs to organize your report into sections
In other words, you can do everything to create a professional white-label report on your own.
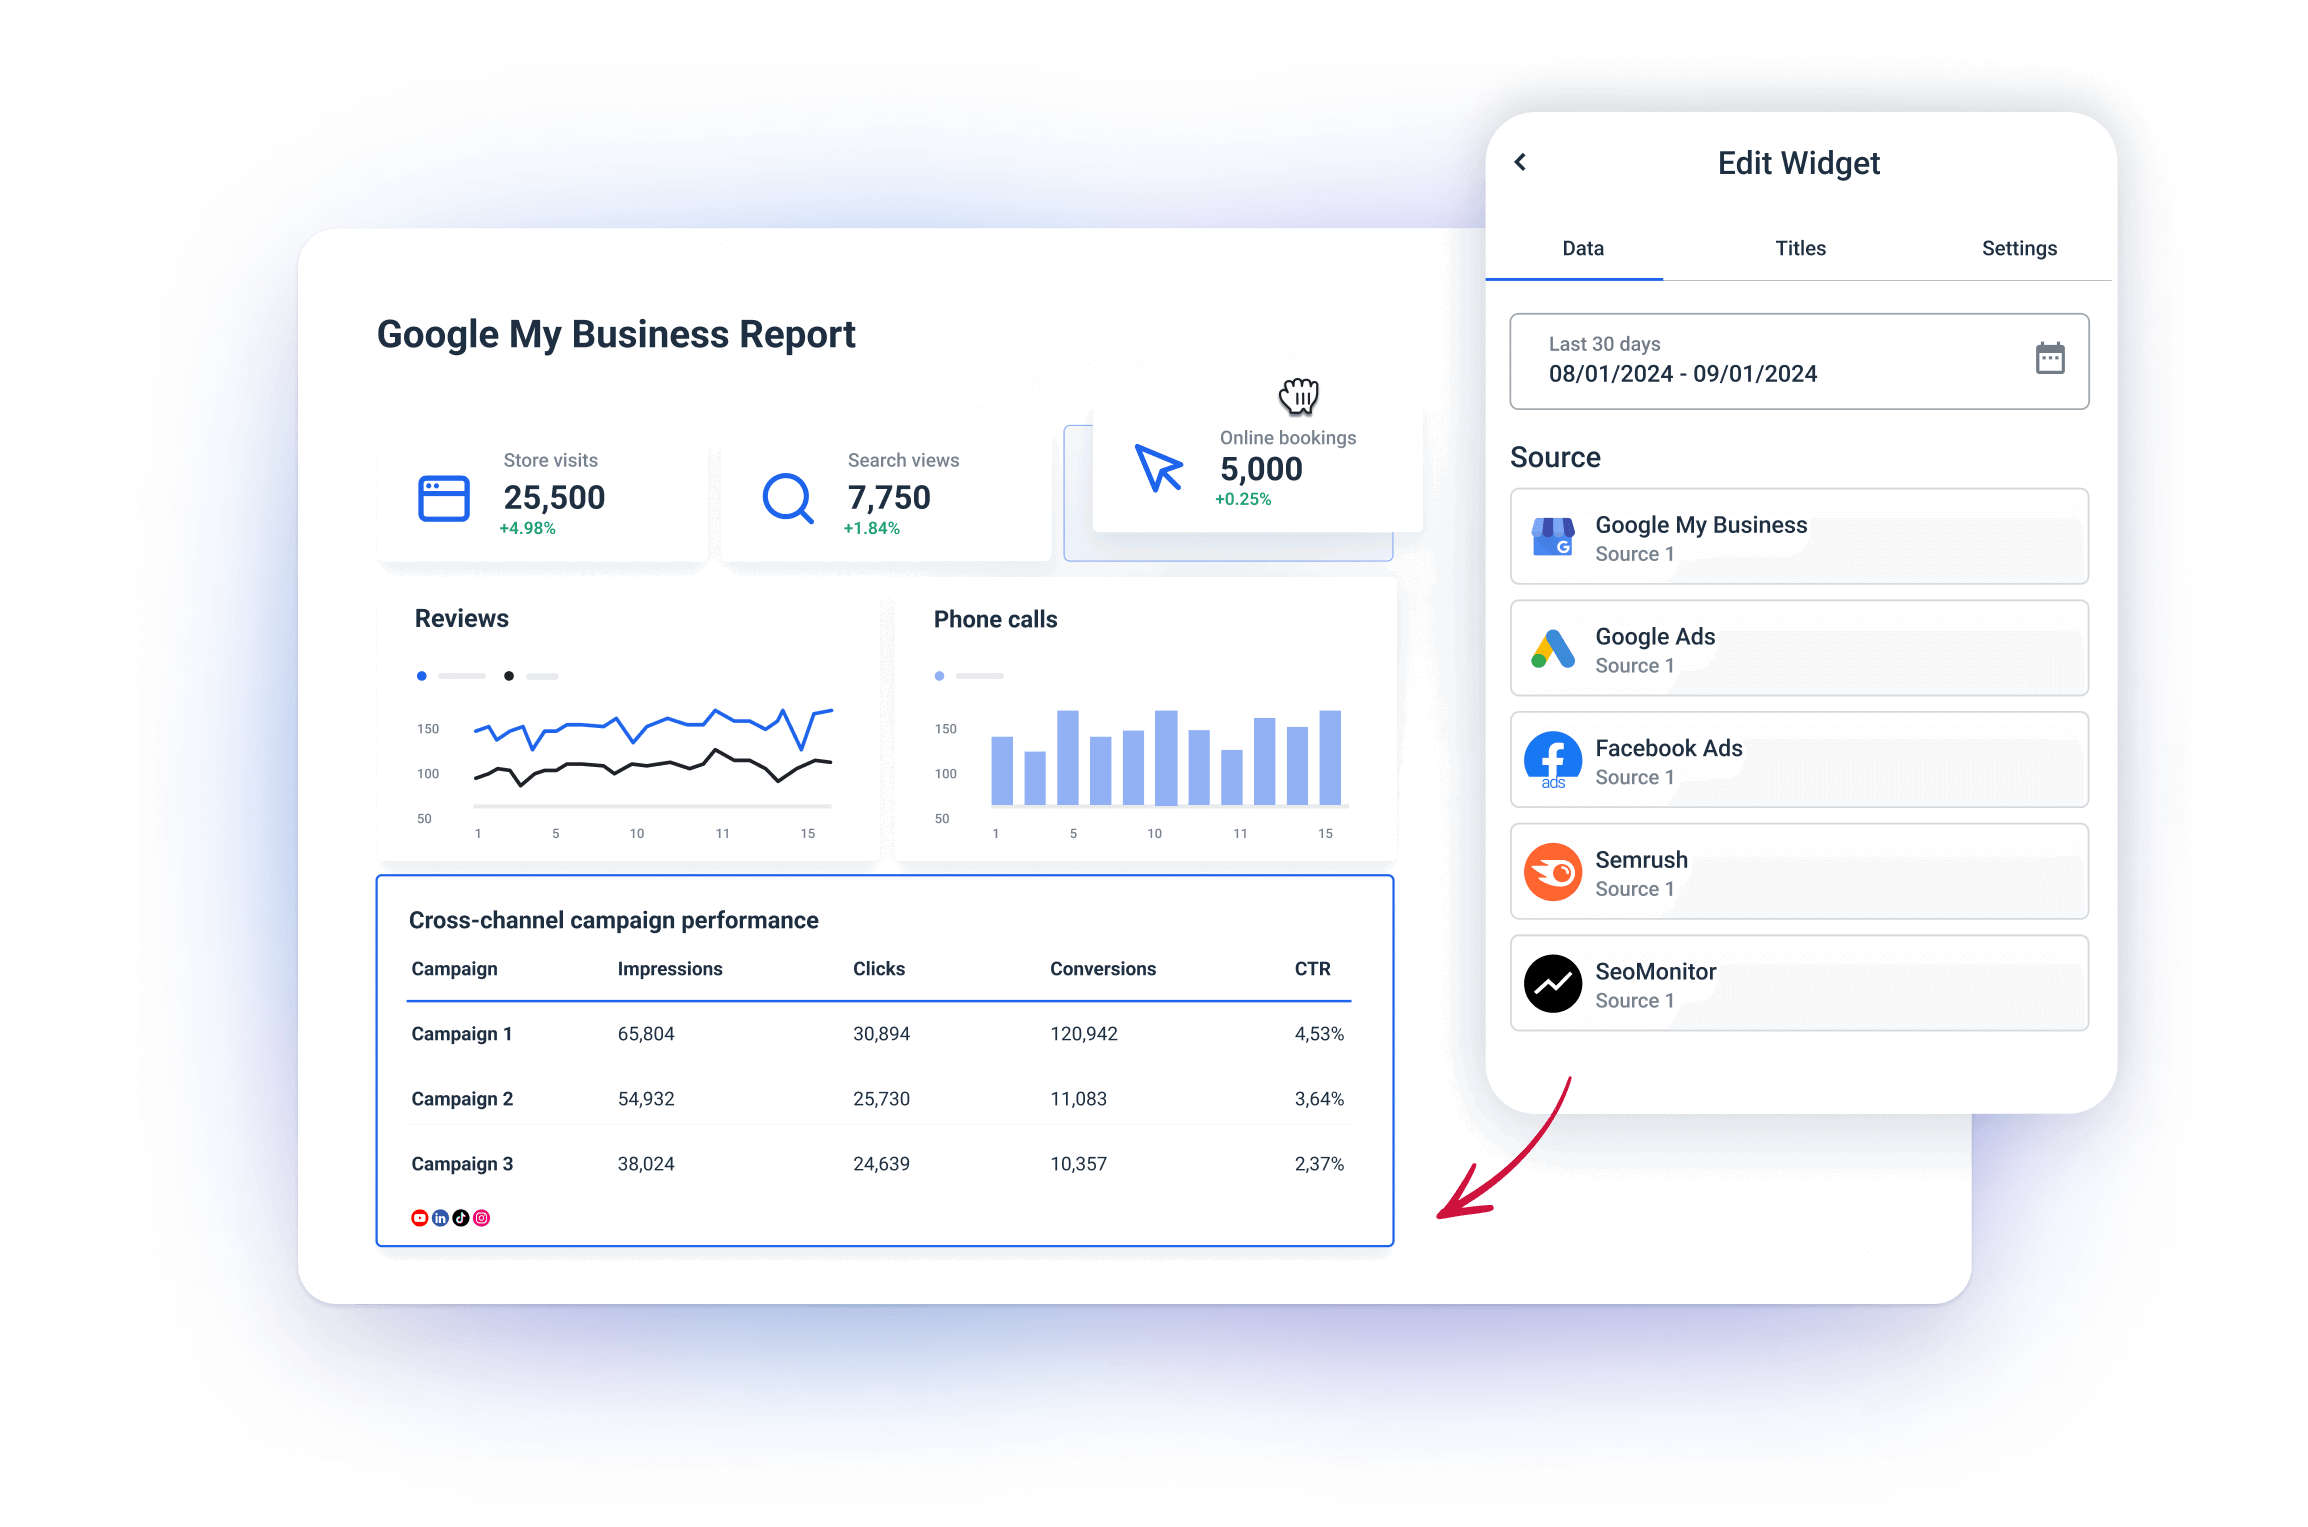
Easy to connect data from other platforms
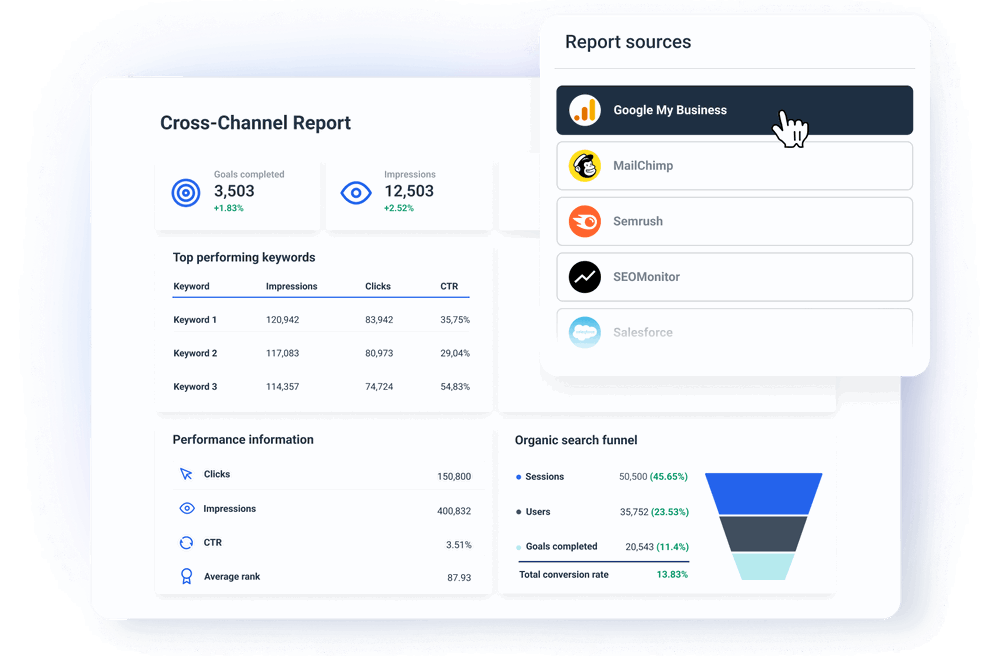
Clients may also hire you to audit and take action in other digital marketing areas. With Whatagraph, you can easily integrate data from other sources and monitor the overall organic search performance, website optimization, social leads, PPC, etc.
And the best thing is that you don’t have to create separate reports for all these channels.
That would take so much time!
Bring data from any source you have to any report and organize it in logical sections or tabs. And every integration refreshes automatically so you only need to send one report for each client.
Stable and reliable
Some reporting tools on the market offer a huge number of third-party data connectors. The stability and performance of data flow come in second.
Having more data connectors is great. But it’s also important that these connections are stable and reliable.
This means that they won’t break off in the middle of a client demo call or half an hour before the client’s internal meeting, making the report unusable until you resolve the problem.
Apart from differences in connection speed, which may vary between individual vendors, there are other issues, such as
- API limitations and changes
- Data compatibility issues
- Rate limits
- Authentication problems
- Network and latency issues
On the other hand, all Whatagraph integrations are developed and managed in-house by our dedicated Engineering team. There’s nothing to set up on your side.
Our integrations are pretty much plug-and-play connectors that pull data automatically from your platform accounts reliably and accurately.
You can also create a blend of different sources with custom metrics and dimensions. Add this blend as a source to your template — alongside any other “regular” data sources.
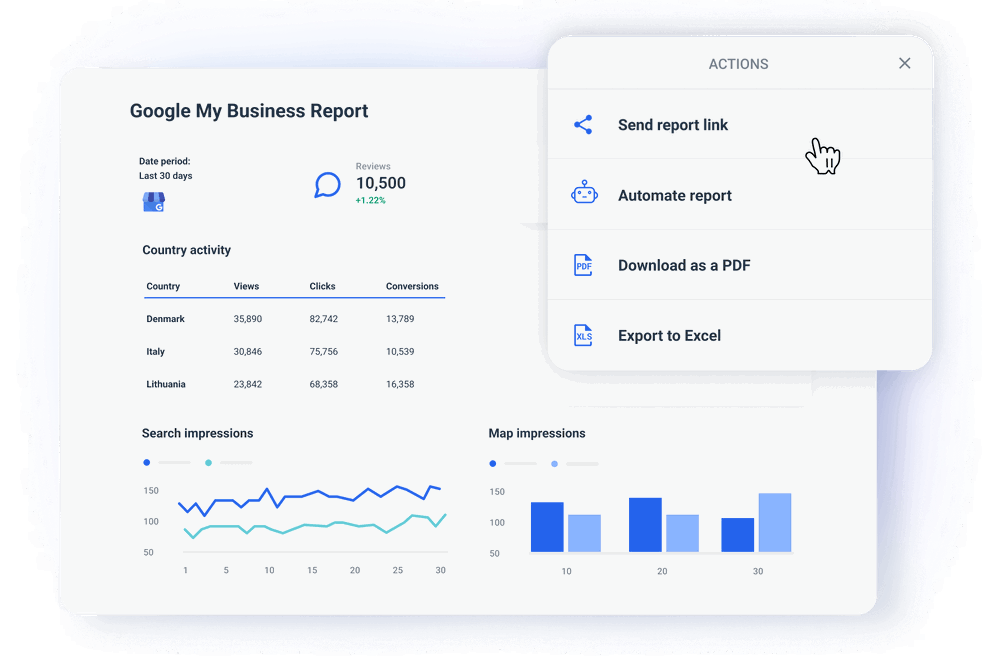
Saves time on creating and sending reports
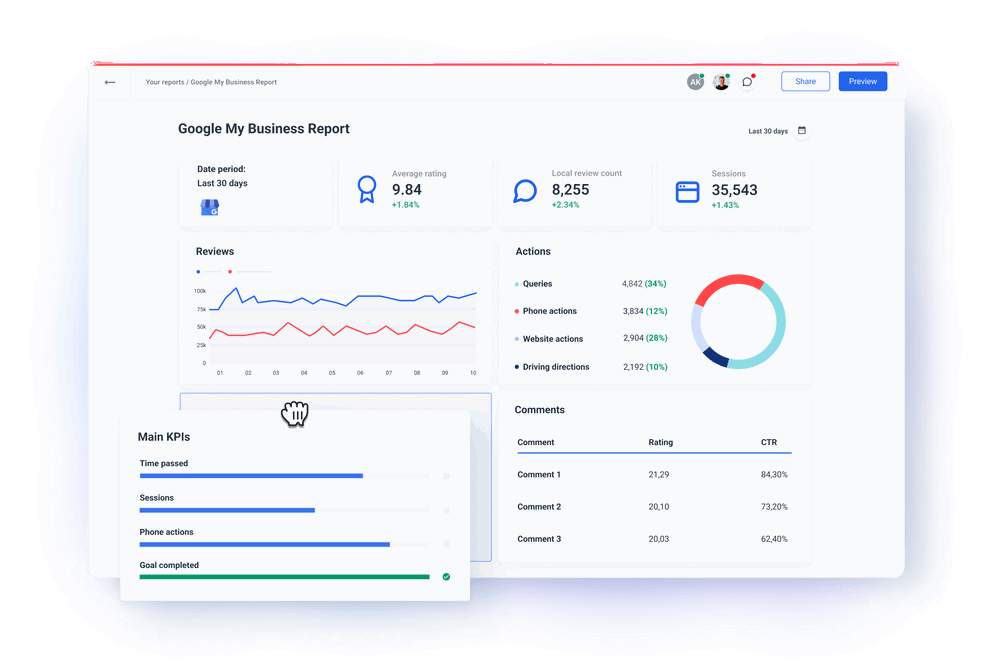
Create a well-formatted report with charts and tables, goal tracking widgets and visuals of ad images or social posts — all in several minutes.
Whatagraph has pre-made graphs, tables, and other widgets for every integration. Just drag and drop it on the report page.
You can save and reuse almost anything you create as a template — whether it’s a calculation, filter, widget, or a whole report.
Dedicated customer support
Whatagraph is easy to use but also extremely flexible, so you can create any kind of report, data blend, or BigQuery data transfer.
However, if you get stuck in your creativity, our dedicated customer success team is here to jump in.
Reach out to our customer success specialists who know Whatagraph like the back of their hand.
Talk to us via live chat on our website or email and our customer success specialists will get back to you in minutes.
Once you start using our GMB reporting tool, you’ll be assigned a personalized onboarding and a dedicated manager—included on all pricing plans.
How to Create a Google My Business Report with Whatagraph?
Creating your first GMB report with Whatagraph is quick and straightforward:
1. Go to the Sources page of Whatagraph and connect your GMB account.
2. Move to the Report page of Whatagraph and click + New Report. From there, you can choose whether to use a pre-made template from our library or start from a blank page.
3. Click + Add New in the Sources tab on the sidebar to connect your GMB source.
4. Tailor the new report/template to your client's needs.
5. Share the report via scheduled email or live link.
What Google My Business Metrics Should You Track?
The exact combination of metrics to include in your GMB client report depends on their specific KPIs. However, there are some metrics that every GMB report should cover:
- Search impressions: Show how often your business listing appears in local search results. They can come from direct searches, discovery searches, and branded searches
- Customer actions: Track what actions potential customers take after viewing your GMB listing. They include website clicks, phone calls, direction requests.
- Customer reviews and ratings: Both are critical for building trust and improving your search rankings. You should track review count, average star rating, sentiment analysis.
- Search queries: Tell you which keywords or phrases users are typing into Google to find your business. This includes top search terms and keyword trends (how search terms evolve over time).
- Photo views: Track how many times your business photos have been viewed by users and how many potential customers viewed your customer photos.
- GMB posts engagement: You should regularly post updates, offers, or promotions on your GMB profile and track post views and post clicks.
How to Get the Most of a Google My Business Reporting Tool?
Whatagraph can provide valuable insights into how your business performs in local search results, but to fully capitalize on its capabilities, you need to use it strategically.
Here are the key ways to get the most out of your Google My Business reporting tool:
Step 1: Tailor the reports for your client’s needs
Always customize the report based on the specific needs of your clients. Focus on key performance metrics such as:
- Search visibility: Highlight how often your business appears in Google Search and Maps results.
- Customer actions: Track clicks to your website, phone calls, and direction requests.
- Review performance: Monitor your reviews and ratings over time.
Personalization ensures that you're only tracking metrics relevant to your client’s goals. This way, you can focus on performance areas that matter. This is especially important if you add data points from other channels to your local search report.
Step 2: Provide context and actionable insights
Don’t just present raw data — provide context and actionable recommendations.
Whatagraph gives you an easy way to provide more context with text widgets you can fit anywhere in your report. By offering insights and next steps, you place yourself as a trusted advisor and not just a service provider.
“Being proactive in suggesting optimizations and new strategies shows that the agency is committed to continuous improvement and delivering long-term value. We call that "advisory value" and we believe it is what separates us from other commoditized agencies.”
Dylan Hey - CEO @ Hey Digital
Step 3: Combine GMB data with other marketing metrics
To get a full view of your local SEO performance, integrate GMB data with other platforms such as:
- Google Analytics 4: To see how GMB-driven traffic interacts with your website.
- Google Ads: To measure the impact of local advertising campaigns.
- Social media and reviews: To combine insights from GMB with other channels to see how they contribute to overall visibility and customer engagement.
Combining GMB data with other metrics helps you understand the full scope of your marketing efforts. This not only saves you time on creating reports, but also makes it easier to discover patterns and opportunities for improvement.
Step 4: Optimize content according to search queries
You should tweak your GMB reporting tool to track which search queries are driving traffic to your listing. Use this data to:
- Optimize your GMB profile: Adjust your business description, services, and posts to better match high-traffic search terms.
- Target new keywords: Spot popular queries and include those keywords in your GMB and overall SEO strategy.
Tracking search queries allows you to optimize your client’s GMB profile to be more visible and relevant in local searches.
Step 5: Keep an eye on reviews
Make sure to include detailed insights into reviews in your GMB report. This makes it easier for your clients to:
- Respond promptly to feedback: Engaging with positive and negative reviews shows responsiveness and improves their brand image.
- Analyze review trends: Identifying patterns in customer feedback helps businesses investigate and fix service or product issues and improve customer experience.
Addressing positive and negative reviews on time improves customer satisfaction. This, in return, helps companies keep a strong online reputation, which also improves their local SEO rankings.