9 Best Supermetrics Alternatives & Competitors to Try in 2026
Supermetrics is a powerful data moving tool, but it can be expensive, buggy, and difficult to use. If you’re looking for Supermetrics alternatives, fear not, we’re here to help.
In this article, we’ll take you through:
- The shortcomings of Supermetrics
- 9 best Supermetrics alternatives
- Key features and pricing of each tool

Oct 10 2024●8 min read


Supermetrics is great for moving your data from different platforms to databases, but it’s far from perfect. Users online say it’s:
❌ Expensive: Supermetrics’ pricing is based on the number of data sources, users, teams, and accounts (which can quickly become confusing). There are also multiple pricing combinations (e.g. Supermetrics + Looker Studio) and you’ll need to purchase add-ons for extra users and data sources. If you need a complete data solution, it can cost you 1000s of dollars a month.
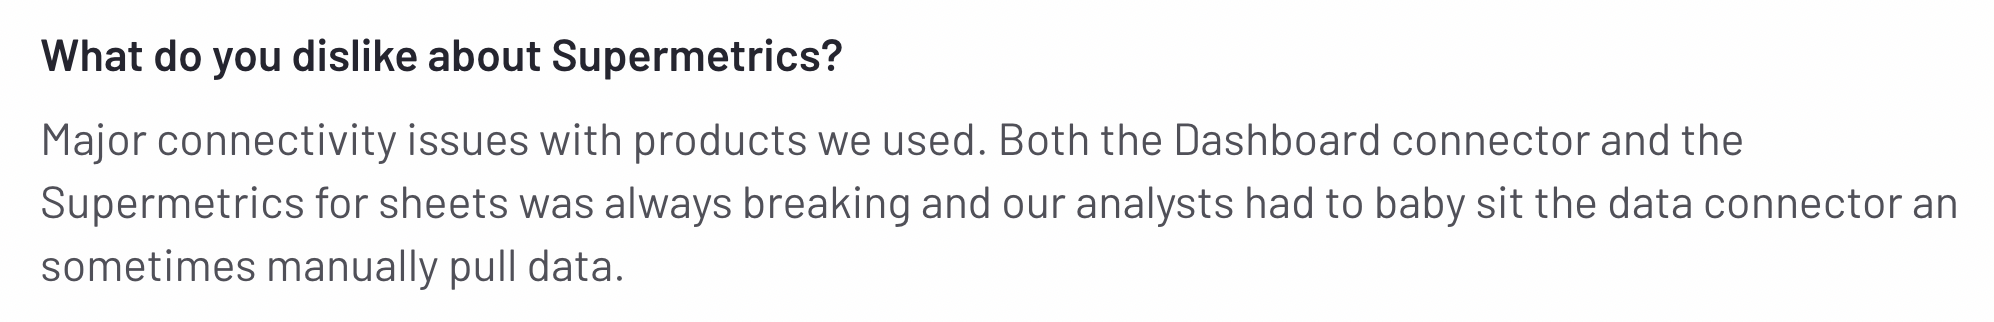
❌ Buggy: Many users report bugs, inconsistencies, and connectivity problems when pulling data from platforms like Facebook. They also complain about failed scheduled queries which forces manual data extraction, wasting more time.
❌ Poor customer support: Supermetrics rely heavily on AI chatbots which “closes out” the chats before resolving issues. And even those users who are paying extra for “Premium Support” find it difficult to get in touch with a human representative. If you've experienced this first hand before, you know how frustrating it can be to not get the help you need.
❌ Difficult to use: Supermetrics comes with a steep learning curve, especially for non-tech savvy marketers and team members. Most had to hire a data scientist to maintain data pipelines.
❌ Limited: Supermetrics is purely a “data-moving” tool—there are no built-in visualizations available. You’ll need to ship your data to a third-party tool like Tableau or Looker Studio, which creates more problems than it solves.
___
Sounds like a lot? That’s what we’re here for.
In this article, we’ll take you through 9 best Supermetrics alternatives and competitors that are easier to use, more cost-effective, and come with great customer support.
9 Best Supermetrics Alternatives and Competitors in 2025
In a nutshell, here are the 9 best Supermetrics alternatives and competitors we’ll review in this article:
- Whatagraph
- Metrics Watch
- Funnel.io
- Power My Analytics
- DashThis
- Klipfolio
- Adverity
- Improvado
- FiveTran
Don’t want to read through walls of text? Here’s a summary table:
| Features |
|

|
|

|

|

|

|

|

|
|---|---|---|---|---|---|---|---|---|---|
| Ease of Use | Easy | Easy | Medium | Medium | Easy | Hard | Medium | Medium | Medium |
| No. of out-of-the-box Data Connectors | 55+ | 12 | 500+ | 40+ | 34+ | 130+ | 600+ | 500+ | 400+ |
| Custom API Access |
|
|
|
|
|
|
|
|
|
| Data Blending |
|
|
|
|
|
|
|
|
|
| Custom Metrics and Dimensions |
|
|
|
|
|
|
|
|
|
| Custom Reports and Dashboards |
|
|
|
|
|
|
|
|
|
| Campaign Overview and Monitoring |
|
|
|
|
|
|
|
|
|
| White-labeling |
|
|
|
|
|
|
|
|
|
| Data Update Frequency | Every 30 mins across all integrations and pricing plans | Not live dashboards, just email reports | Depends on the data source | Once a day or manual refresh for live data | Once a day or on-demand update | Depends on your pricing plan, from 4 hours to 30 minutes | Default is once every day but you can schedule "fetches" to be more frequent | Depends on the pricing plan--twice daily, four times daily, or custom | Depends on the pricing plan and data source, from 15 mins max to 1 min max. Default is 6 hours. |
| Data Segmentation and Filtering |
|
|
|
|
Only for select data sources |
|
|
|
|
| Alerts and Notifications |
|
|
|
|
|
|
|
|
|
| Multi-Client Management |
|
|
|
|
|
|
|
|
|
| User Management | Admin, Manager, or Editor roles |
|
|
Editor or Owner | Every user of the same account are considered "Admins" | Account Administrator, Klip Viewer, Klip Editor | Workspace admin, Dashboards, Explore, Manage, Shared dashboard viewer + custom roles | Viewer, Editor, Workspace admin, Data manager, Data load manager, Data analyst | Account administrator, analyst, billing, reviewer + custom roles |
| Automated Report Sharing |
|
|
|
|
|
|
|
|
|
| Data Export | PDF, XLS, CSV |
|
JSON, CSV | CSV, JSON | PDF only | Export dashboards as PDF or image files. Export only individual Klips as CSV | Export the data from a table widget as CSV, Excel, ODS, PDF (or) Export a dashboard as PNG, JPG, PDF, ZIP, PPTX, XLSX | JSON | |
| AI Insights |
|
|
|
|
|
|
|
|
|
| Customer Support | Live chat, email, Help Center for all pricing plans | Knowledge base, Live chat | Email, In-app messages, Help center | Email, Phone, and Knowledge base | Email, Help Center for all pricing plans | Email, Help Center | 24-hr Help desk, Help center, video guides | Service desks to raise requests, Help center, Email | 24/7 email support, Support portal, Help center |
| Dedicated Customer Success Manager |
|
|
|
|
|
|
|
|
|
| Data Security and Compliance | ISO 27001, Enterprise SSO, GDPR compliant, AES-256 encryption, Two-factor authentication, AWS hosted servers | SSL encryption | ISO 27001 certified, GDPR and CCPA compliant, SOC 2 Type II | ISO 27001, GDRP compliant, Data encryption using TLS, IAM – OTP/TOTP methods | Encrypted URLs, Password protection, Restrict IP addresses, GDPR compliant | AWS hosted servers, 2048-bit RSA key access for servers, no passwords, SSL, RBAC | Two-factor authentication, SSO, ISO-27001 certified, SOC 2 Type 2 audited, Fully protected API connections using SSL/TLS protocols, GDPR compliant | SOC 2 Type II, HIPAA compliant, GDPR and CCPA compliant, SSO | SOC 1 & SOC 2, GDPR compliant, HIPAA BAA, ISO 27001, PCI DSS LEVEL 1, HITRUST, SSO |
|
Pricing
(with $$$ being the highest)
|
$$ | $ | $$ | $ | $ | $$ | $$ | $$ | $$ |
Let’s dive into each of these tools.
1. Whatagraph
Most suitable for: Medium to large marketing agencies with 10+ employees
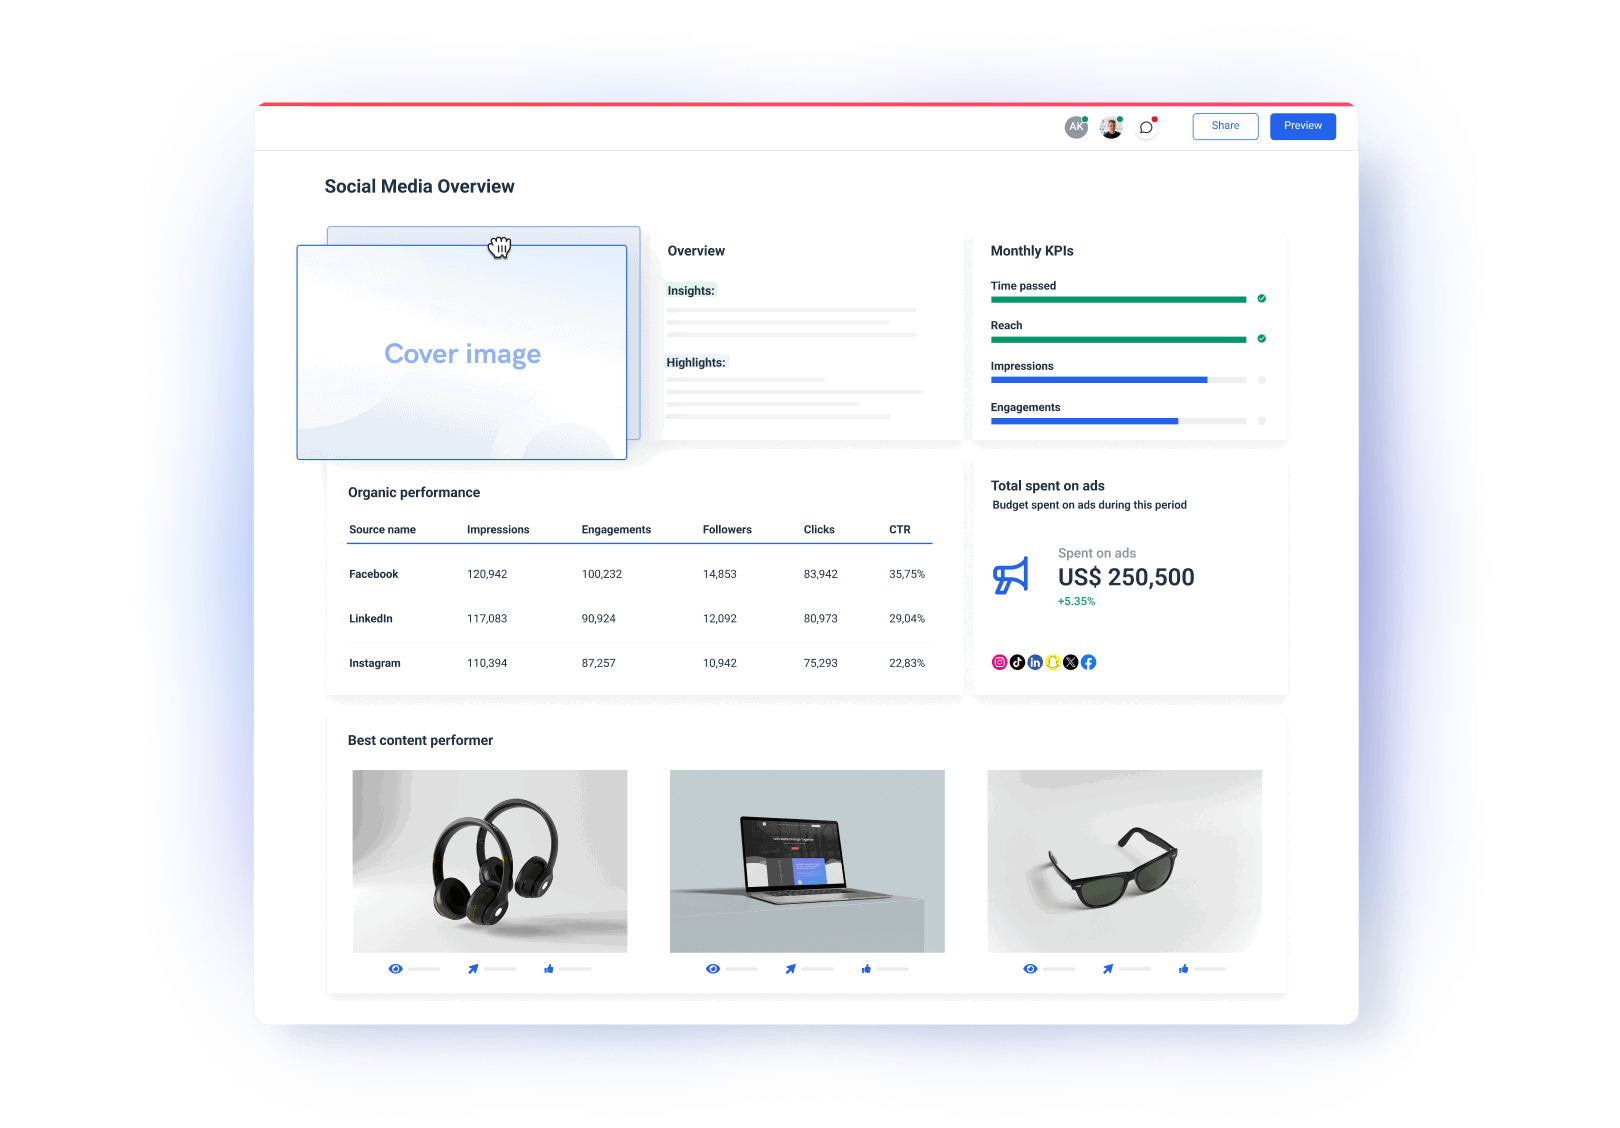
Whatagraph is the best Supermetrics alternative in 2024 (and beyond). It's an all-in-one marketing data platform that makes it ridiculously easy to collect, monitor, and report on your marketing data.
It’s the only tool on our list that covers the entire data journey on one platform—from data connections and transformations to visualizations and data transfers.
In a nutshell, here’s how it works:
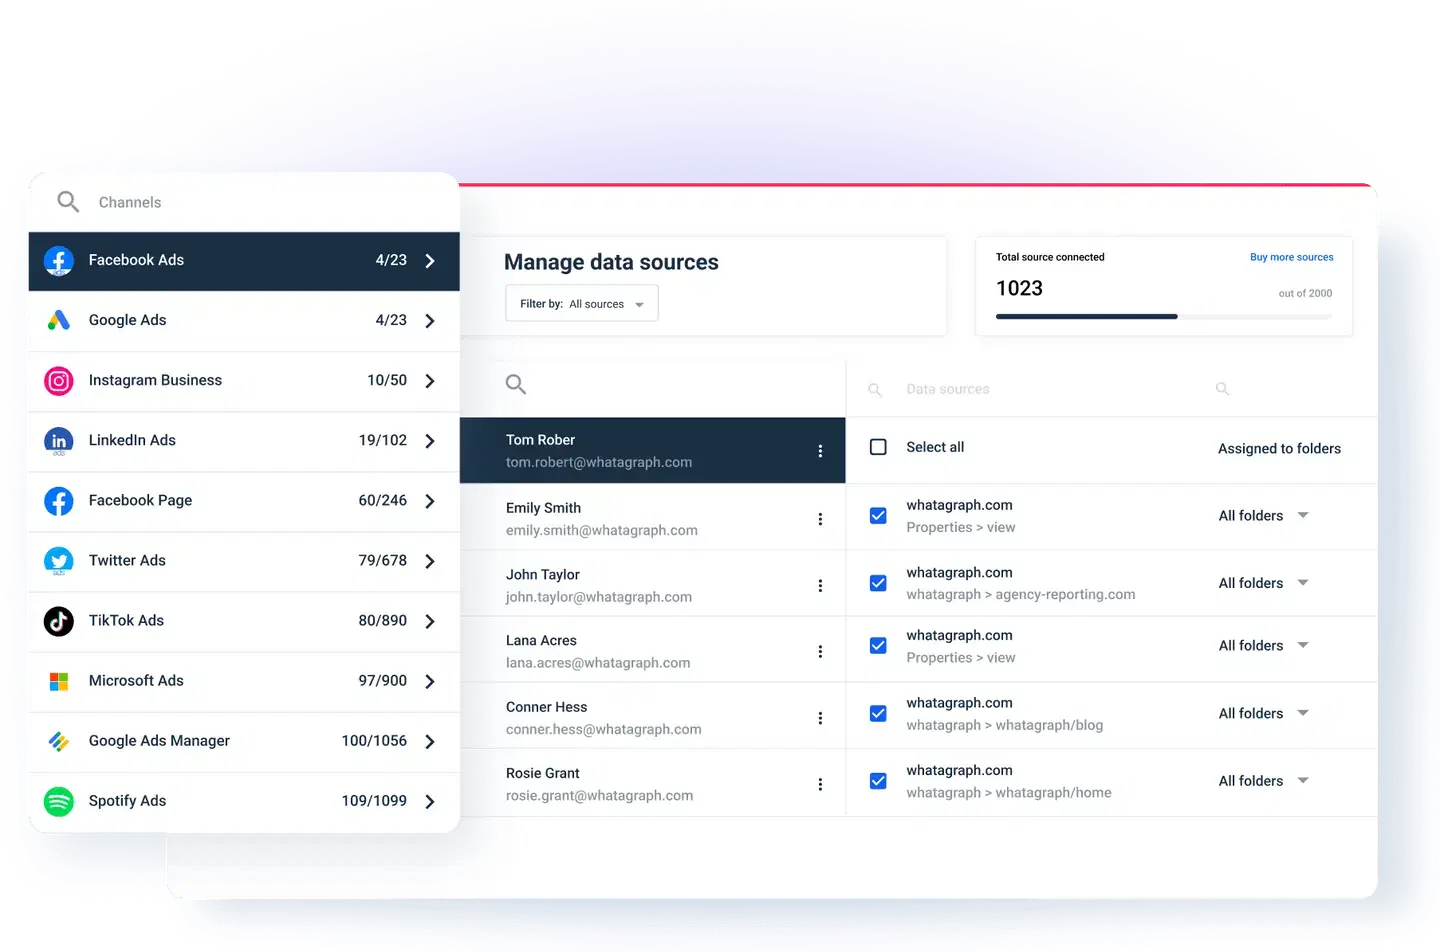
- Data collection. Connect to your data sources and channels in a few clicks. Your data will flow in automatically.
- Data management. Organize your data, teams, clients, locations, and currencies on one platform.
- Data transformation. Organize and unify your data to be analysis-ready. Make custom metrics and dimensions, and blend data sources together without writing a single line of code. Whatagraph also converts one currency to another automatically on your dashboards.
- Data visualization. Visualize your transformed data using drag-and-drop widgets or ready-made templates. Create white-labeled reports with custom logos, domains, and color schemes. No need to export your data to another visualization or BI tool.
- Data sharing. Share reports as live links, PDFs, Excel spreadsheets, or automated emails. You can also transfer your data to BigQuery through Whatagraph.
Plus, if you ever need help, you can reach out instantly to our human Customer Support team through the live chat on our website. We respond within 3 minutes and resolve issues within 24 hours.
But how does Whatagraph compare against Supermetrics exactly? Let’s take a look:
Whatagraph vs. Supermetrics: Head-to-Head Comparison
Our team did extensive research on how Whatagraph compares against Supermetrics and you can find the full breakdown here.
In a nutshell, here are four key ways Whatagraph outperforms Supermetrics:
1. Stable, reliable, and all-in-one platform

Supermetrics is, what I like to call it, the “middleman” of data.
It pulls your data from marketing platforms like Google Analytics 4, Google Ads, Shopify, etc., and ships this data to more third-party tools like Looker Studio, spreadsheets, or data warehouses.
But when your data has to flow from [X platform] → Supermetrics → [Y platform], there are higher chances of data inconsistencies, bugs, and connection issues.
In fact, that’s one of the complaints we see the most about Supermetrics online. Here’s what one user said on G2.com:
Whatagraph, in contrast, removes this middleman.
From connecting to your data sources, to cleaning it up, to visualizing and sharing it, Whatagraph takes care of your entire data journey. This means:
- There are less chances of data inconsistencies, connection issues, or breakages.
- Your data is safe, secure, and organized on one platform.
- You don’t need to jump from one platform to another.
- You don’t need to learn how to use new tools.
Plus, the integrations we provide at Whatagraph are fully-managed. This means they’re more seamless, stable, and reliable.
And our Product engineers regularly maintain these integrations so you don’t have to.
Fully-managed integrations also mean if there are bugs, we can resolve them quickly without having a third-party company involved.
Our current users love how seamless, stable, and simple the data connection process is. Here’s what one of them said on G2.com:

2. Easier to use
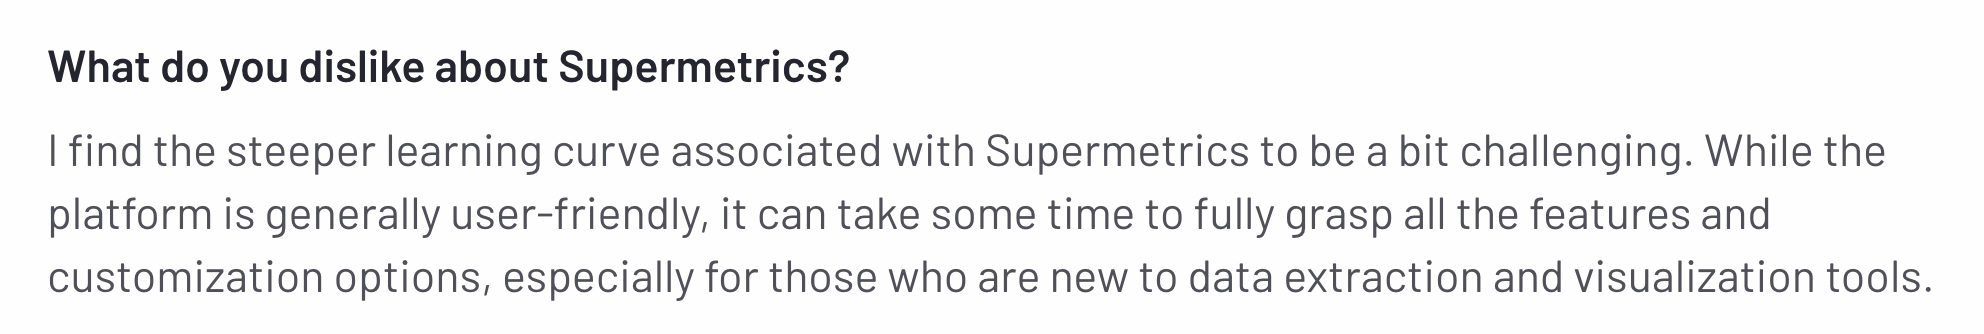
Supermetrics offers a lot of advanced features (like queries, data pivoting, pagination, etc.) which makes it a more suitable tool for data analysts with more complex use cases.
For the average marketer or a business owner, it can take weeks and long training sessions to fully grasp all the features available, and actually start using them correctly.
Here’s what one user said on G2.com:
But that’s not all.
There’s an added layer of complexity from third-party visualization tools like Looker Studio that you need to use together with Supermetrics.
Looker Studio is slow, clunky, and incredibly difficult to use for non tech-savvy users, taking you anywhere from 1-3 hours to create a performance report from scratch.
Most of the ex-Loker Studio users we’ve talked to also say they needed to hire a data scientist to edit and maintain these reports.
In contrast, we built Whatagraph to be incredibly easy and simple.
Thanks to plug-and-play integrations and a no-code interface, you can get Whatagraph up and running in a few hours, not days or weeks.
All you need to do is:
- Choose a channel from a menu bar.
- Connect your account.
- Connect your data source.
Once your data has flown into the platform, you can visualize it easily in three ways:
- Use one of our ready-made report templates or dashboard examples.
- Start from a blank page and use our drag-and-drop widgets to add metrics onto the dashboard.
- Use our Smart Builder to instantly create dashboards for your favorite marketing channels (e.g. Google Analytics 4, Google Ads).
Want to blend data sources together or make new metrics and dimensions? You can do it via a simple workflow on Whatagraph.
For instance, say you want to report on the total number of “Add to Cart” from both Facebook Ads and TikTok Ads. You can set up a custom metric on Whatagraph, like so:
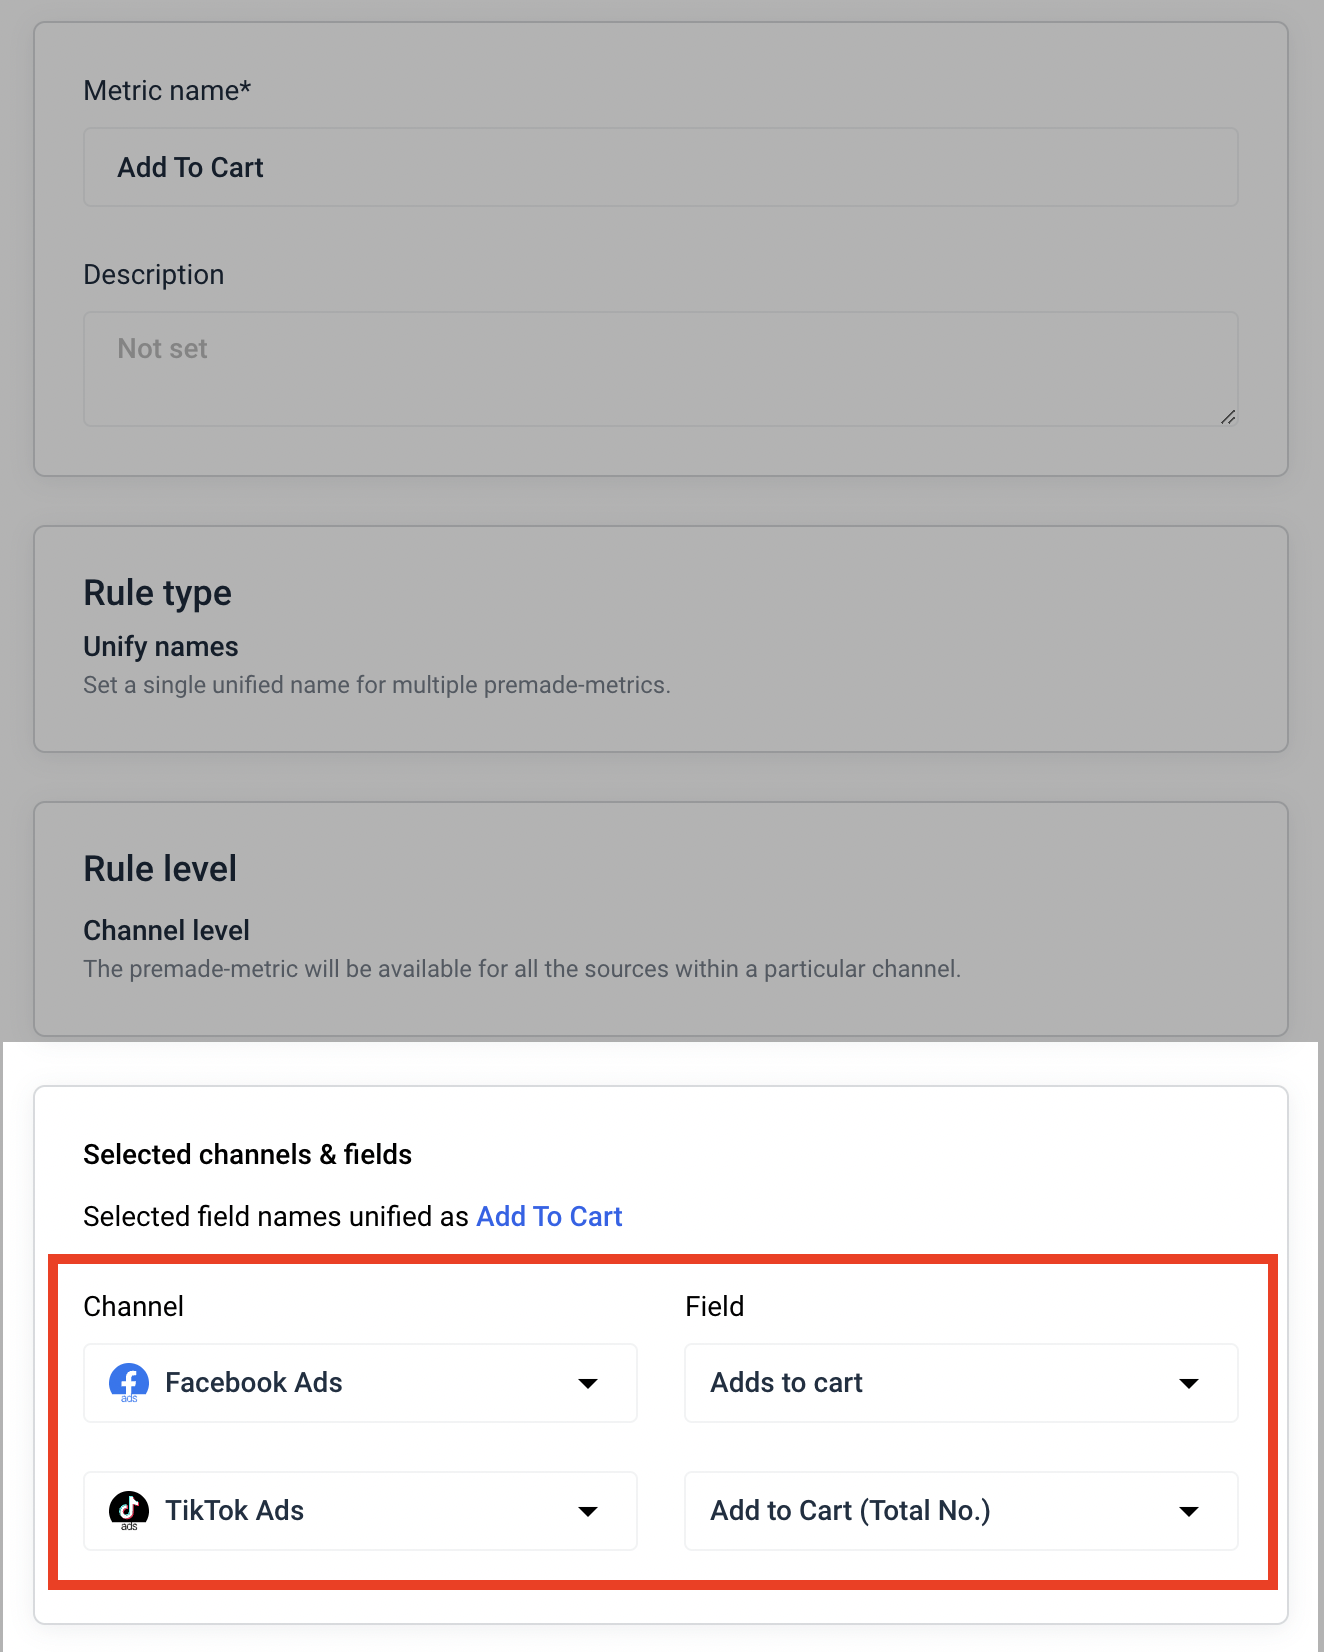
You can then visualize your new metric, dimension, or source instantly on your marketing reports and dashboards. On Supermetrics, you’ll need to manually refresh each report where custom data is used.
Adjust the rules and data blends on Whatagraph without leaving the report you’re building. With Supermetrics, however, you’ll need to switch back and forth between the platform and your data visualization tool.
Thanks to this simple and intuitive interface, “Ease of use” is our biggest pro on G2.com, and one user raved:
3. Get white-labeled reports on one dashboard
White-labeling is key for agencies who need their client-facing reports to look professional and personalized.
However, Supemetrics does not allow you to white-label reports on the platform. It also doesn’t support exporting capabilities, like sharing links or downloading PDFs, natively.
Most users have to rely on third-party visualization tools like Looker Studio for this.
But designing your reports on Looker Studio can take you anywhere from 30 minutes to an hour—and that doesn’t include the actual data visualization part.
On Whatagraph, you can get white-labeled reports in minutes, and on one platform. You can:
- Upload your logo or your client’s logo
- Create custom color schemes
- Add footer and header texts
- Create custom domains to host and share your reports
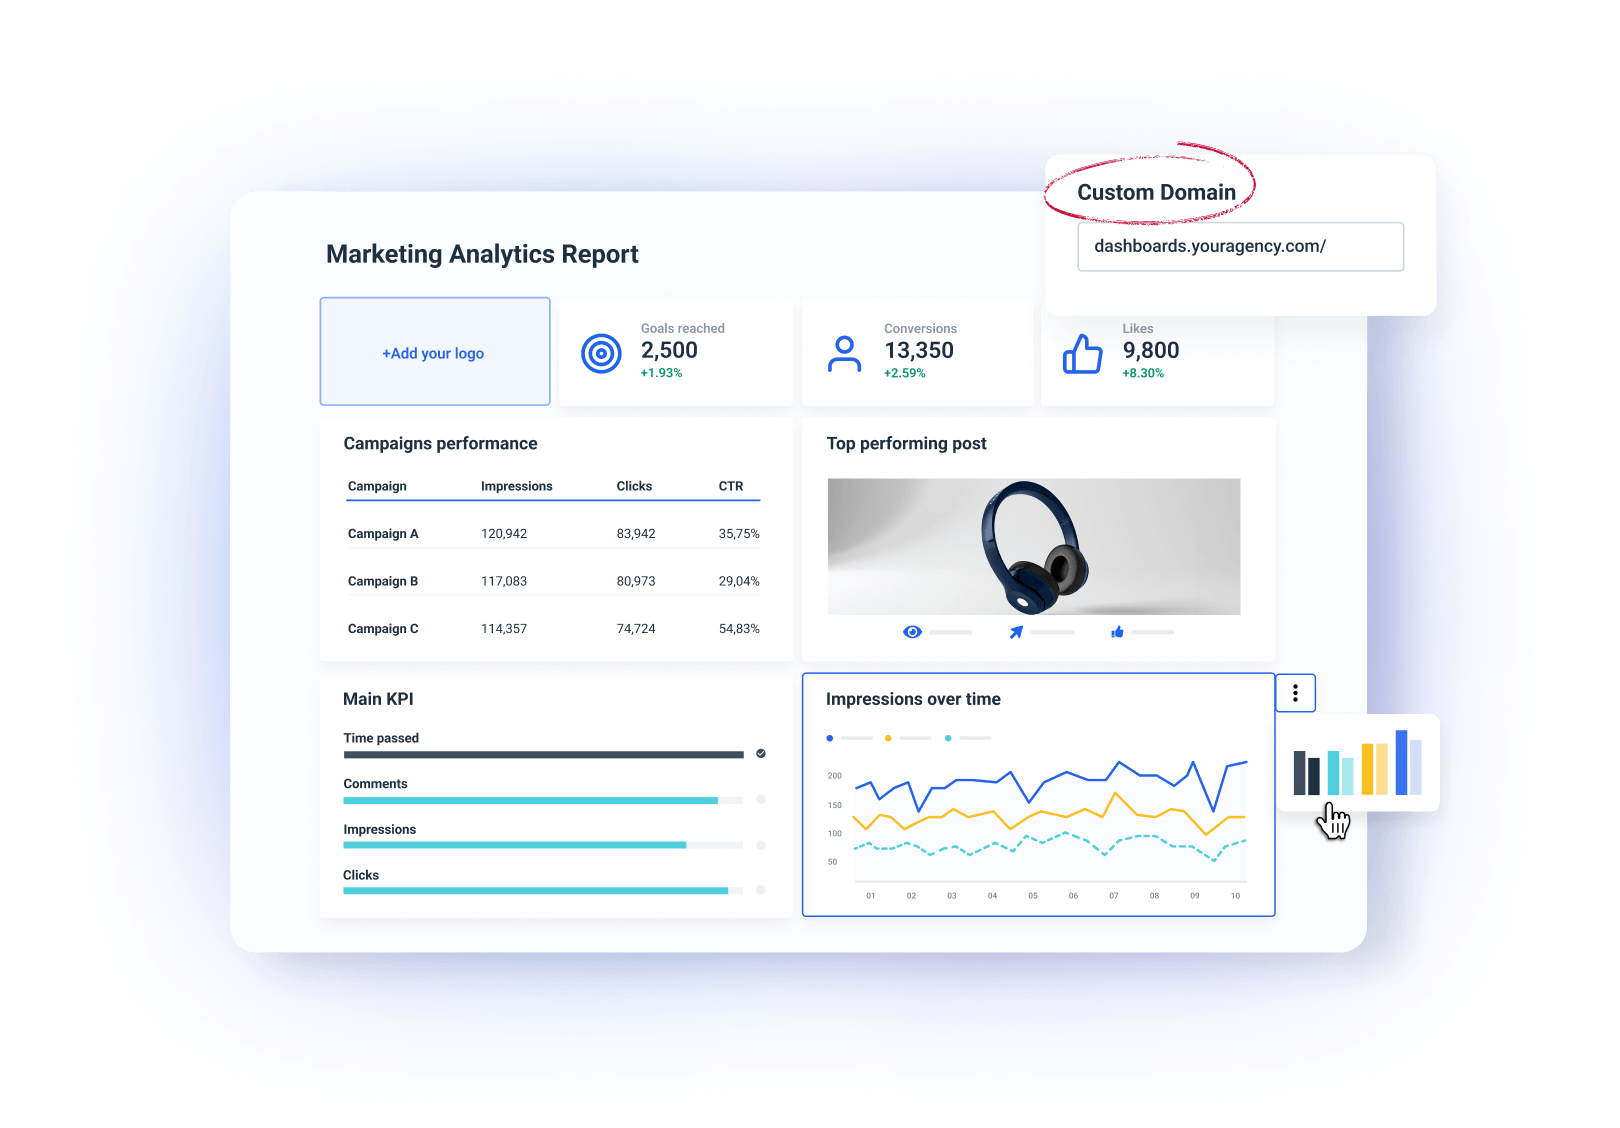
While Looker Studio’s reports look like glorified spreadsheets, Whatagraph’s look organized, sleek, and professional.
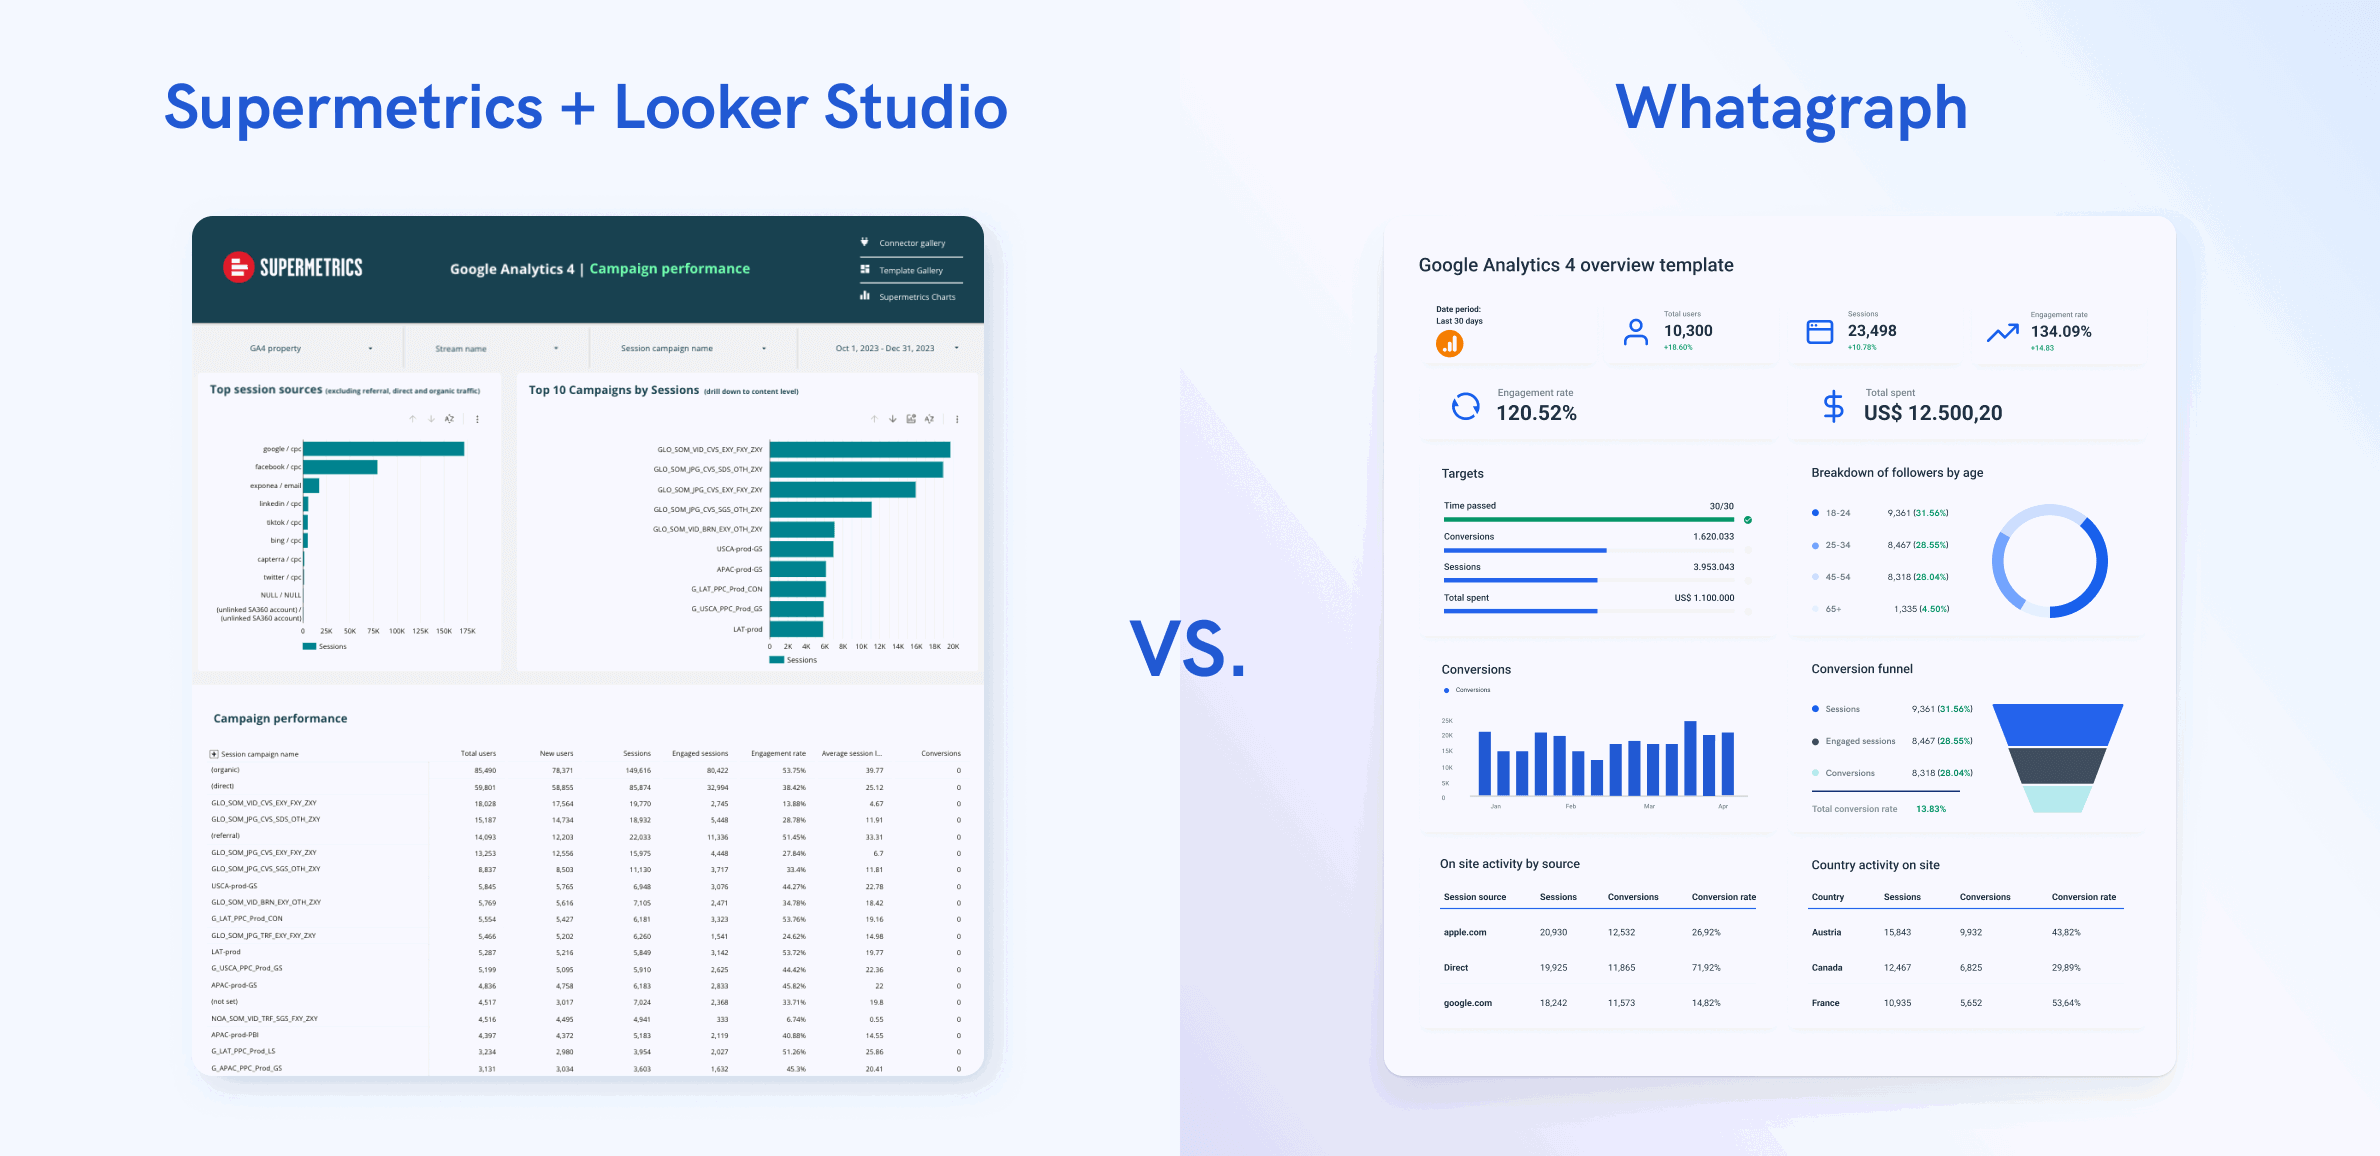
Here’s a side-by-side comparison of how a Google Analytics 4 report looks like on Supermetrics + Looker Studio vs. on Whatagraph:
And you can automate the report sharing process on Whatagraph too. You can either:
- Set up automated emails to specific people at specific times, days, and cadence. Customize the email subject lines and copy.
- Send instant live links to anyone.
- Download PDFs or Excel spreadsheets.
- Transfer your data to BigQuery.
All of this on one platform not only saves you massive time, but also reduces your cognitive load on having to switch between one tool to another. And gorgeous white-labeled reports are just an added bonus!
4. Straightforward pricing, and more cost-effective
Supermetrics is notorious for their complex and volatile pricing.
You’ll need to pay for each destination you want to move your data to and there are many add-ons involved: extra seats, integrations outside your normal package, and more.
For instance, say you want to move your data to both Looker Studio and BigQuery. You’ll need to buy two separate packages, one for each.
Supermetrics doesn’t share their pricing for BigQuery publicly, but here’s the pricing for Looker Studio:
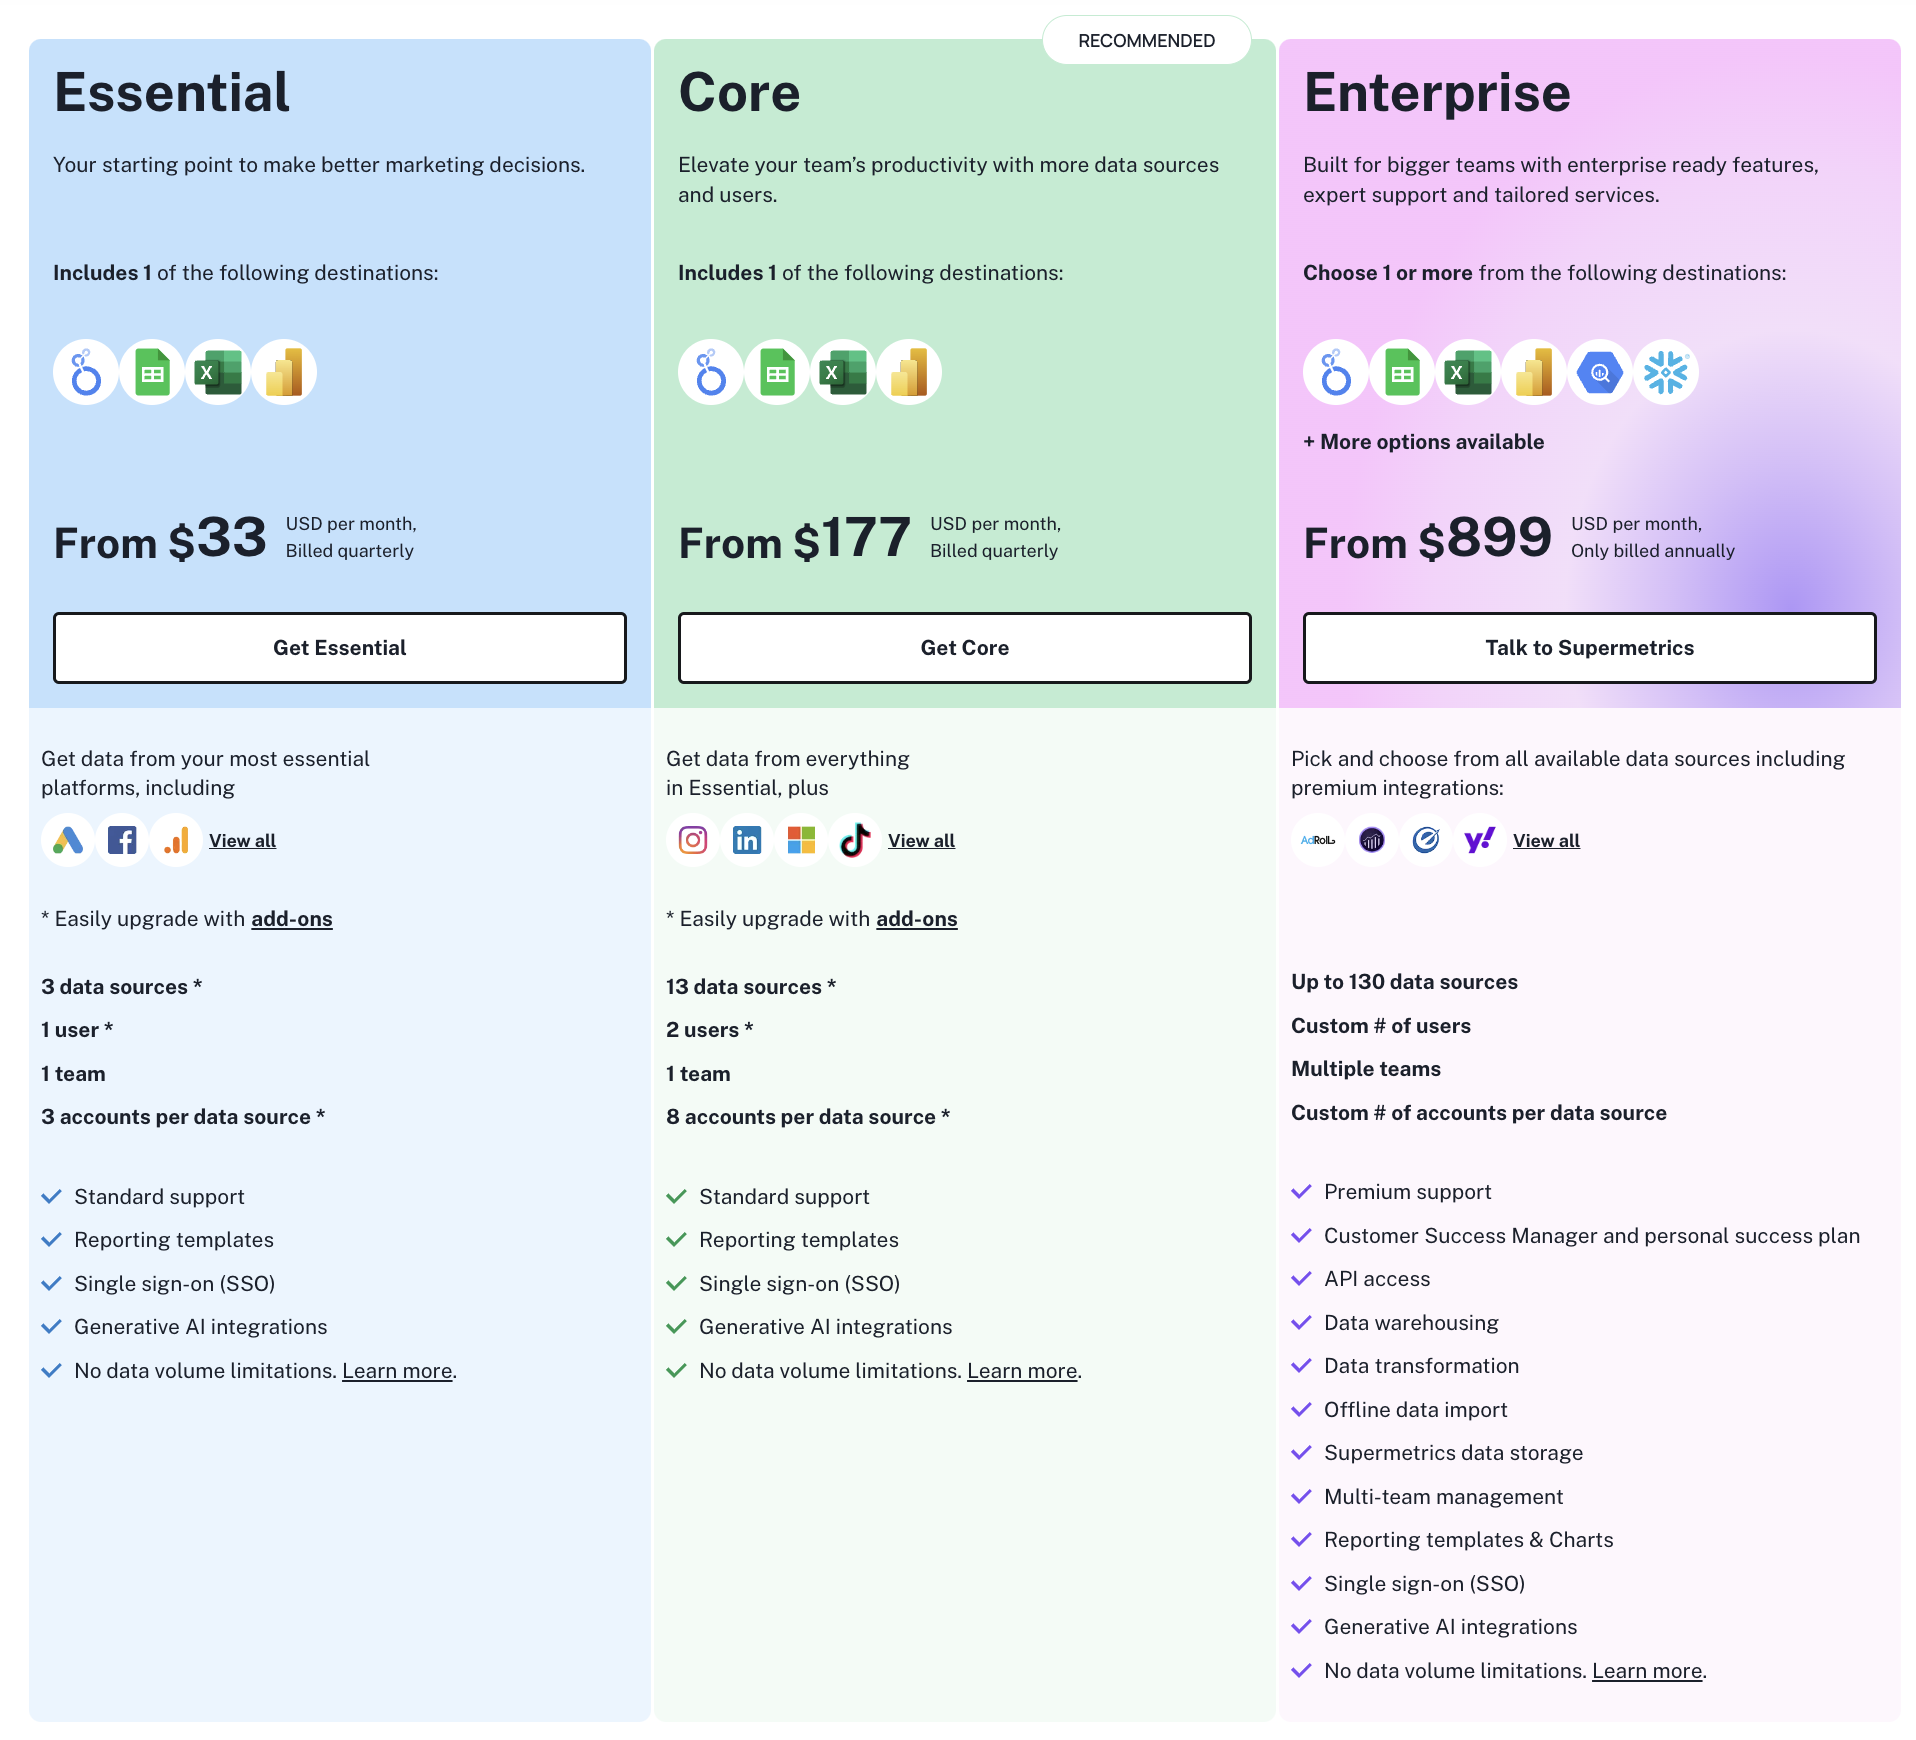
You can see that the “Essential” and “Core” packages are quite limited (only up to 13 data sources and 2 users). They’re not viable options if you’re a marketing agency and you have dozens of client’s data sources to connect to.
Also, if you want “Premium support”, you’ll need to opt for the “Enterprise” package, which starts from $899/month. This doesn’t include the price for BigQuery which can be another thousand dollars.
Here’s what one user said on G2.com:

Supermetrics’ pricing also fluctuates a lot—in fact, they changed their pricing twice in 2024—and users say the price has increased significantly over the years.
This volatility can be frustrating especially if you’re a marketing agency that needs to predict and control costs to be profitable.
On the other hand, Whatagraph’s pricing is straightforward. All our plans include:
- All native integrations
- Custom APIs
- Unlimited data blends, custom metrics, and dimensions
- Unlimited dashboards and reports
- BigQuery transfer
This is not only more efficient for agencies covering lots of platforms, but it’s also more cost-effective.
We also believe that Customer Success is a must-have, not an add-on. All our plans come with a dedicated Customer Success Manager + Customer Support.
Your CSM will help you with:
- Connecting to channels and data sources
- Blending sources
- Making custom metrics and dimensions
- Creating reports
- Anything else you need
And if you need urgent help, you can reach out to our Customer Support team member through live chat or email at no extra cost.
Apart from cost-savings, there are also many “softer” benefits to this straightforward, all-in-one pricing:
- You don’t have to worry about overpaying on your connectors and data sources or underutilizing them.
- You don’t need to waste time managing different plans and invoices. Just one invoice and done.
- A dedicated CSM and Customer Support means you’re truly set up for success.
Convinced that Whatagraph is the right Supermetrics alternative for you? Book a call and tell us how we can help you.
Key Features
- Native integrations to popular marketing channels
- Custom integrations through Custom API, Google Sheets, or BigQuery
- Versatile drag-and-drop widgets for reports and dashboards
- Custom metrics, dimensions, and data blends
- Currency conversions
- Library of pre-made dashboard and report templates
- Link reports to one template to edit them all at once
- Export to Excel and CSV
- Custom branding and white-label features
- Automated report sharing
- AI insights
- Links to live dashboards
- No-code data transfer to Google BigQuery data warehouse in all plans
Whatagraph Reviews from Real Users
“To me, Whatagraph is like the Tesla or Mercedes of digital analytics tools, their clean and simple way to present complex marketing data. I highly recommend it to anyone working with marketing analytics who values efficiency and clarity in their reporting.” (Source)
“Whatagraph has a simple user interface that is easy to navigate even for those who don't have analytical skills.” (Source)
“What I like best about Whatagraph is having the ability to create reports fast and easy. No more spreadsheets to do reports, they have a great variety of templates.” (Source)
Pros and Cons
Pros:
- All-in-one marketing performance monitoring and reporting solution
- Easy to use by anyone on your team
- Fast campaign performance and insights
- Stunning visual reports
- Makes results easy to interpret
- Excellent live chat customer support
Cons:
- No freemium plan
- Just one data warehouse destination (BigQuery) is available so far
Pricing
Whatagraph offers three pricing plans based on the amount of “source credits” and access to customization and data organization capabilities.
You can use source credits to connect data sources, send data from a source to a warehouse, and blend cross-channel data together.
All our plans include:
- Integrations with 45+ platforms
- Custom APIs
- Unlimited dashboards and reports
- Unlimited data blends, custom metrics, and dimensions
- White-labeling features
- A dedicated Customer Success Manager
- Customer support through live chat and email
Reach out to us for a product walkthrough and a pricing plan, just for you.
2. Metrics Watch
Most suitable for: Freelancers, small businesses, and boutique agencies
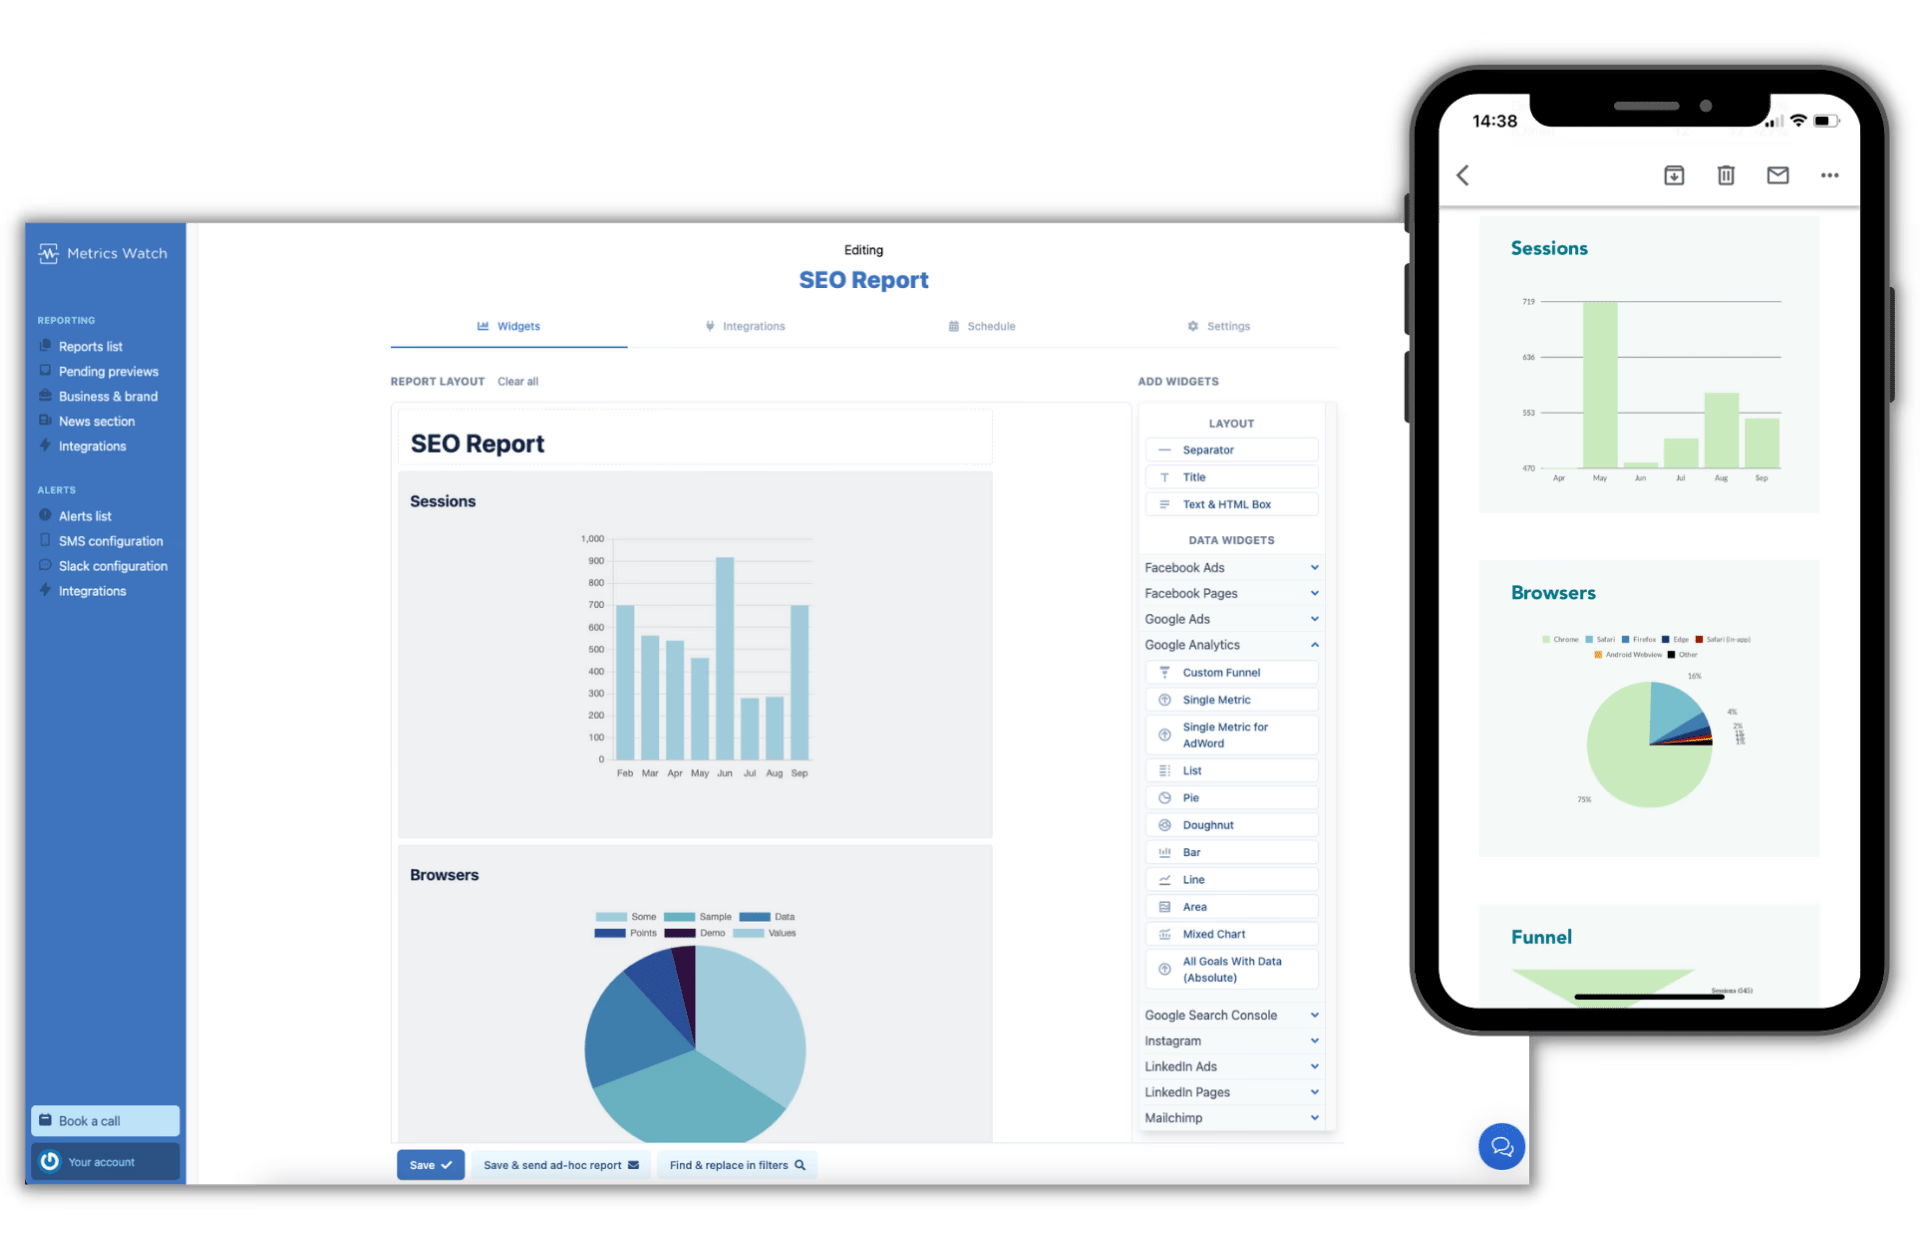
Metrics Watch is an email-based solution for sending marketing reports to team members and clients.
It pulls KPIs from popular marketing platforms like Google Search Console, LinkedIn Ads, and Mailchimp, automatically compiles the data, and sends the report directly to your recipient’s inbox.
This means you don’t need any third-party tools like Looker Studio or even PDFs. You can immediately send emails or automate them to go out on a daily, weekly, or monthly basis. There’s also the option to preview reports before they are sent.
To make your life easier, Metrics Watch also offers ready-made templates that you can get started with. You can also white-label these reports by uploading your logo, choosing color schemes, and sending reports from your name and email address.
However, Metrics Watch doesn’t offer advanced data organization features like data blends or custom metrics and dimensions (Whatagraph does). There is a very basic filter to segment your data but that’s where it ends.
Key Features
- 12 integrations
- Report templates
- White-labeling features
- API batch reporting
- Basic data filters
Metrics Watch Reviews from Real Users
“Metrics Watch helps me automate reporting for a number of clients who need data on everything from Analytics, to Ads, to performance reporting.” (Source)
“As a boutique marketing agency, MetricsWatch has served our needs and simplified our reporting so far. We might need more customization as we expand though.” (Source)
“We’d also like to see blended metrics, for example, ROAS, but for FB Ads + Google Ads.” (Source)
Pros and Cons
Pros:
- Easy to set up and easy to use
- Affordable
- Helpful customer support
Cons
- Limited integrations
- Limited customization options
- No data organization or transformation features
Pricing
As of October 2024, Metrics Watch offers these pricing plans:
- Startup: $29/month for 2 reports
- Pro: $100/month for 25 reports, white labeling, and free migration
- Agency: $300/month for 100 reports, white labeling, free migration, and advanced widgets
3. Funnel.io
Most suitable for: Enterprises with dedicated data scientist teams
Funnel.io is a data pipeline tool that pulls data from different sources, transforms it, and ships it to data warehouses, visualization tools, or spreadsheets.
Funnel boasts over 500 data connectors with major marketing platforms and CRM systems, such as Hubspot, Salesforce, DV360, and more.
If you don’t see a connector, you can also import your own data using a Google sheet, or request the Funnel team to build one for you.
Unlike Supermetrics, Funnel offers dashboards to visualize your key metrics. However, these dashboards are pretty basic and there aren’t a lot of customization or white-labeling options available (the company admits that it’s not a “Tableau or Looker Studio killer” yet).
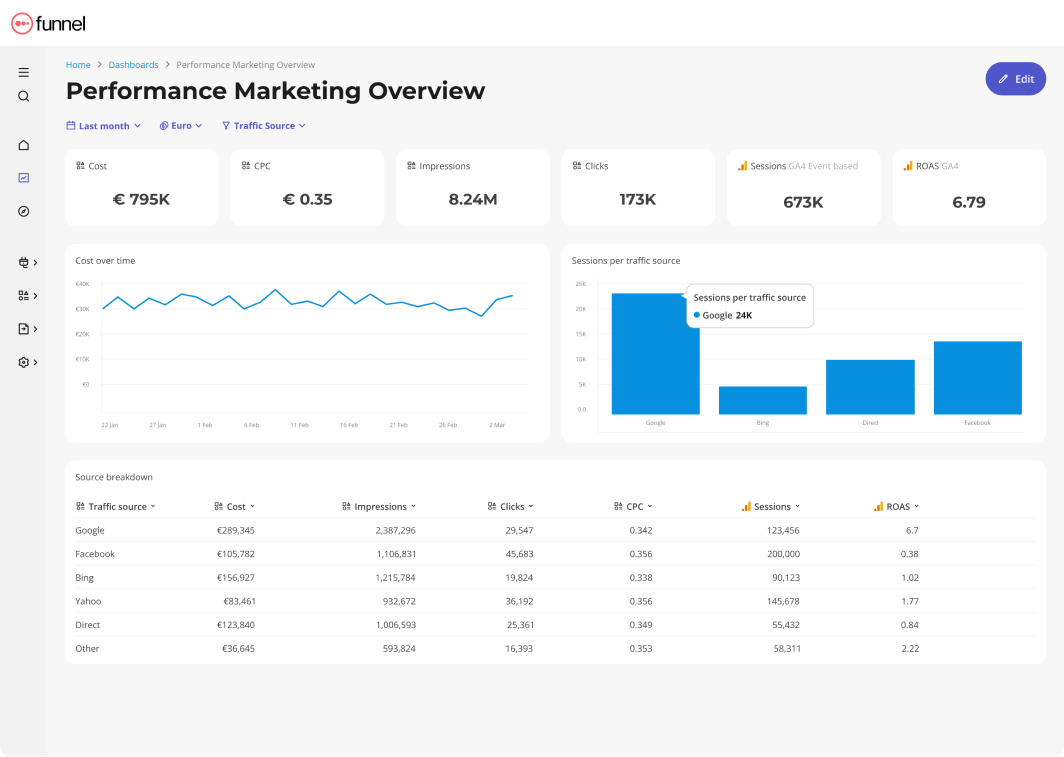
Another area where Funnel wins against Supermetrics is their Customer Support, which users say is fast, helpful, and friendly.
Key Features
- 500+ integrations
- Custom integrations or Google Sheets data import
- Custom dimensions, metrics, and currency conversions
- “Data Explorer” dashboard for data scientists
- Basic visualization dashboards to view key metrics
- Export to data destinations
Funnel Reviews from Real Users
“Funnel does the work of several people, we now couldn't run our business without it.” (Source)
“What I like most about Funnel is how customizable it is. Within their Data Explorer you can look at the data in any way please and any possible configuration.” (Source)
“Takes some time to wrap your head around, and the set up takes some time. Still some bugs in some connectors that haven't been solved after a few months.” (Source)
Pros and Cons
Pros:
- A wide range of connections with all major marketing platforms
- Low-code data organization interface
- Fast and helpful customer support team
Cons:
- Initial steep learning curve
- Occasional bugs in connectors
- Basic native visualization widgets
Pricing
Funnel.io’s pricing model is based on “flexpoints” which are usage credits to add new data connectors, transform data, and move it to destinations.
It offers three distinct pricing plans: Starter, Business, and Enterprise.
- Starter: $1.2 / flexpoint per month. This plan allows you to connect the first 3-5 sources and use 350 flexpoints* for free. It includes 121 core integrations, 3 Core destinations, and the Data Explorer.
- Business: $1.5 / flexpoint per month. Gives you everything in Starter plus 381 additional Business connectors, 37 Business destinations, data source templates, and unlimited workspaces.
- Enterprise: $2.0 / flexpoint per month. The plan designed for organizations operating at scale includes everything in Business plus 11 Enterprise connectors, 1 additional Enterprise destination (Snowflake), data region choice, and technical account management.
But if you need dozens of data sources and destinations, you can expect to pay anywhere between $1500 to $4000 per month.
4. Power My Analytics
Most suitable for: Data scientists at small businesses and boutique agencies
Power My Analytics is a data ETL tool (Extract, Transform, and Load) that brings in data from 40+ digital marketing platforms, then ships it to warehouses, visualization tools, and spreadsheets.
The main advantage of PMA over Supermetrics is that it automatically caches and “backfills” data for fast loading reports and API outage protection. This means there are less chances of connection breakages and slow load speed as is commonly seen on Supermetrics.
Users on G2.com also praise Power My Analytics for its clear, and easy to use interface. PMA is also more cost-effective than Supermetrics with plans starting as low as $15/month (for one single source).
However, while Power My Analytics comes with a “Data Explorer” dashboard, it’s more suitable for internal reporting and metric tracking, rather than for client reporting. If you’d like white-labeled reports, you’ll still need to rely on third-party tools like Looker Studio.
Key Features
- 40+ native connectors
- In-house data storage and warehousing
- Data exporting to visualization tools, warehouses, or spreadsheets
- Report templates available for Looker Studio
Power My Analytics Reviews from Real Users
“The ease of integration with PMA is so refreshing. It takes merely seconds to set up and the data is spot on.” (Source)
“Very competitive pricing. Easy implementation and integration with our dashboards.” (Source)
“There is no live chat, their email support is very active but live chat would be great for any quick support.” (Source)
Pros and Cons
Pros:
- Easy to use and set up
- Affordable pricing
- Accurate data and stable connections
Cons:
- Limited number of connectors compared to Supermetrics and Funnel
- No live chat
- Limited templates for visualization
Pricing
As of October 2024, Power My Analytics offers four pricing plans:
- Single: $14.95/month for 1 source, 1 account, and 1 admin
- Business: $39.95/month for 5 sources, 1 account, and 2 admins
- Pro: $99.95/month for unlimited sources, 20 accounts, and unlimited admins
- Enterprise: $295/month for unlimited sources, 20 accounts, and unlimited admins. Comes with your own data warehouse and dedicated representative.
You can also buy additional admin seats for $4.95/admin/month or additional locations for Google Business Profile for $0.25—$0.95 each per month.
5. DashThis
Most suitable for: Small businesses and freelancers
DashThis is a simple marketing reporting tool that connects to 30+ marketing platforms and visualizes KPIs on dashboards.
If you don’t see a built-in integration you need, you can also upload your own data using a nifty CSV file or a Google sheet.
Once your data is connected, you can visualize it using three key dashboards:
- Periodic dashboards: These are dashboards based on specific time periods and cadence, like daily, weekly, monthly, semi-annually, and annually.
- Campaign dashboards: These dashboards are used to isolate and highlight a specific campaign for a custom date range.
- Rolling dashboards: These dashboards show trends of metrics for three different date ranges.
DashThis’s main superiority above Supermetrics is its ease of use. The platform offers multiple dashboard examples which you can use to visualize your data in minutes, without having to transfer data to a third-party tool.
At $49/month for 3 dashboards, DashThis is (a lot) cheaper than Supermetrics.
However, DashThis is more suitable as a reporting tool rather than a data analytics platform. There are very few options to customize or organize your data on DashThis.
For instance, if you’re at a marketing agency and you have international clients, you might want to convert the currency of cost metrics on your reports. DashThis doesn’t allow you to do so, while Whatagraph does.
Also, you can only “merge” widgets together in DashThis; you can’t blend data sources to the full extent or create advanced metrics and dimensions. On Whatagraph, you can easily organize your data any way you’d like using simple workflows.
Key Features
- 30+ integrations
- Custom data upload via CSV file or Google sheets
- Visualization dashboards
- Automatic data refreshes
- Upload client or band logos
- Create custom widgets, domains, color schemes, and email addresses
- Library of report templates
- Report sharing via email, URL, or PDF
DashThis Reviews from Real Users
“DashThis is super user friendly. I am someone who doesn't know too much about Data Dashboards, but this platform was super easy to use.” (Source)
“There are some limitations to what you can bring in and they don't yet offer custom calculations.” (Source)
“It is a little annoying to move things around in a dashboard. You have to move each individual widget to a new section rather than moving an entire section in a dashboard.” (Source)
Pros and Cons
Pros:
- Easy to use and set up
- Many templates and dashboard examples available
- Relatively inexpensive
Cons:
- Limited data organization and customization features
- Limited data integrations
- Basic-looking reports
Pricing
As of October 2024, DashThis offers four pricing plans:
- Individual: $49/mo or $42/mo, paid yearly. Includes 3 dashboards. No white-labeling features, personalized onboarding, or priority support.
- Professional: $149/mo or $127/mo, paid yearly. Includes 10 dashboards. No personalized onboarding or priority support.
- Business: $289/mo or $246/mo, paid yearly. Includes 25 dashboards, white-labeling, personalized onboarding, and priority support.
- Standard: $449/mo or $382/mo, paid yearly. Includes 50 dashboards, white-labeling, personalized onboarding, and priority support.
6. Klipfolio
Most suitable for: Large data teams at companies and large agencies
Klipfolio is a data analytics and a business intelligence tool in one. It offers two key products:
- PowerMetrics: Suitable for data teams at large companies, this is a data analytics solution to centralize, standardize, and share accurate metrics throughout the organization. Non-data teams can then use these certified metrics for their dashboards and reporting needs.
- Klips: These are your regular data visualization dashboards and reports. Klips integrates with 130+ platforms and you can also use a Rest/URL option for custom integrations.
Klipfolio’s main advantage over Supermetrics is that it includes a built-in visualization tool (Klips) that is high in functionality. With Klips, you can:
- Pull data that's stored on premise or in the cloud, upload spreadsheets, or write custom queries
- Visualize key metrics and complex data
- Use Excel-like formulas and functions to transform your data, perform calculations, and more
- Get real-time data refresh on your dashboards
Klipfolio users online also say they like its easy user-interface.
However, Klipfolio’s pricing is on par with Supermetrics’, especially if you want a full data solution with unlimited metrics and dashboard views. You’ll also need to pay for two separate products: PowerMetrics and Klips, which can add up to thousands of dollars a month.
Key Features
- 130+ integrations including warehouses, SQL databases, and file-sharing services
- Data blending, unifying, aggregating
- Custom metrics and dimensions
- AI insights
- Custom dashboards and reports
- Export dashboards as PDF or image files. Export only individual clips as CSV
- Scheduled reports
Klipfolio Reviews from Real Users
“Klipfolio has a user-friendly interface. It can be easily connected with databases, Excel sheets, and Google sheets which makes data integration very smooth and easy.” (Source)
“I love the full range of capabilities that are possible when building a Klipfolio dashboard (specifically with their Klips product).” (Source)
“Every time I contact support I get the impression that I am bothering them. I will not be renewing this platform because I do not feel valued as a customer.” (Source)
Pros and Cons
Pros:
- Easy to use and set up
- Powerful data analytics and organization options
- AI insights to help make data-driven decisions
Cons:
- Expensive with important features only available as add-ons or in Enterprise plans
- Limited customization for dashboards and templates
- Unhelpful customer support
Pricing
Klipfolio offers three pricing plans for two of their products: PowerMetrics and Klips.
As of October 2024, here are the plans for PowerMetrics:
- 30-day free trial
- Professional: $300/month for 10 users and unlimited metrics.
- Enterprise: Custom pricing for 10 users, unlimited metrics, and priority support.
It’s also important to note that important features like data warehouse integrations, AI insights, and custom domains are only available as add-ons, unless you purchase the Enterprise plan.
Klips’ pricing is further divided into plans for businesses and for agencies.
As of October 2024, here are the plans for businesses:
- Grow: $190/month for 15 dashboards and 1 hr data refresh rate. No priority support or custom onboarding available.
- Team: $350/month for 30 dashboards and 15 min data refresh rate. No priority support or custom onboarding available.
- Team+: $690/month for 60 dashboards and up to the minute data refresh rate. Includes priority support and custom onboarding
As of October 2024, here are the plans for agencies:
- Agency Lite: $190/month for 20 dashboards, 20 clients, and 1 hr data refresh rate. No priority support or custom onboarding available.
- Agency Pro: $420/month for 40 dashboards, 40 clients, and 30-min data refresh rate. No custom onboarding available.
- Agency Premier: $1025/month for 70 dashboards, 70 clients, and 30-min data refresh rate.
On Whatagraph, you can get unlimited dashboards, unlimited clients, 30-min data refresh rate, priority support, and custom onboarding on ALL our plans. Reach out to us for a pricing plan just for you.
7. Adverity
Most suitable for: Data engineers and tech-savvy marketers
Adverity is an integrated no-code data platform that you can use to connect to various data sources, cleanse this data, and share it with destinations and teams of your choice.
It uses data connectors and API-like connectors to process any type of data or format. You can also upload custom data using spreadsheets, Excel files, .json, or .xml files.
Once the data is on the platform, you can use Adverity’s transformation engine to clean, normalize, and unify it to create a clean data stack. This data is then visualization-ready.
Adverity does come with a basic dashboard called “Data Explorer” where you can visualize your data in charts and graphs. However, you need to create every dashboard from scratch and there aren’t many customization or white-labeling options available.
Like Supermetrics, you’ll need to rely on a third-party visualization tool like Looker Studio to get custom reports.
However, unlike Supermetrics, Adverity is praised for their reliability and “outstanding” support team.
Key Features
- 600+ pre-built connectors
- Custom integrations via spreadsheets, Excel files, .json, or .xml files
- Data transfer to databases and data lakes
- AI-powered data transformation engine
- Built-in data governance
- Data Explorer dashboard
Adverity Reviews from Real Users
“Adverity has a very easy and user-friendly user interface to navigate throughout the entire system.” (Source)
“The passive destination with Google Data Studio is not helping to show the data easily.” (Source)
“The one thing that I don't like about the Adverity is that it has less documentation which most of the time causing confusion about how to use the Adverity.” (Source)
Pros and Cons
Pros:
- No-code ETL transfers
- Predefined data transformation
- A large number of sources and destinations
Cons:
- Difficulty to use and set up
- Basic dashboards and reports
- Even the basic pricing may be too expensive
Pricing
Adverity’s pricing is hidden behind a “Contact Us” wall, but as of 2022, the company said their pricing starts from 1500 Euros a month.
Test use cases we’ve run at Whatagraph show Adverity is at least 50% to 60% more expensive than us, while not including visualization and custom reports.
8. Improvado
Most suitable for: Data teams and marketing teams at large companies
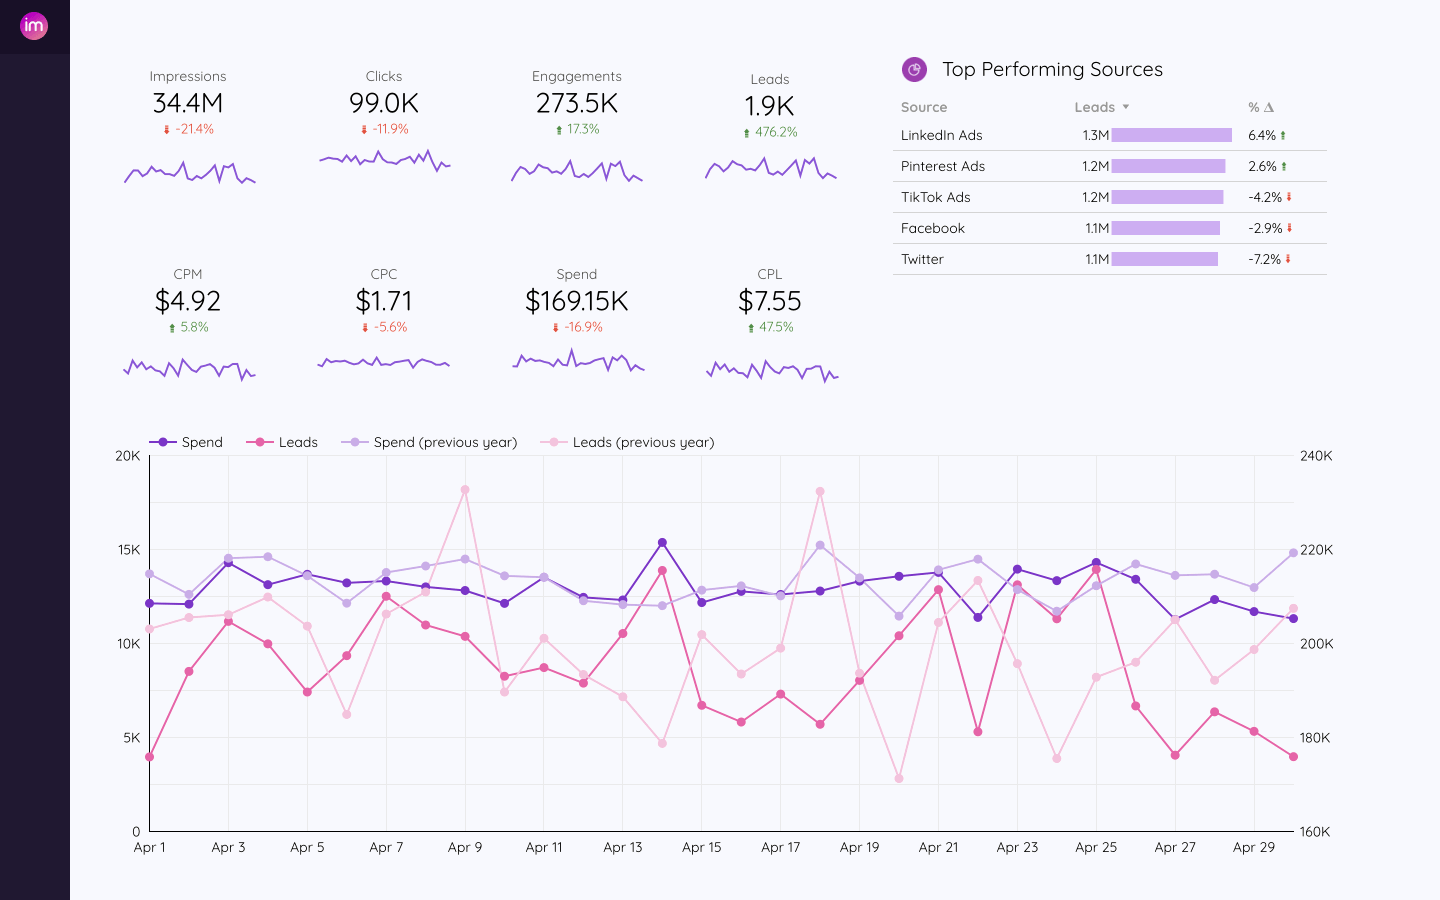
Improvado is an end-to-end data pipeline platform that gathers data from marketing platforms, MarTech tools, and CRMs, transforms this data, and ships it to various destinations.
Improvado offers over 500 data sources and channels, which is substantially higher than Supermetrics’ 100. Once your cross-channel data is on the platform, you can harmonize and clean it into an unified dataset.
You can then push this cleaned data to visualization tools, data warehouses, and spreadsheets. You can also keep your data in a fully-managed storage.
Similar to Supermetrics and other ETL tools, you’ll still need to move your data from Improvado to a third-party tool like Looker Studio to visualize it.
However, Improvado does offer pre-built dashboards that you can use right away with your visualization tool of your choice. This means you won’t need to spend too much time creating dashboards and reports.
Improvado’s uniqueness lies in its AI-powered “campaign governance” solution which automatically validates campaign targeting, naming conventions, brand safety, KPI pacing, and more. It also validates the consistency of your performance metrics and alerts you about any issues.
But because of the vast features available, it can take months to implement Improvado. This makes it a more suitable tool for enterprises who need a powerful data analytics platform, but it may be overkill for marketing agencies and small businesses.
Improvado Reviews from Real Users
“There are a lot of ETL tools and a growing amount of AI companies, but Improvado's customer relationships and willingness to go above and beyond really sets them apart.” (Source)
“The best aspect of Improvado is their extensive range of integrations across major social, search, and ad-server platforms.” (Source)
“Improvado can be expensive, particularly for smaller businesses or startups with limited budgets.” (Source)
Key Features
- 500+ integrations
- Fully-managed data storage
- Unlimited data destinations
- Pre-built dashboards
- AI-driven data transformations
- Marketing attribution
- AI-powered campaign governance
- AI-insights
Pros and Cons
Pros:
- Powerful data analytics
- AI-powered insights
- Helpful customer support
Cons:
- Can be expensive for small businesses and agencies
- Long implementation time
- Steep learning curve
Pricing
Improvado doesn’t share their pricing publicly but based on online reviews and blog articles, the total cost can be anywhere between $2,000-$5,000 per month.
9. FiveTran
Most suitable for: Data teams at small to medium businesses
Fivetran is a data movement platform for building automated data pipelines. It allows you to move data from multiple sources to destinations using a simplified ETL process.
Shaped according to the needs of data analysts and business intelligence users, Fivetran helps marketing teams in large enterprises control data without complex engineering and support data-backed decisions on multiple executive levels.
FiveTran Reviews from Real Users
“Fivetran has provided us with a no code solution to extracting data into our databases and data warehouses, and has hugely simplified our data architecture and improved security.” (Source)
“Relying on Fivetran means depending on a third-party service for critical data workflows. If there are outages or issues on their end, it could impact your data integration processes.” (Source)
“Support could be so much more better.” (Source)
Key Features
- Easy to set up
- Complete replication from any source
- Fully managed pipeline 24x7
- Normalized schemas from denormalized APIs
- Automatic schema migrations
Pros and Cons
Pros:
- No-code marketing analytics platform
- Automated data transformation
- Data governance and security features
- Pricing based on usage
Cons:
- Time-consuming logging process
- Lacks enterprise-oriented data management features
- Limited support for historical data ingestion
Pricing
Fivetran comes with four pricing plans including the Free plan that includes all the features of the most popular Standard plan but with a usage limit of 500,000 monthly active rows.
It’s meant for users who need to automate ETL for small amounts of data. Other plans are graded by the number of users, sync time, and advanced data features.
Published on Oct 10 2022
WRITTEN BY
YamonYamon is a Senior Content Marketing Manager at Whatagraph. With an eye for detail and a knack for always considering context, audience, and business goals to guide the narrative, she's on a mission to create genuinely helpful content for marketers. When she’s not working, she’s hiking, meditating, or practicing yoga.