


What is a social media report generator?
A social media report generator helps you collect, organize, and present performance data from different platforms—all in one place.
Instead of jumping between Instagram Insights, Facebook Ads Manager, and LinkedIn Analytics, you get a single, unified report that tells the full story.
For agencies juggling multiple campaigns across multiple clients and multiple platforms, social media report generators can save a ton of time and brainspace. In fact, Hubspot found that agencies spend around four or five hours per client each month on reporting.
But with an automated social media reporting tool, you can get back those hours. And we've seen this in real life. Maatwerk Online, one of the most prestigious agencies in the Netherlands, saved 100 hours a month on reporting after using an automated marketing intelligence platform like Whatagraph. They're now using that time back to focus more on strategy and their clients.
A good social media reporting tool does the heavy lifting for you:
- Connects directly to each platform (e.g. Facebook, Instagram, TikTok, LinkedIn)
- Standardizes metrics so you’re comparing apples to apples, not mismatched KPIs
- Visualizes performance in a way that clients actually understand
- Lets you brand and customize reports with your logos, annotations, and KPIs that truly matter
With Whatagraph IQ, you take this even further. Instead of building dashboards widget by widget, marketers can:
- Ask AI to generate a full report instantly, complete with charts, tabs, and layouts
- Use IQ Themes to automatically brand reports for each client
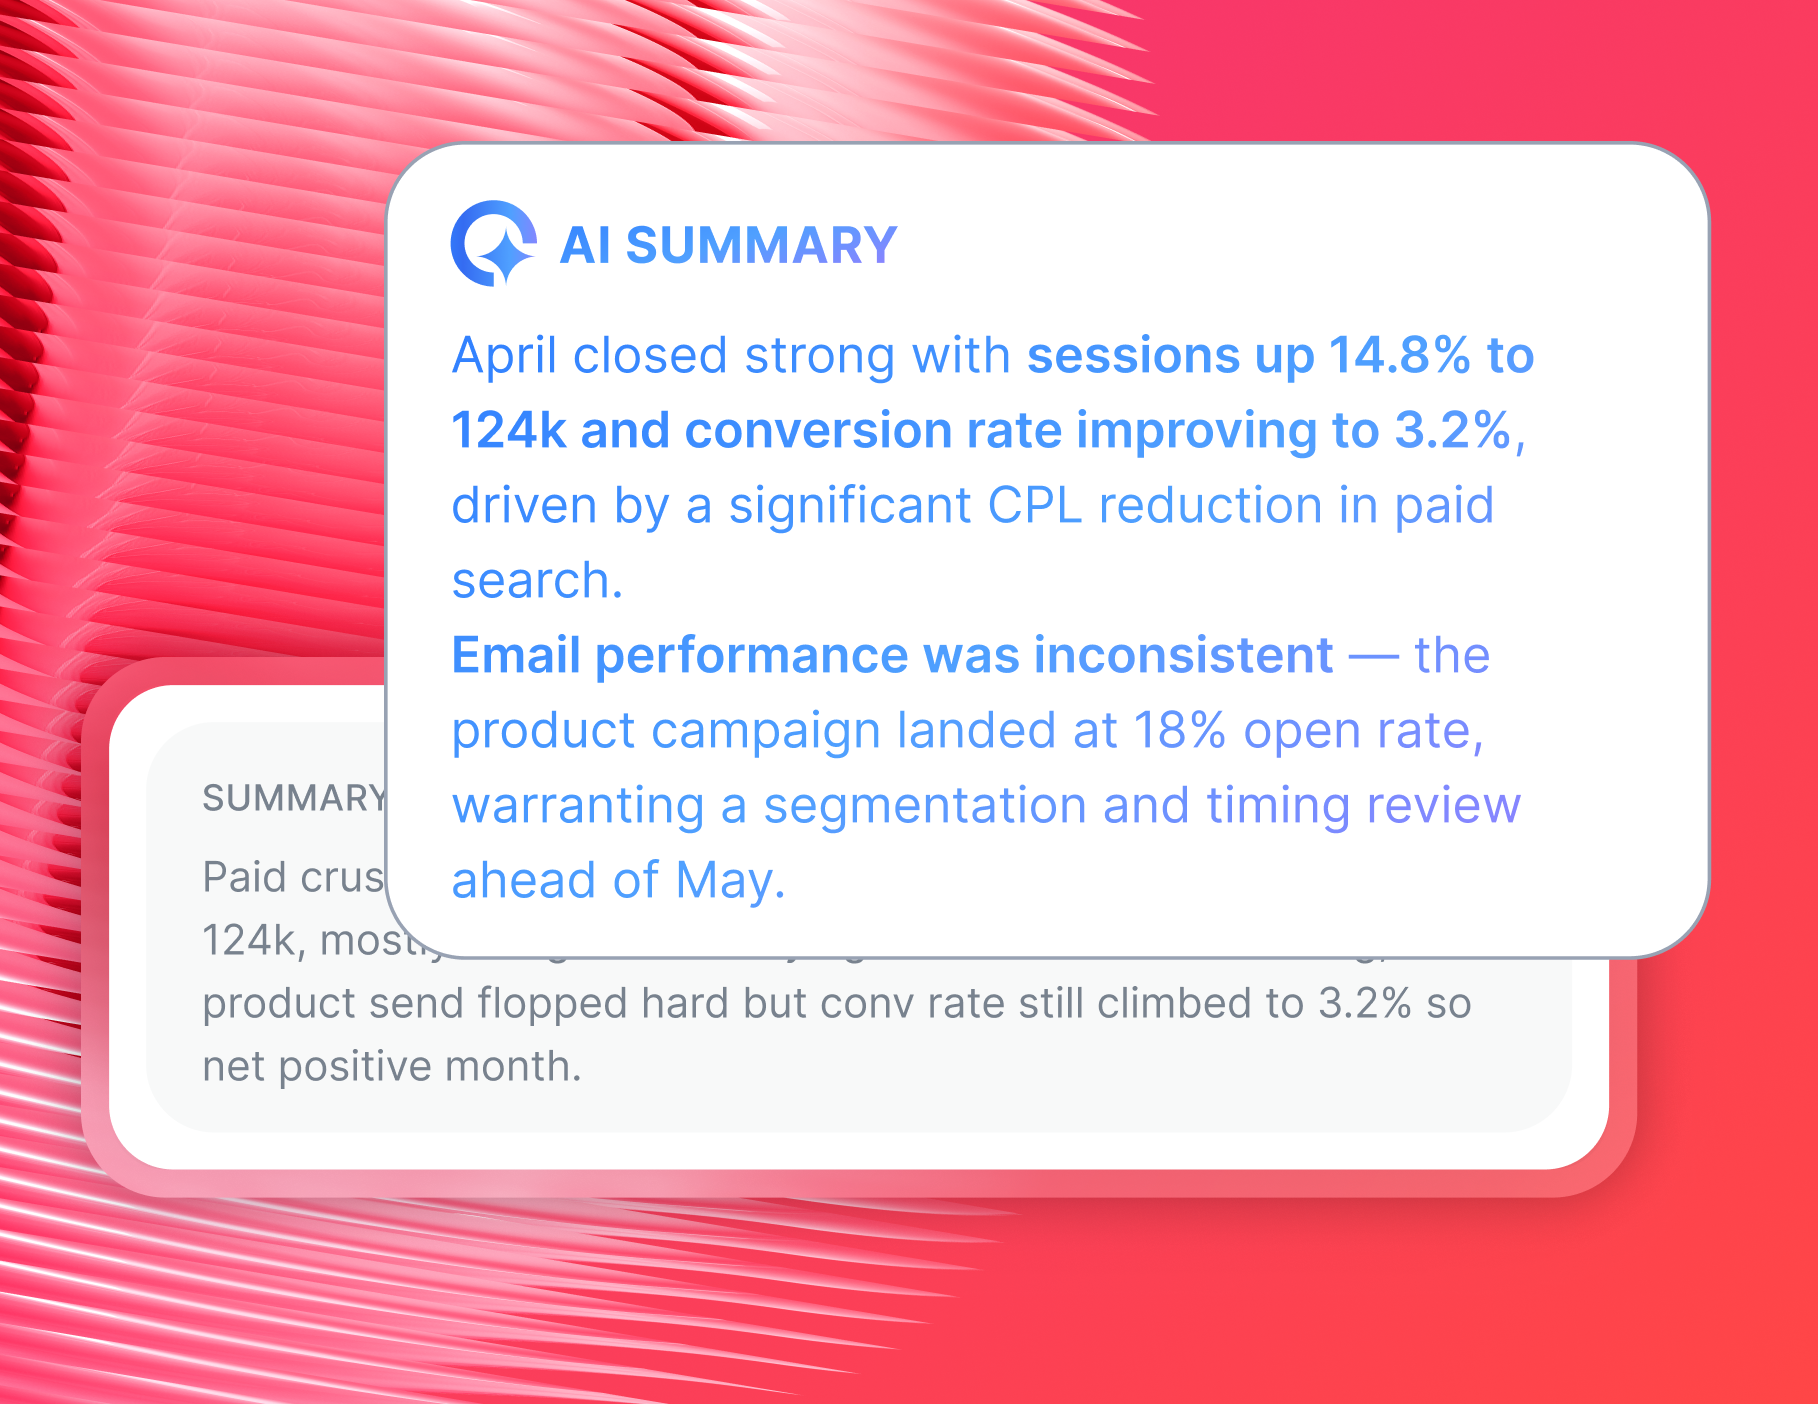
- Get plain-language summaries that explain performance without hours of writing
- Chat directly with IQ to get instant answers about campaign performance
Whatagraph has also launched an MCP that lets you connect your data to Claude or ChatGPT and analyze your data there.
What are the best AI social media reporting generators?
There are plenty of social media report tools that promise to track your social performance—but not all are built for agencies juggling multiple clients and campaigns.
If you're looking for tools that simplify reporting, cut down on manual work, and help you deliver valuable insights that impress, here are five best ones:
1. Whatagraph – Best AI Social Media Report Generator for Agencies and Teams
Whatagraph is built for marketers, not data engineers.
Instead of juggling clunky dashboards, Excel sheets, or broken connectors, you get one social media reporting tool that connects, organizes, visualizes, and shares all your social and marketing data—without relying on technical teams.
Here’s why it stands out:
- 55+ native integrations with social, SEO, PPC, and email platforms (Instagram, Facebook, TikTok, LinkedIn, Google Analytics, and more)
- Cross-channel reporting that blends all channels into one holistic view
- Whatagraph IQ: a suite of AI features to create, style, and analyze reports in seconds
- Custom KPIs & data blends: Organize metrics your way, without a data analyst
- Automated report delivery via live links, email, PDF, or CSV
With Whatagraph IQ, you won’t need to spend hours building social media dashboards from scratch. You can just ask AI to:
- Build entire reports: Type what you need, and IQ assembles the full report in seconds—charts, tabs, and all.
- Style your reports automatically: Upload a logo or image, and IQ generates a matching branded theme with the right fonts, HEX codes, and icons.
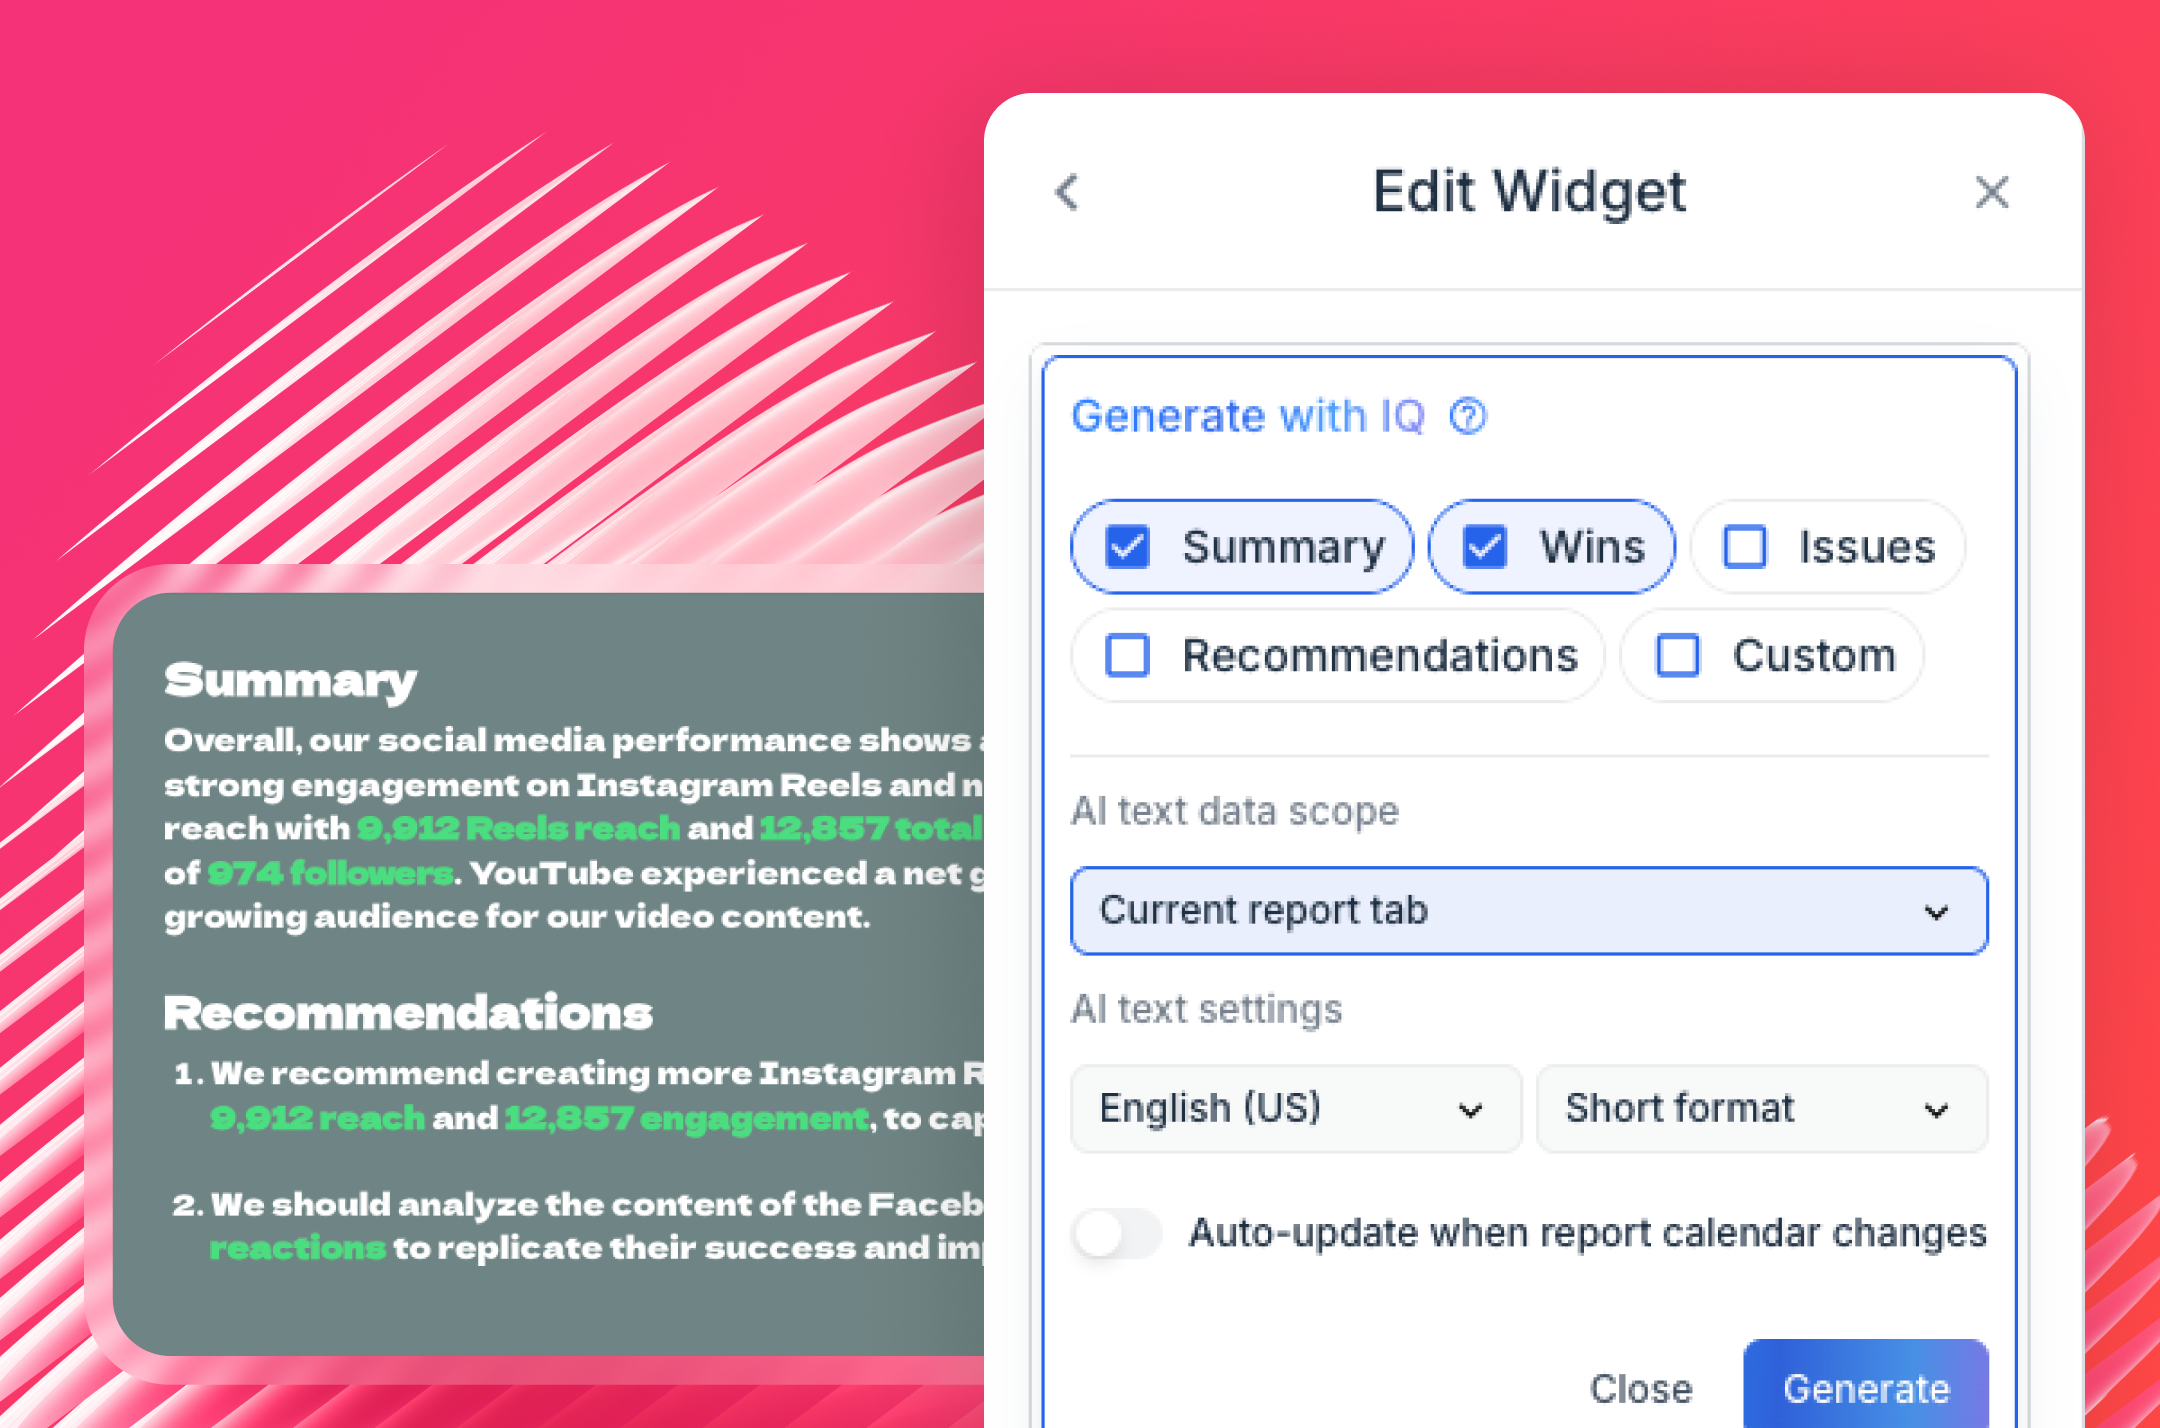
- Explain performance in plain language: Get AI-written performance summaries you can use as-is or tweak for that human touch. The AI reads the data on your report or a specific tab to write summaries so there are no hallucinations.
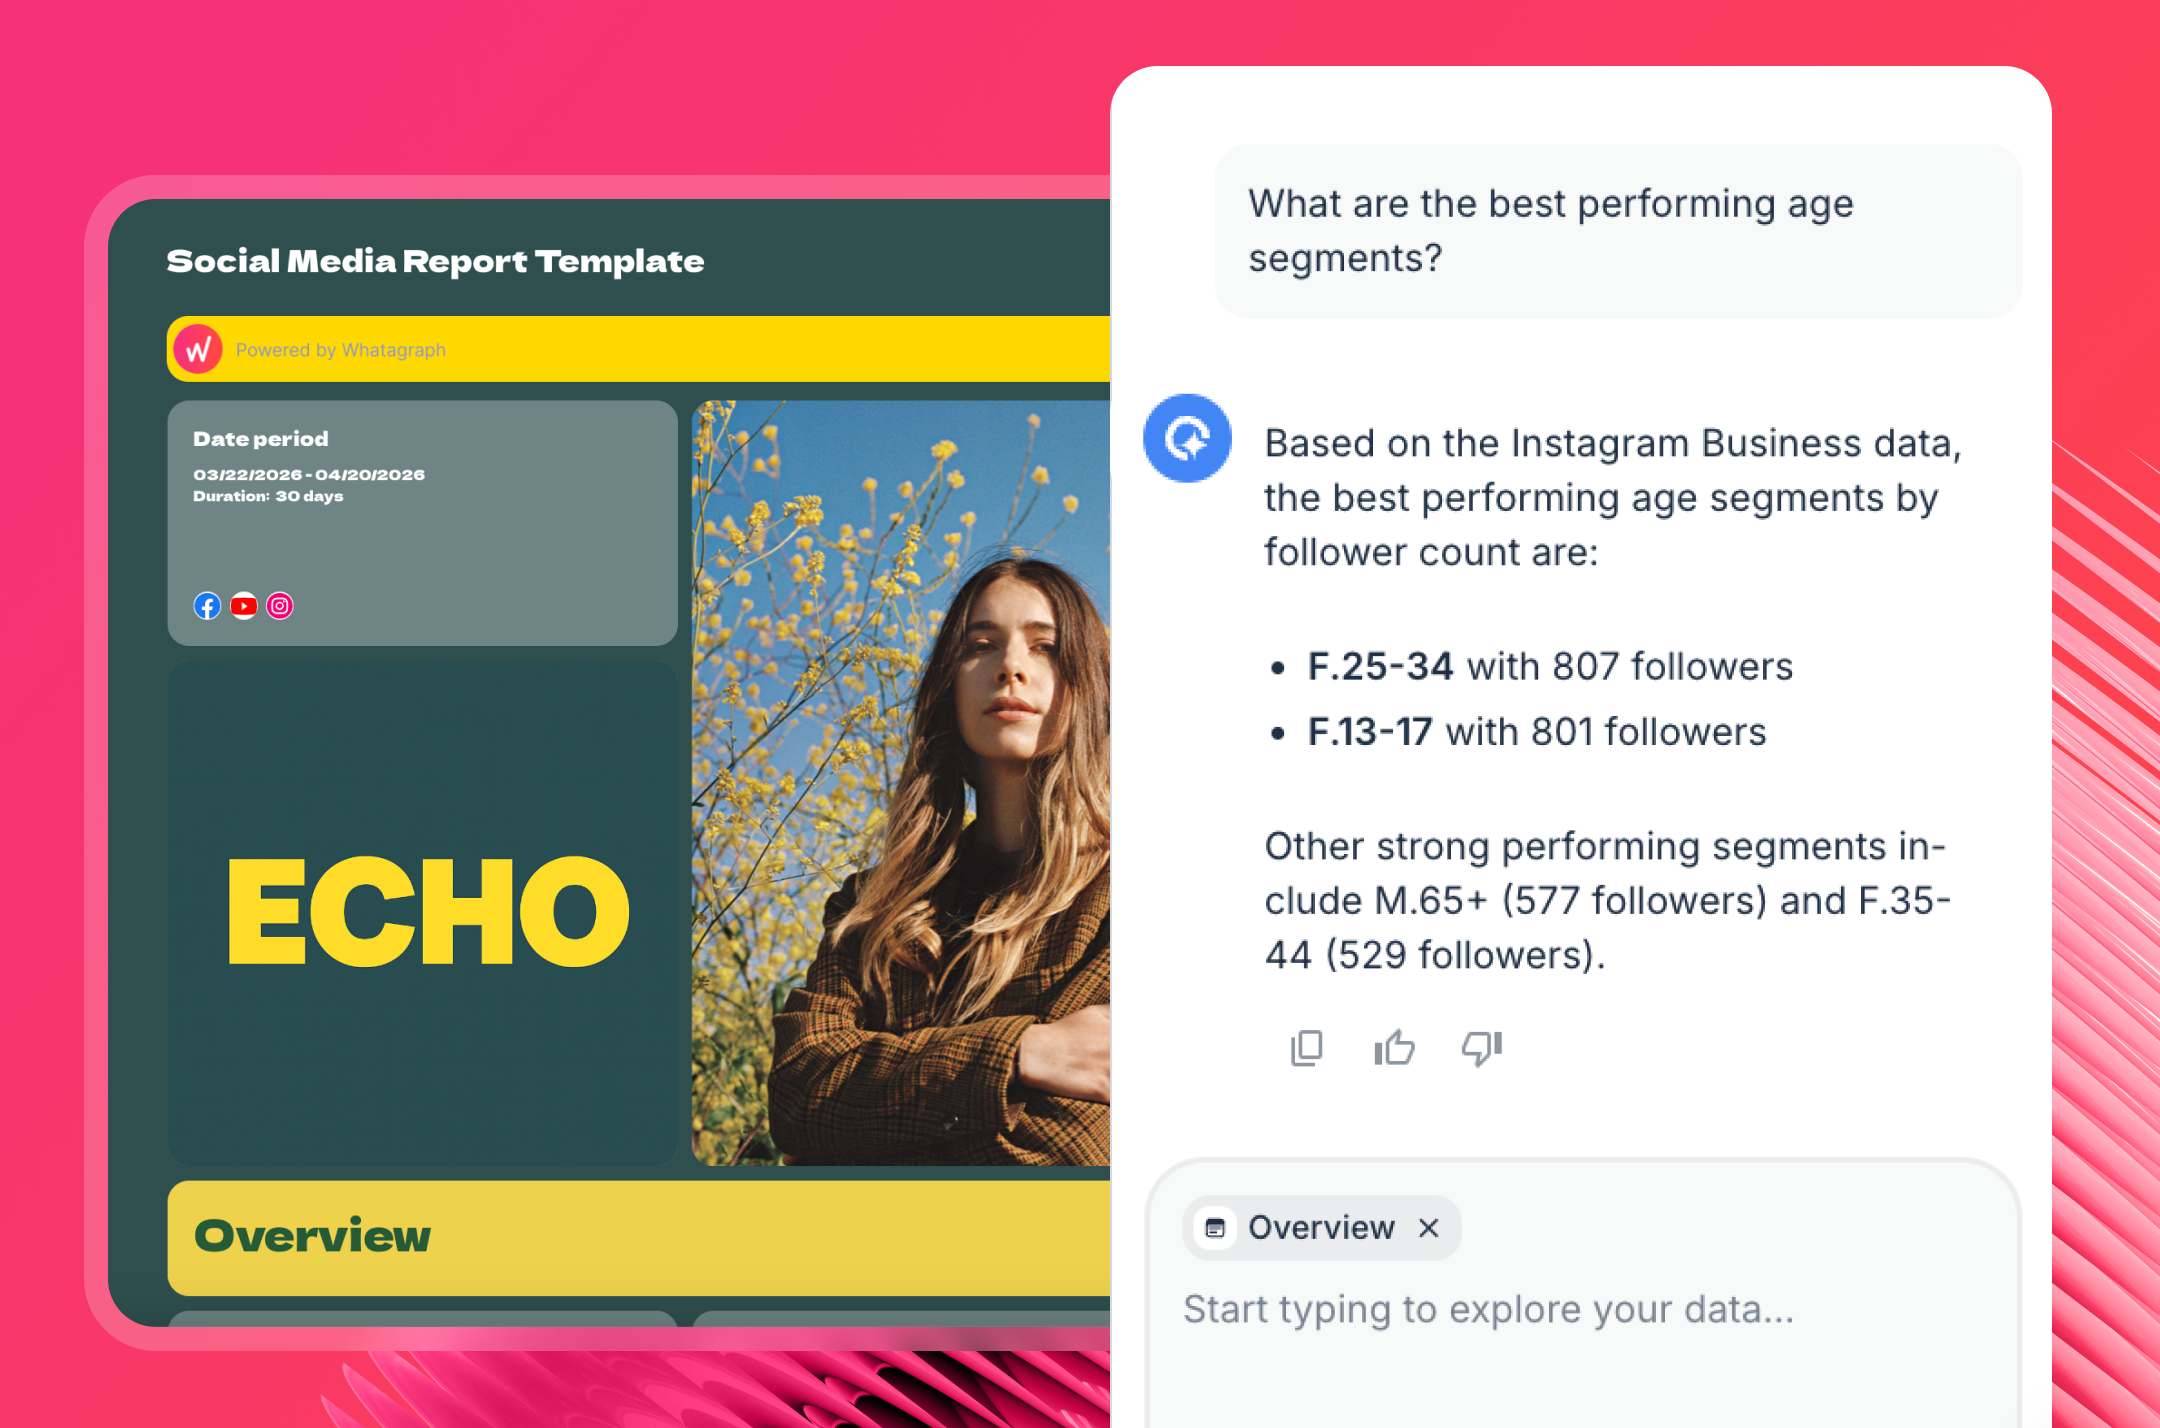
- Answer ad-hoc questions instantly: Ask IQ Chat things like “Which campaign drove the highest ROAS last month?” and get an immediate answer, no pivot tables required.
With Whatagraph, you can go from raw data to actionable insights in under 30 minutes—no dev work, no endless troubleshooting.
Lars Maat, Co-Founder of Maatwerk Online, sums it up best in this case study:
Whatagraph’s AI saves time and energy for our marketing specialists. The hours we’re saving is just pure profit. We now have the time to focus on more strategic things that help both our agency and our clients grow.
Start free with Whatagraph today.
2. Hootsuite – Best for Social Scheduling with Basic Analytics
Hootsuite is best known for scheduling posts across multiple platforms, but it also offers a decent set of analytics features. It’s great for social media managers who want to monitor engagement, post performance, and audience growth from one place.
With Hootsuite, you can:
- Track engagement, clicks, and followers across Facebook, Instagram, and X
- View platform-specific performance reports
- Schedule reports to be emailed weekly or monthly
But it’s worth noting: customization is limited, data blending isn’t possible, and it lacks advanced reporting features agencies often need for client work.
3. Buffer – Best for Solo Marketers and Small Teams
Buffer is a lightweight tool with a clean interface, ideal for small businesses or solo marketers who want an all-in-one dashboard.
Buffer provides:
- One dashboard for tracking engagement and reach
- Simple performance insights and posting recommendations
- Multi-platform posting and scheduling
However, it doesn’t offer analytics for every platform, lacks competitive benchmarking, and doesn’t support advanced client reporting or white labeling.
4. Sprout Social – Best for Built-In Social Listening & Engagement
Sprout Social offers a strong mix of social media scheduling, publishing, and analytics—plus built-in social listening and sentiment analysis.
What makes it stand out:
- Comprehensive engagement tracking across all major platforms
- Sentiment analysis and competitor reports
- Premium Analytics allows custom reporting dashboards
However, advanced features like cross-channel reporting and social listening are locked behind higher-tier enterprise plans, which may be overkill (and over budget) for smaller agencies.
5. Keyhole – Best for Influencer Tracking & Hashtag Analytics
Keyhole is a solid choice for agencies focused on influencer marketing, brand monitoring, and campaign-level hashtag performance.
Why agencies use it:
- Tracks brand mentions, hashtags, and competitor activity
- Identifies top-performing influencers and analyzes their reach
- Offers sentiment analysis and trend spotting in real time
While it’s strong on listening and monitoring, Keyhole lacks deeper customization, multi-channel data blending, and advanced reporting features—making it more of a supplement than a complete reporting solution for client-facing analytics.
Want more options? Check out our full breakdown of 12 best social media analytics tools.
How to use our social media report generator to automate your reporting
Creating a social media report doesn’t have to mean jumping between platforms, pasting screenshots into a slide deck, or manually updating spreadsheets.
With Whatagraph’s social media report generator, you can go from data connection to client-ready report in under 30 minutes.
Here’s how:
1. Connect your social media accounts
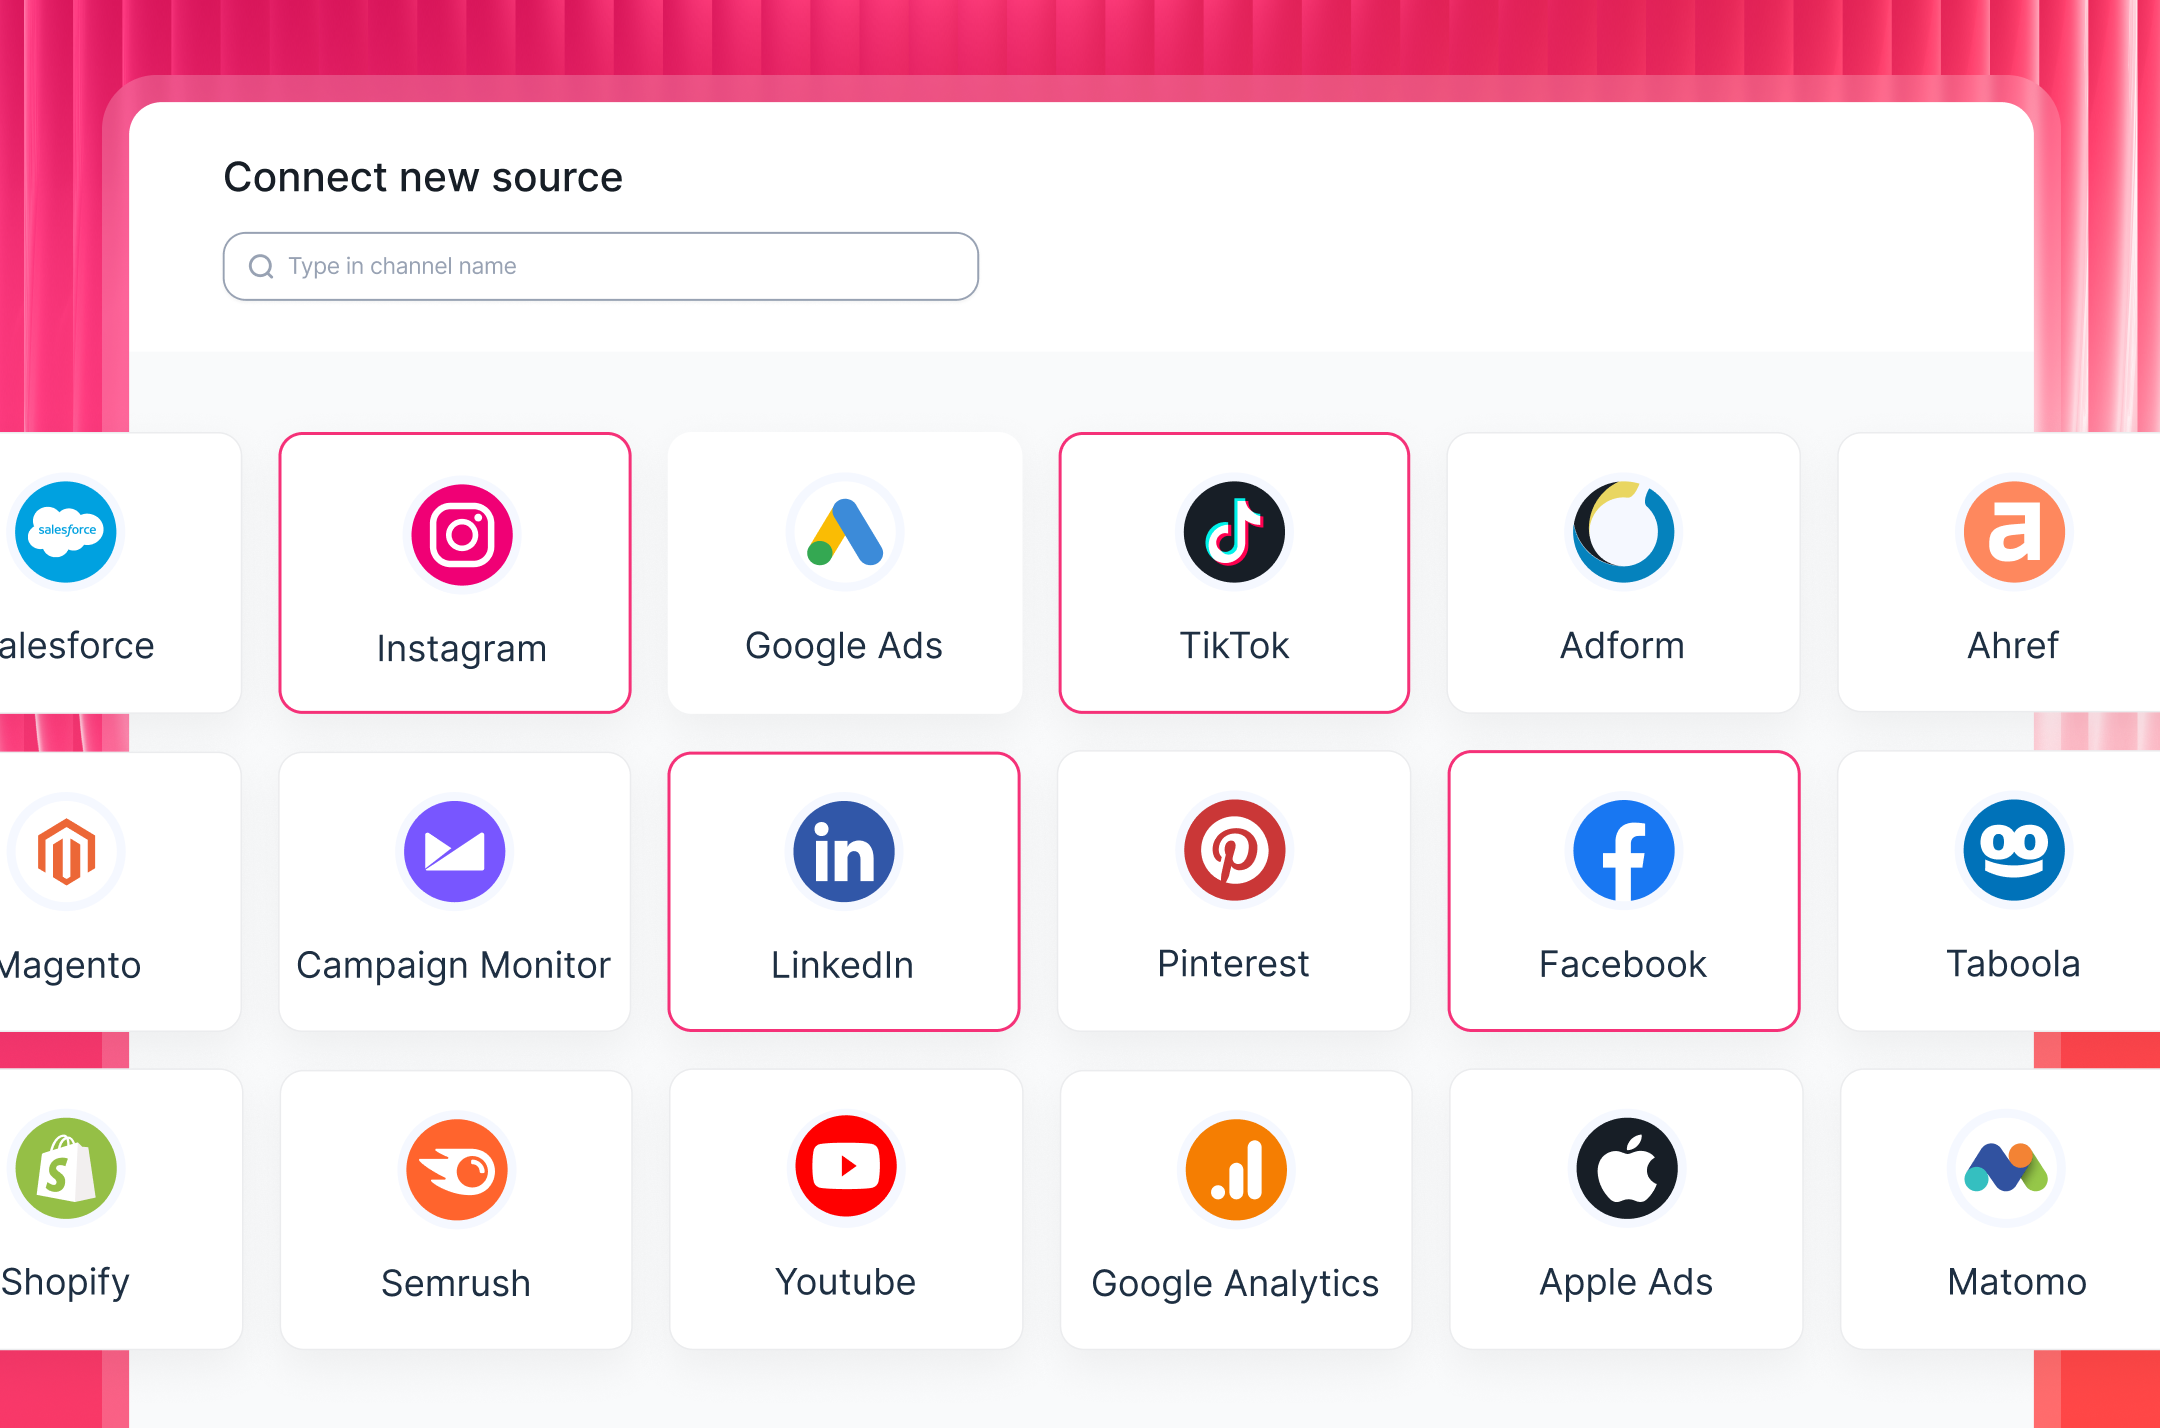
Start by connecting your social media platforms through plug-and-play integrations.
From your Whatagraph workspace, choose a social media marketing platform like Facebook or TikTok, authenticate with your login, and you’re done. No devs, no APIs, no third-party tools. With this social media reporting tool, setup only takes a few minutes.
You can also pull in data from Google Analytics, PPC platforms, or even use Google Sheets or API connections for custom sources.
We support 55+ integrations in total, including:
- PPC: Google Ads, Meta Ads, LinkedIn Ads, Pinterest Ads
- Social: Instagram, TikTok, YouTube, Facebook
- E-commerce: Shopify, BigCommerce, Magento
- SEO & Analytics: GA4, Semrush, Ahrefs, SE Ranking, Matomo
- Email: Mailchimp, ActiveCampaign, Constant Contact
Plus, Whatagraph’s integrations are fully managed and extremely stable—uptime has averaged 99.95% over the past 6 months. If system outages occur, engineers are notified immediately (even at 3am).
2. Organize your data
Once connected, it’s time to clean things up. Standardize naming across campaigns, unify metrics across platforms, and align currencies if needed.
With Whatagraph, you can:
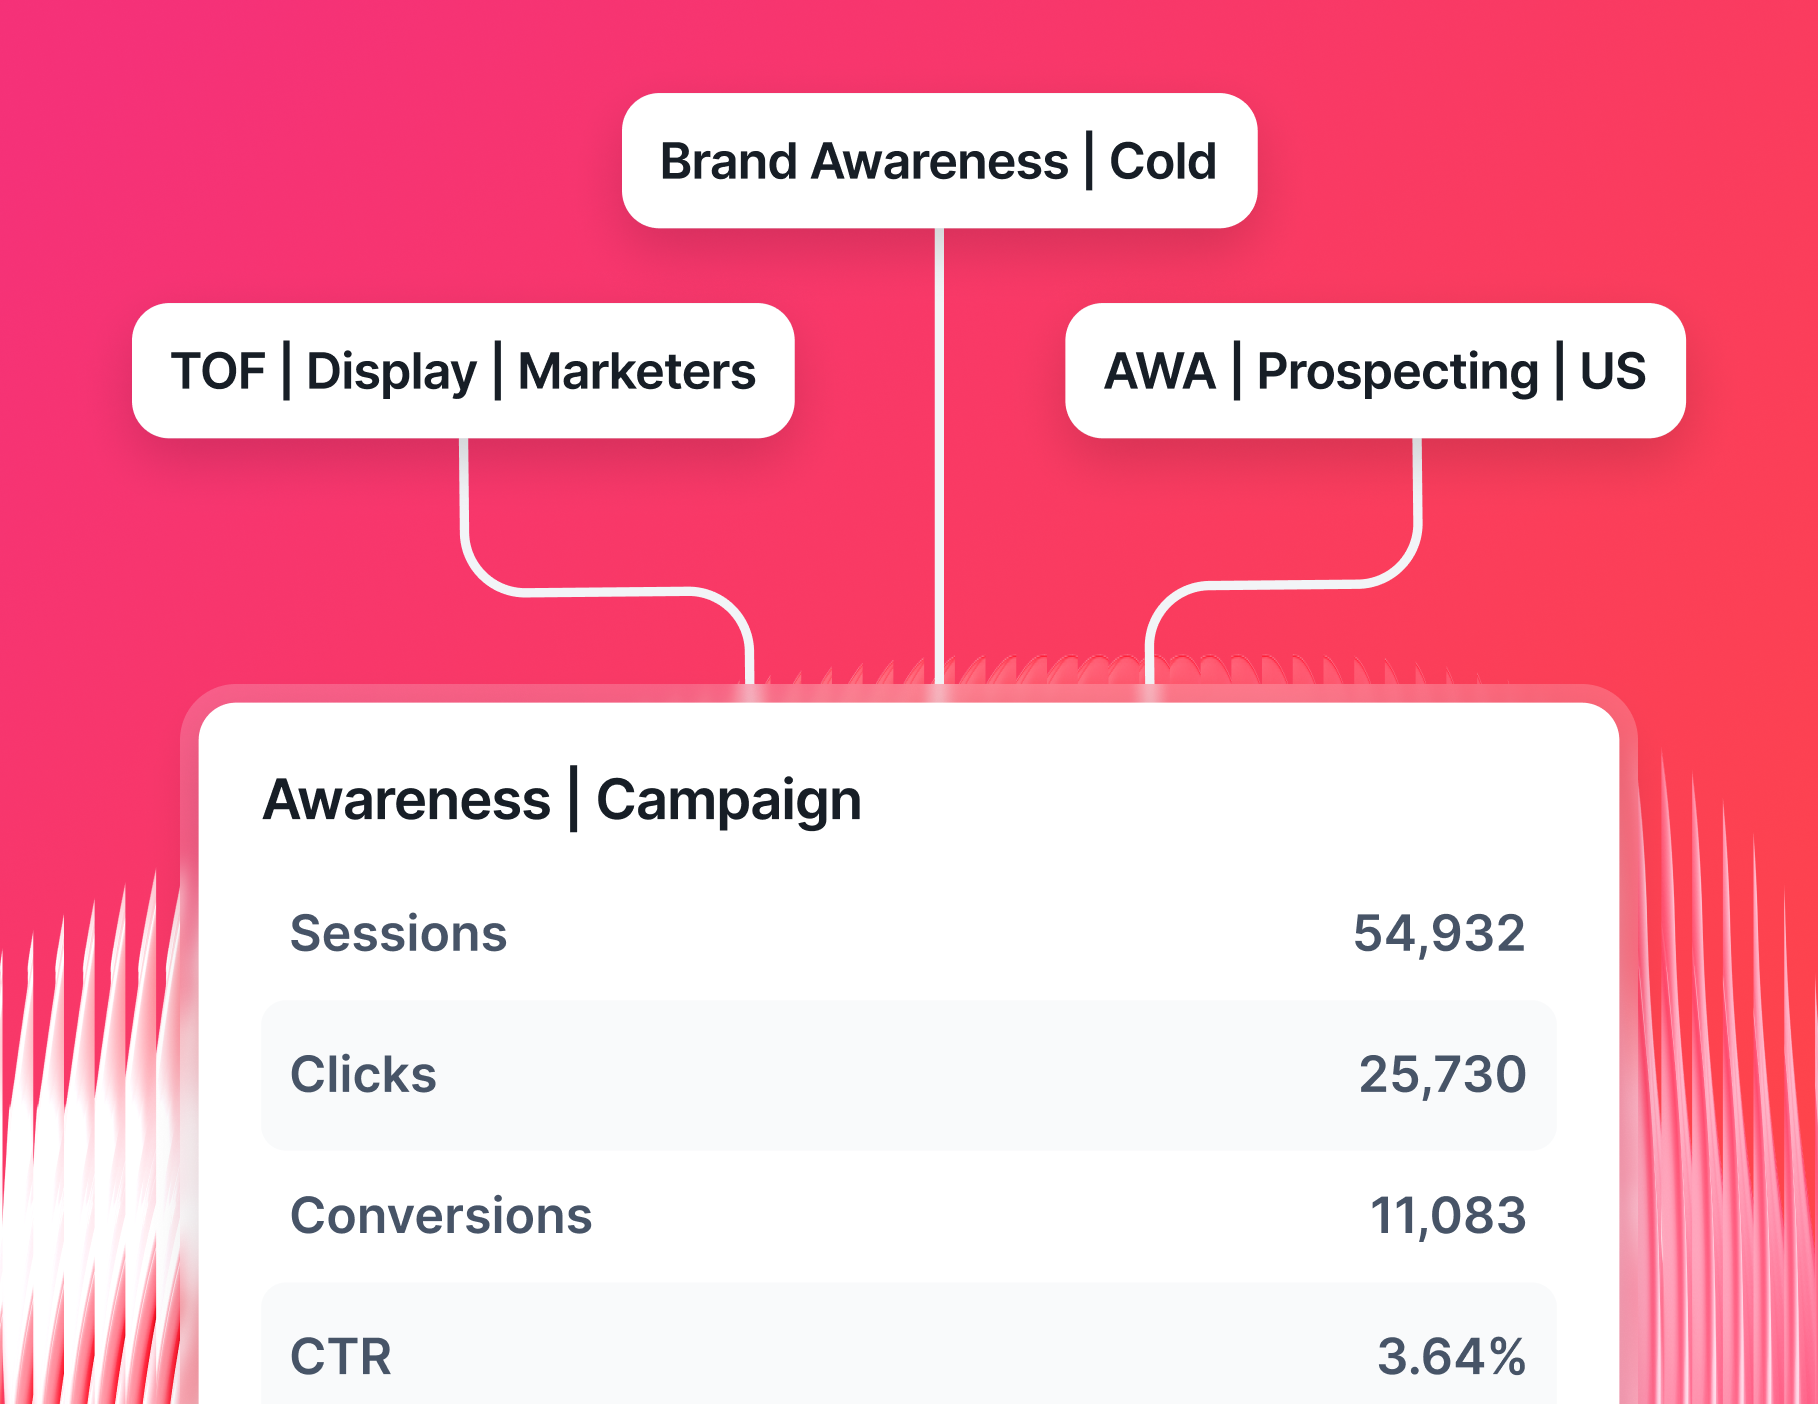
- Group campaigns by channel, ad group, geo, or audience
- Filter by platform, device, or custom segments
- Standardize metric naming across platforms and accounts
- Blend cross-channel data (e.g., Google Ads + Facebook Ads in one view)
- Apply tags and folders to organize by client, account manager, or region
With Whatagraph IQ Dimensions (available on advanced pricing plans), you won’t even need to play around with formulas to create custom dimensions.
You can just ask AI to:
- Create custom blends automatically. Just describe what you need—like “combine all spend from Meta, TikTok, and Google Ads into one unified Paid Media metric”—and IQ builds the blend for you.
- Build custom metrics on the fly. Want ROAS across channels? Or a funnel KPI like Add-to-Cart conversions? IQ can generate them instantly, without formulas or coding.
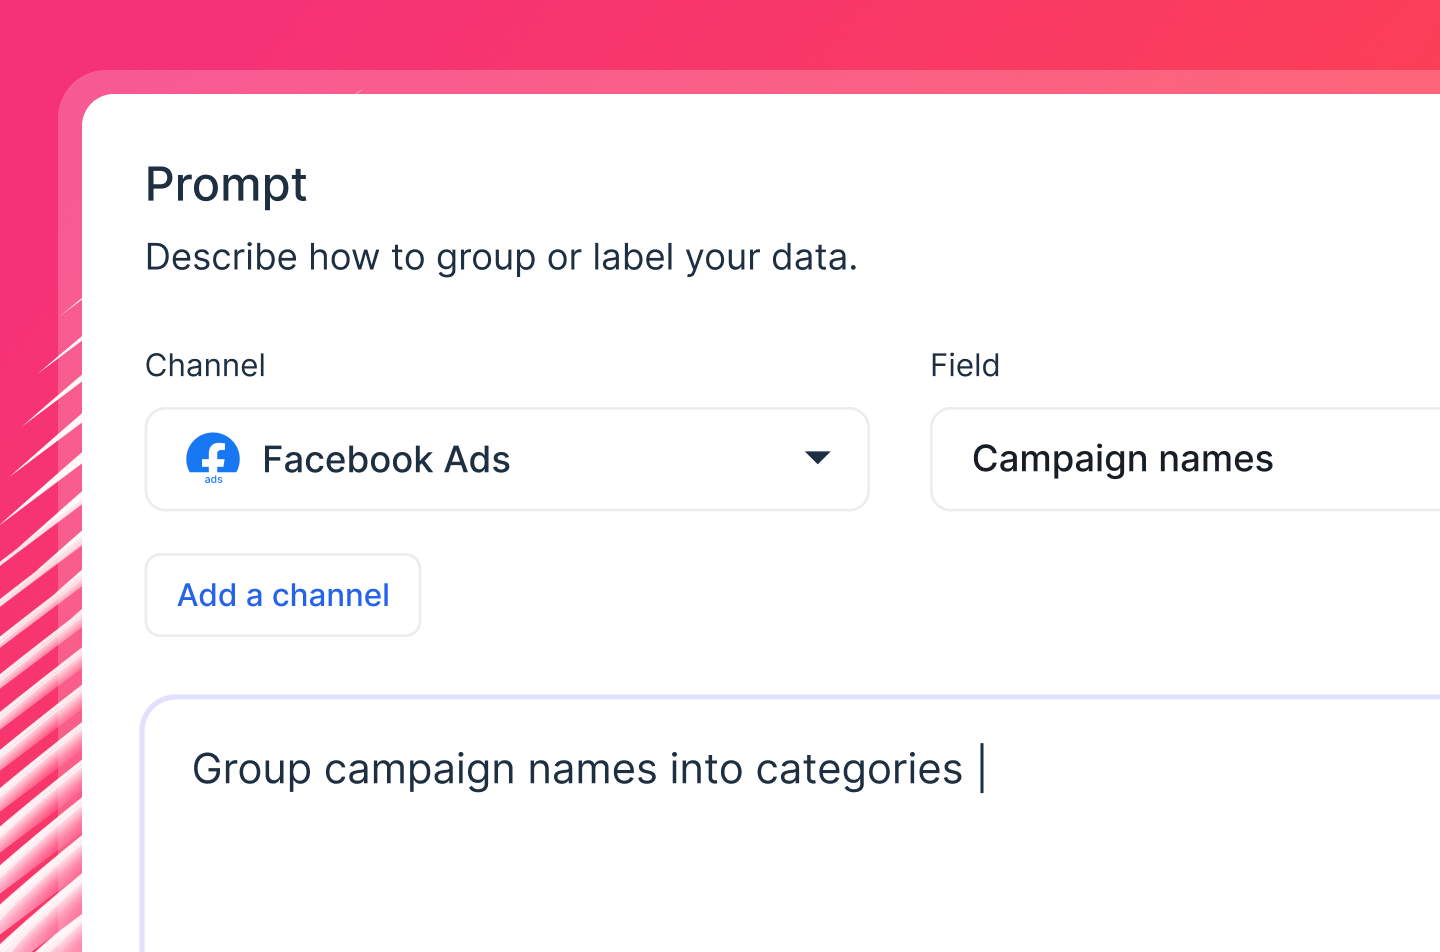
- Standardize messy data with IQ Dimensions. For example, if you’ve got campaign names like “FB_US_SpringSale_23” and “MetaUSA_Spring23,” you can tell IQ: “Group by Campaign Type: Spring Sale”. IQ creates a brand-new dimension that neatly categorizes everything, and you can reuse it across reports.
- Normalize any dimension at scale. Group campaigns by objective, products by category, or reviews by language—whatever fits your reporting needs. IQ makes sense of inconsistent data and saves hours of manual clean-up.
3. Create automated social media reports for clients
With Whatagraph IQ, building client-ready reports isn’t a manual drag-and-drop exercise anymore—it’s as simple as asking AI.
- Generate full reports instantly: Just type what you need, and IQ builds the entire report—charts, KPIs, tabs, and layouts included.
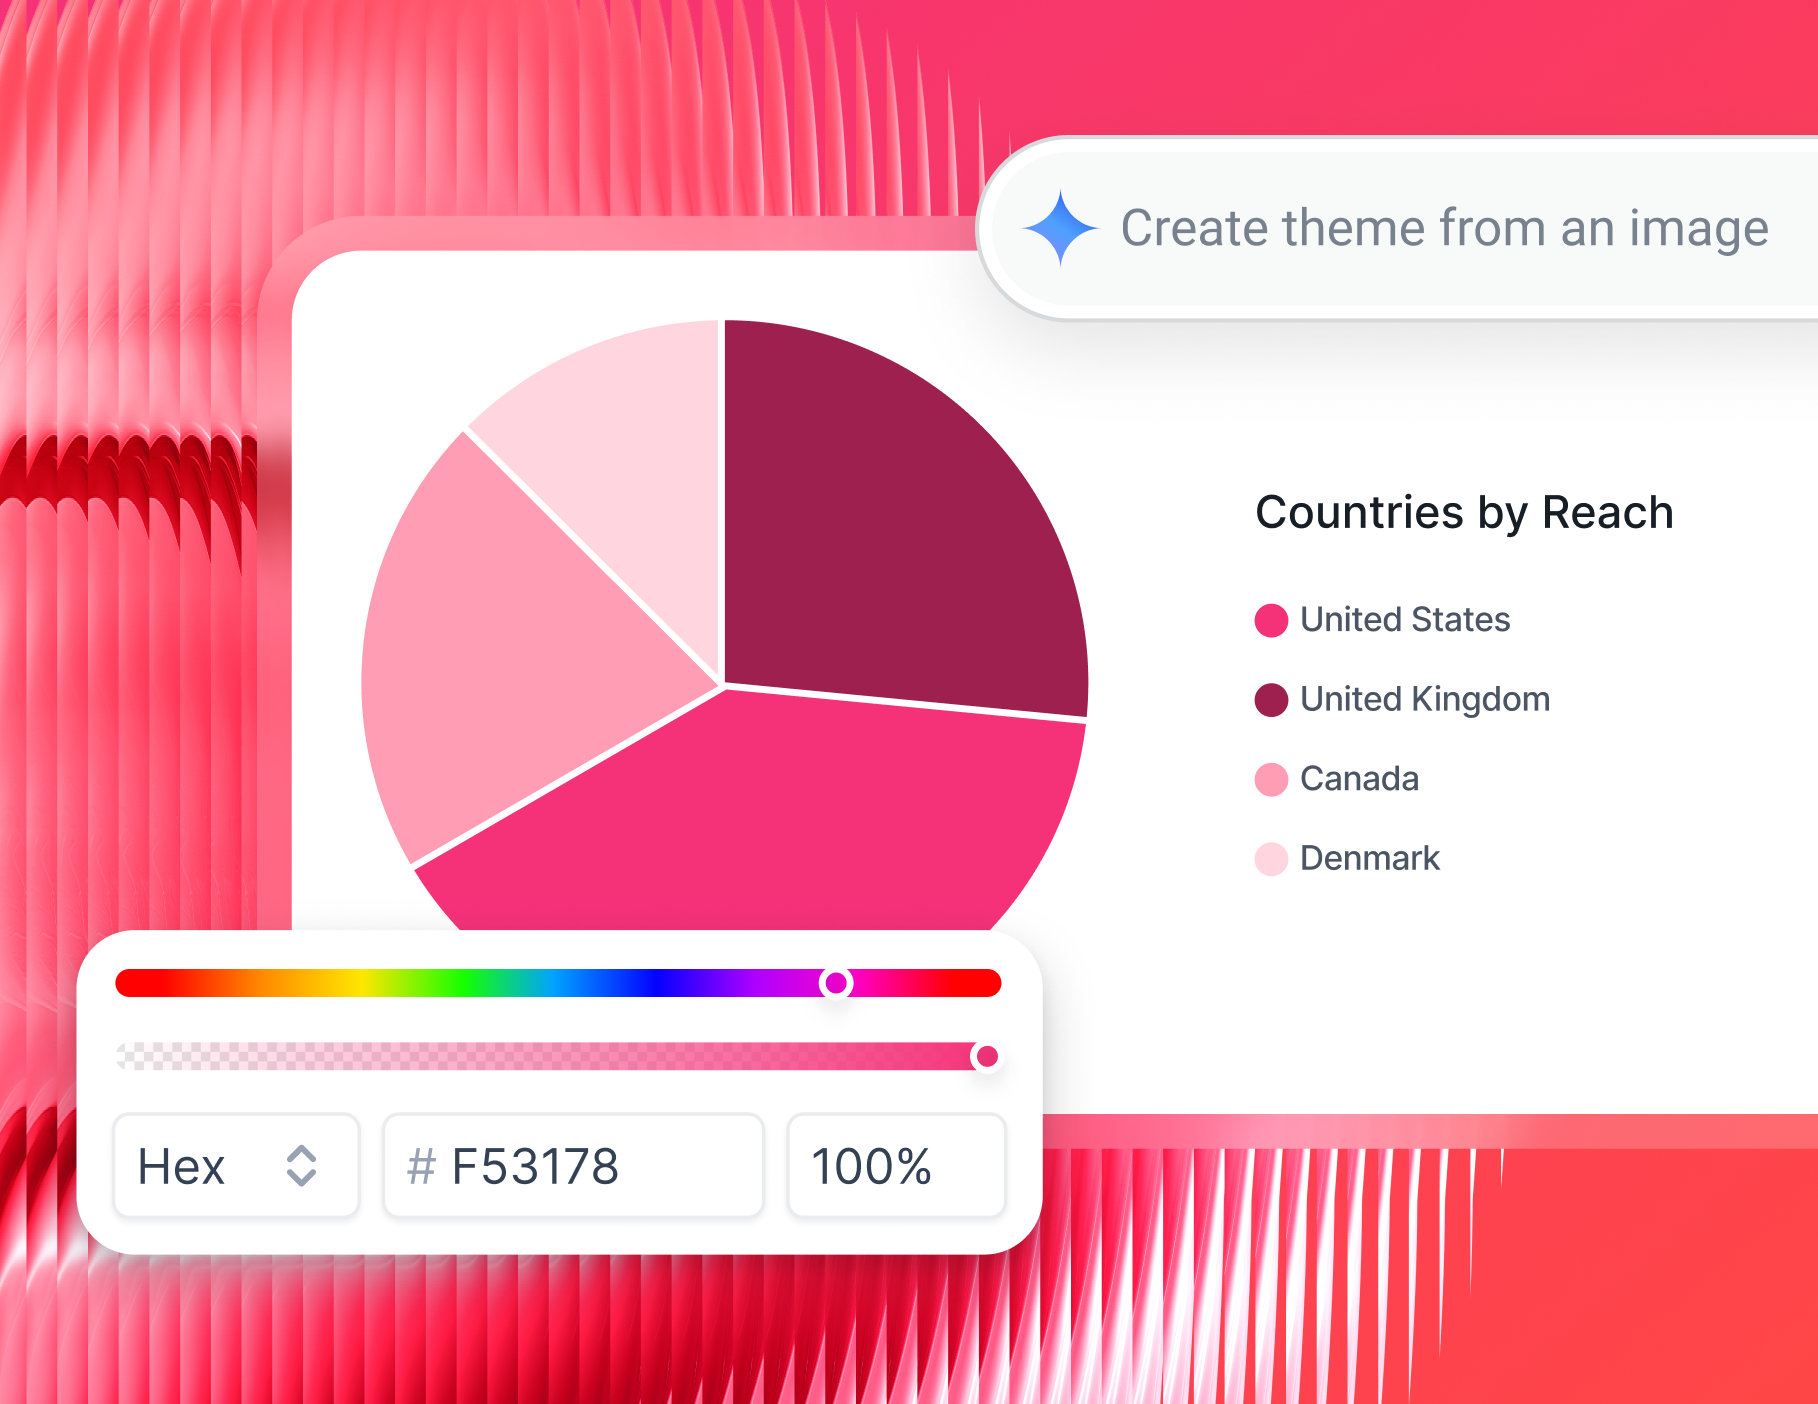
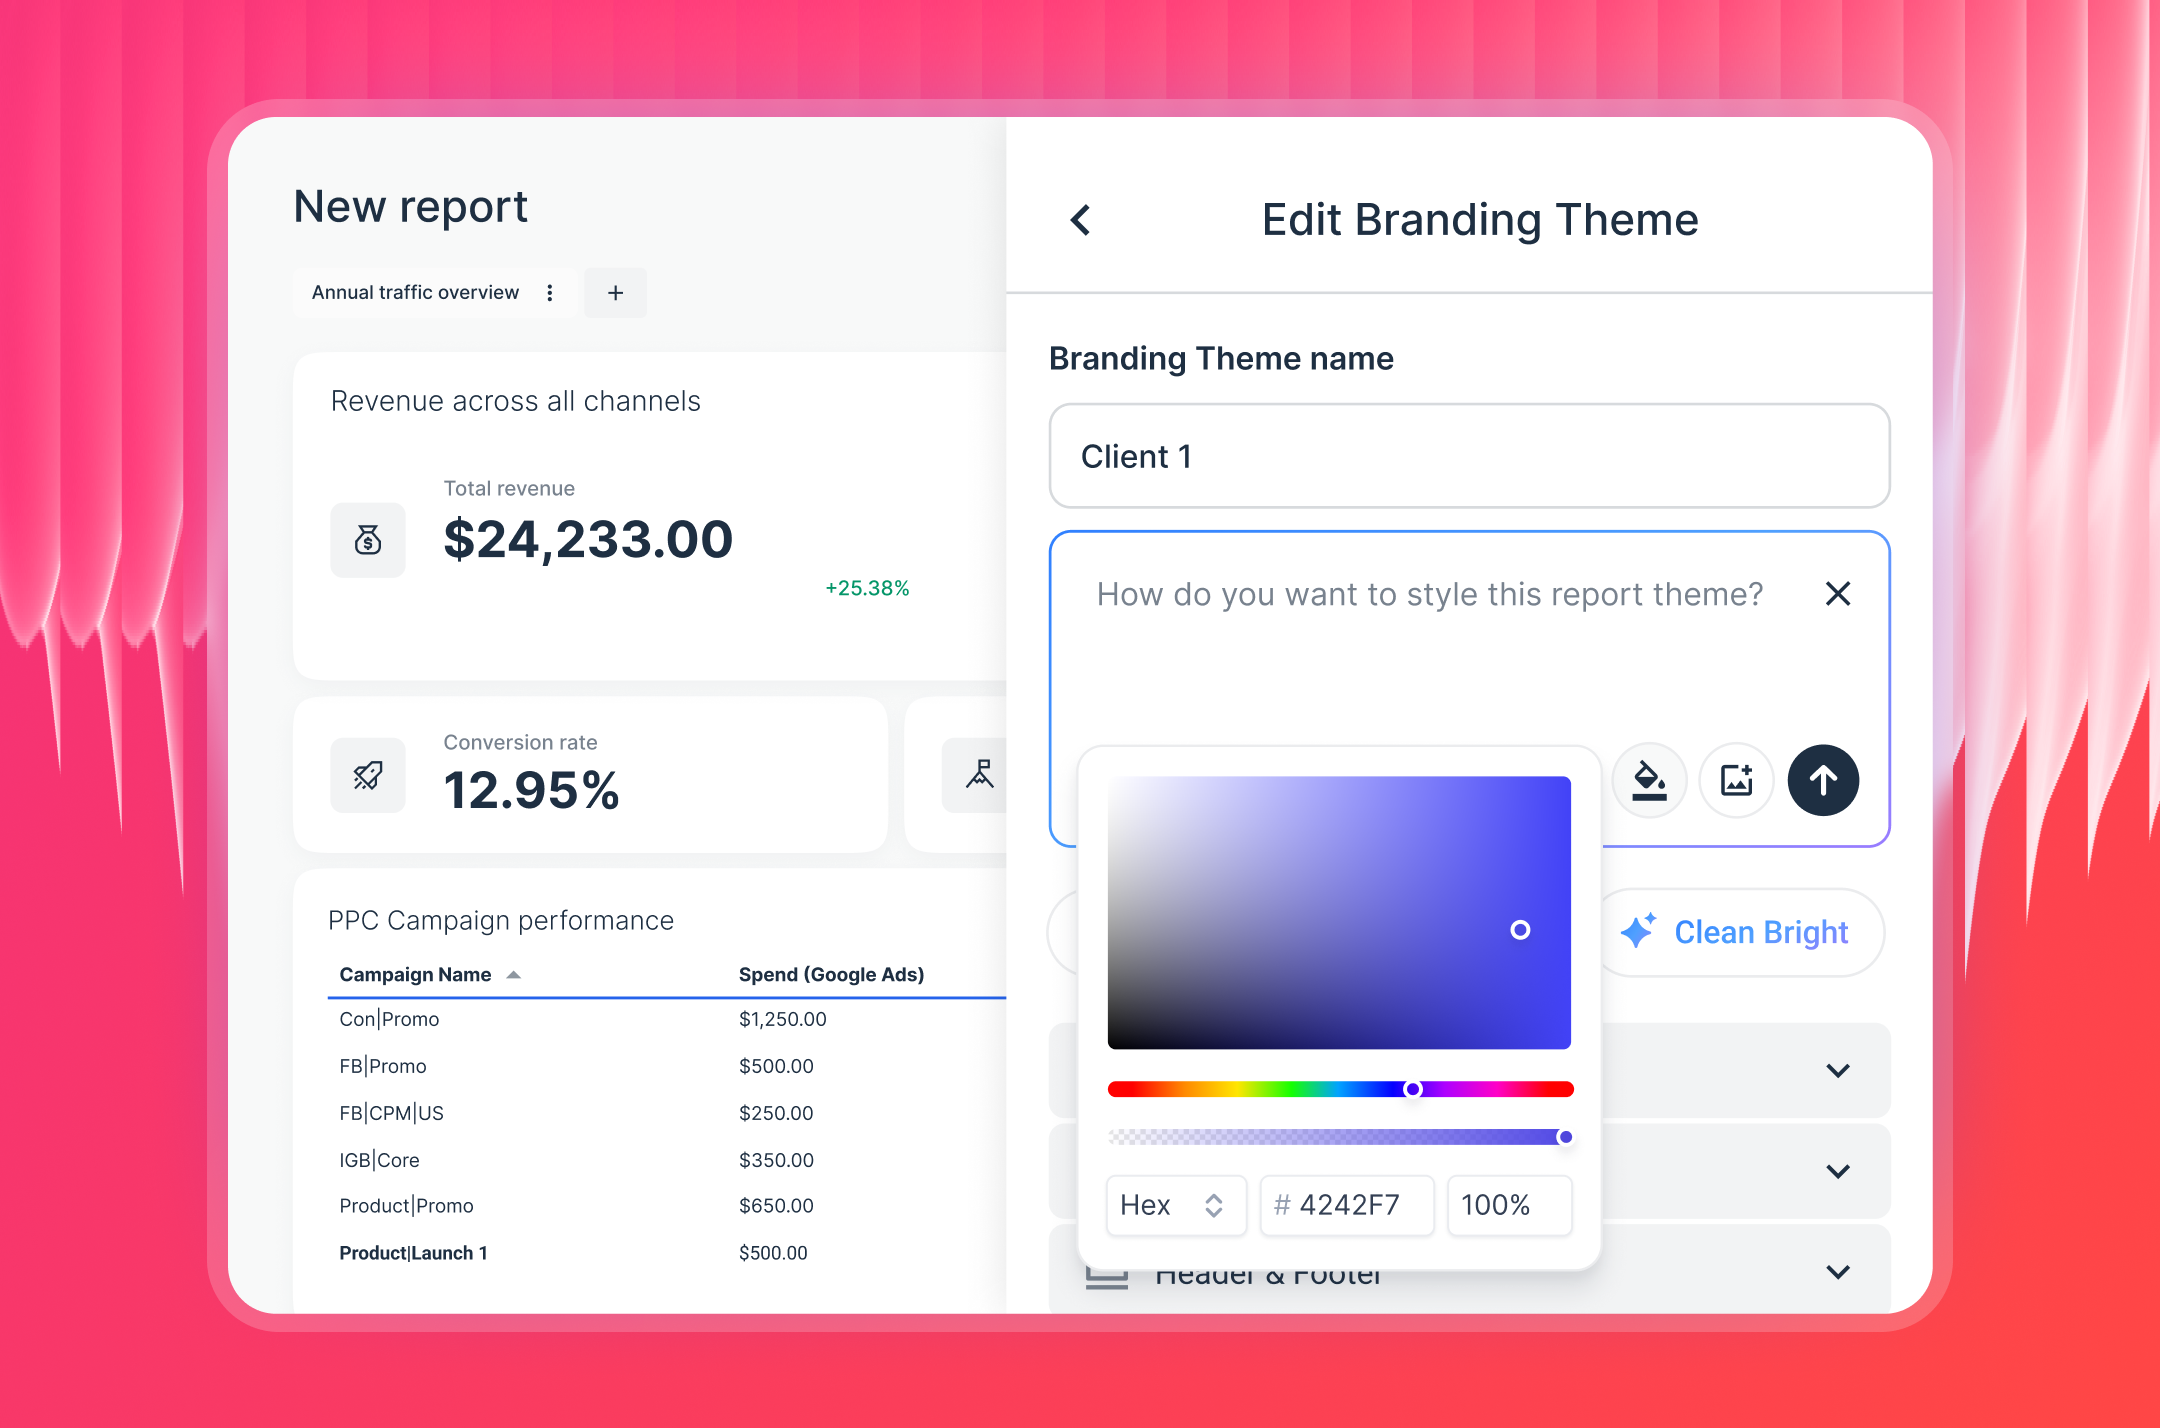
- Style it automatically: Upload a client logo or image, and IQ Themes generates a branded look with fonts, HEX codes, and icons to match.
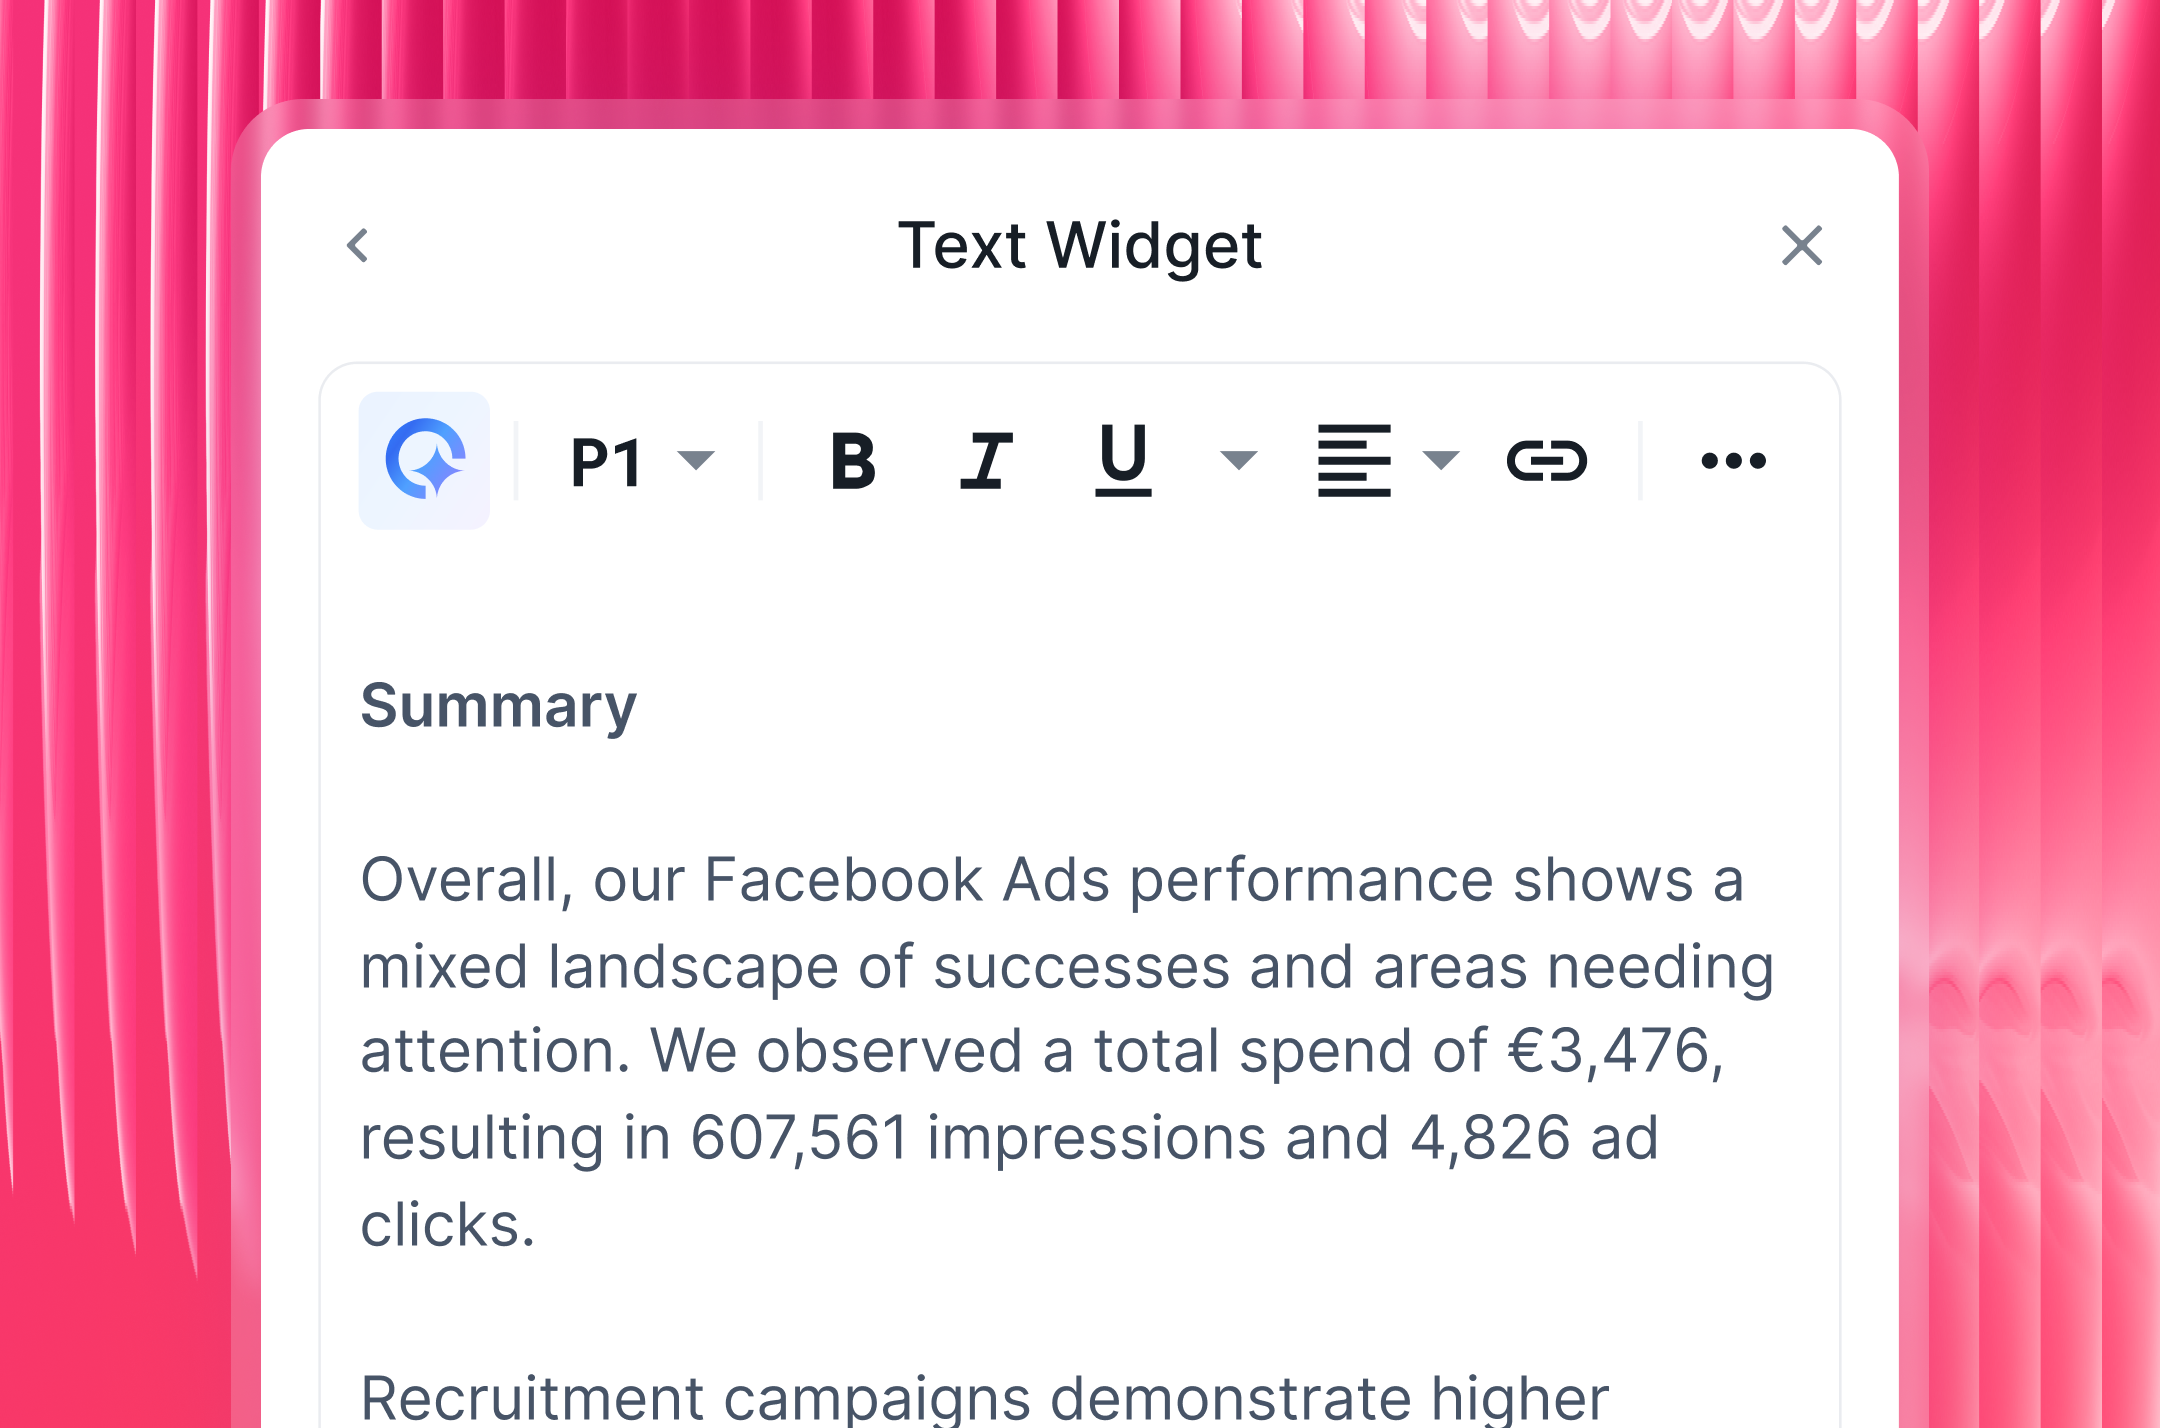
- Explain results in plain English: IQ Summaries add clear, on-brand performance insights you can edit and send straight to clients.
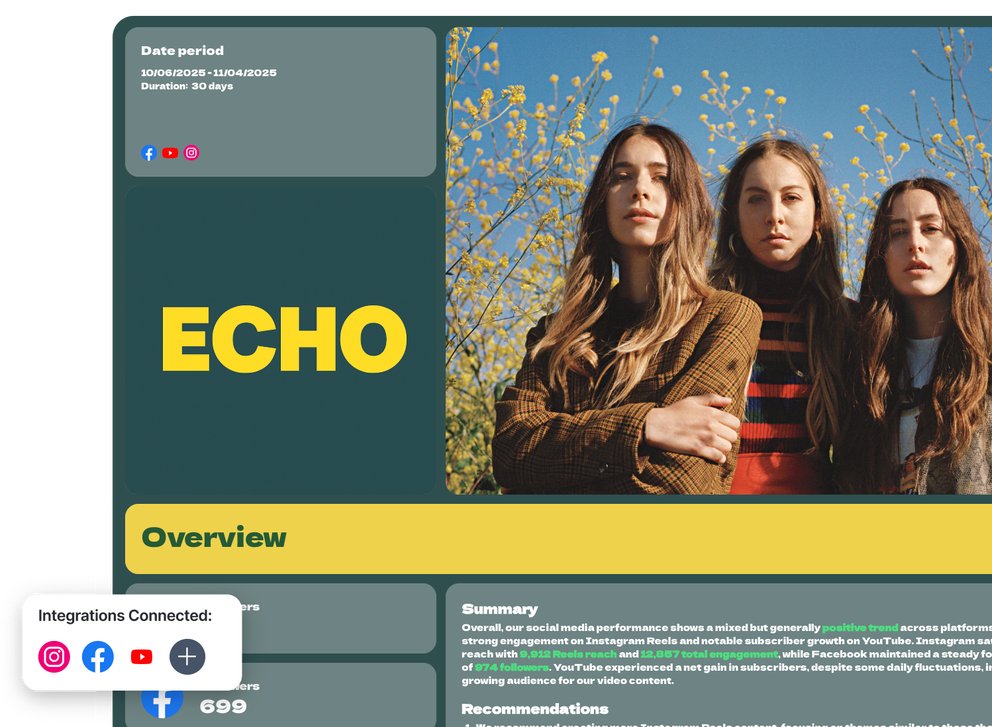
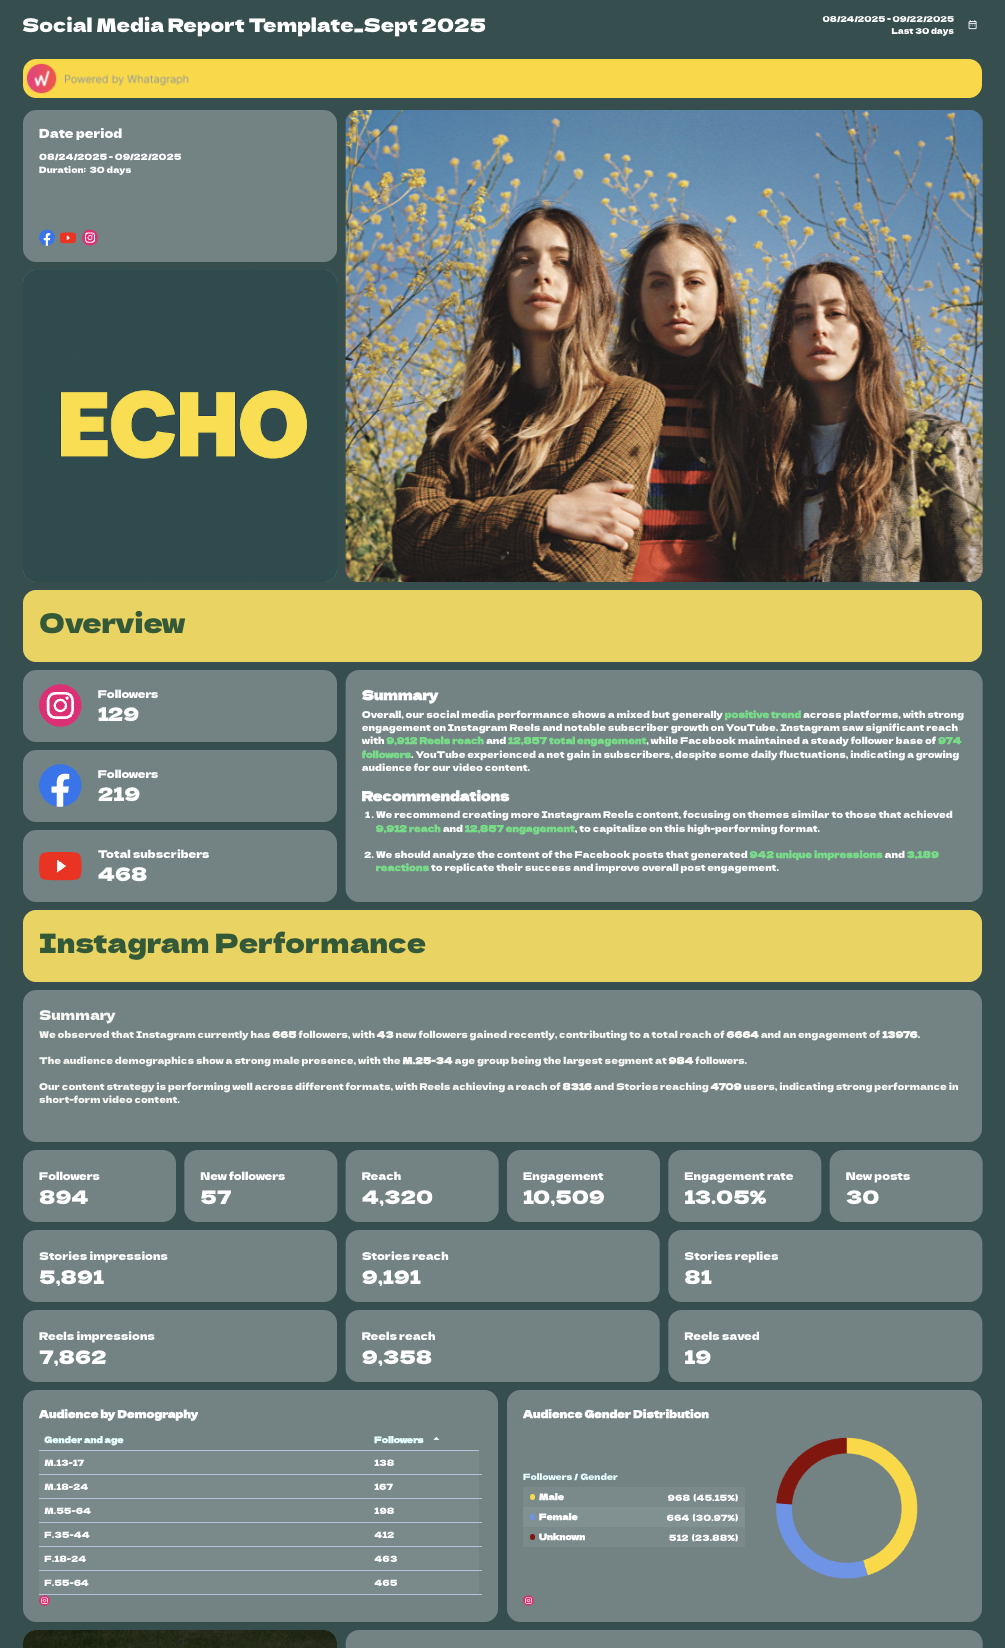
Here’s an example of a social media report template created on Whatagraph:
 Want full control? Start from a blank canvas and drag-and-drop your report layout using customizable widgets and visualizations.
With every widget, you can:
- Change the label, size, icons, and layout
- Apply custom formulas
- Match color schemes to client or agency branding
- Choose reporting periods, set currencies, or hide sections
- Insert or rearrange rows, columns, and headers
Pro tip: Save your reports as team templates and reuse them across clients. Better yet, use linked templates to automate report editing. You only edit the “master” template once, and your changes sync across every report linked to it.
4. Create internal dashboards to monitor performance
Want an internal analytics dashboard with more granular details? You can easily create one on Whatagraph called “Overviews”.
Use Overviews to:
- Track KPIs across all campaigns and clients in one place
- Flag campaigns that are underperforming or hitting targets
- Monitor Account Manager performance at a glance
- Set custom limits (e.g., ad spend caps) and goals (e.g., CTR benchmarks)
Slice by channel, client, manager, or region—whatever fits your ops structure. This lets your team make faster, smarter decisions without checking 10 different platforms.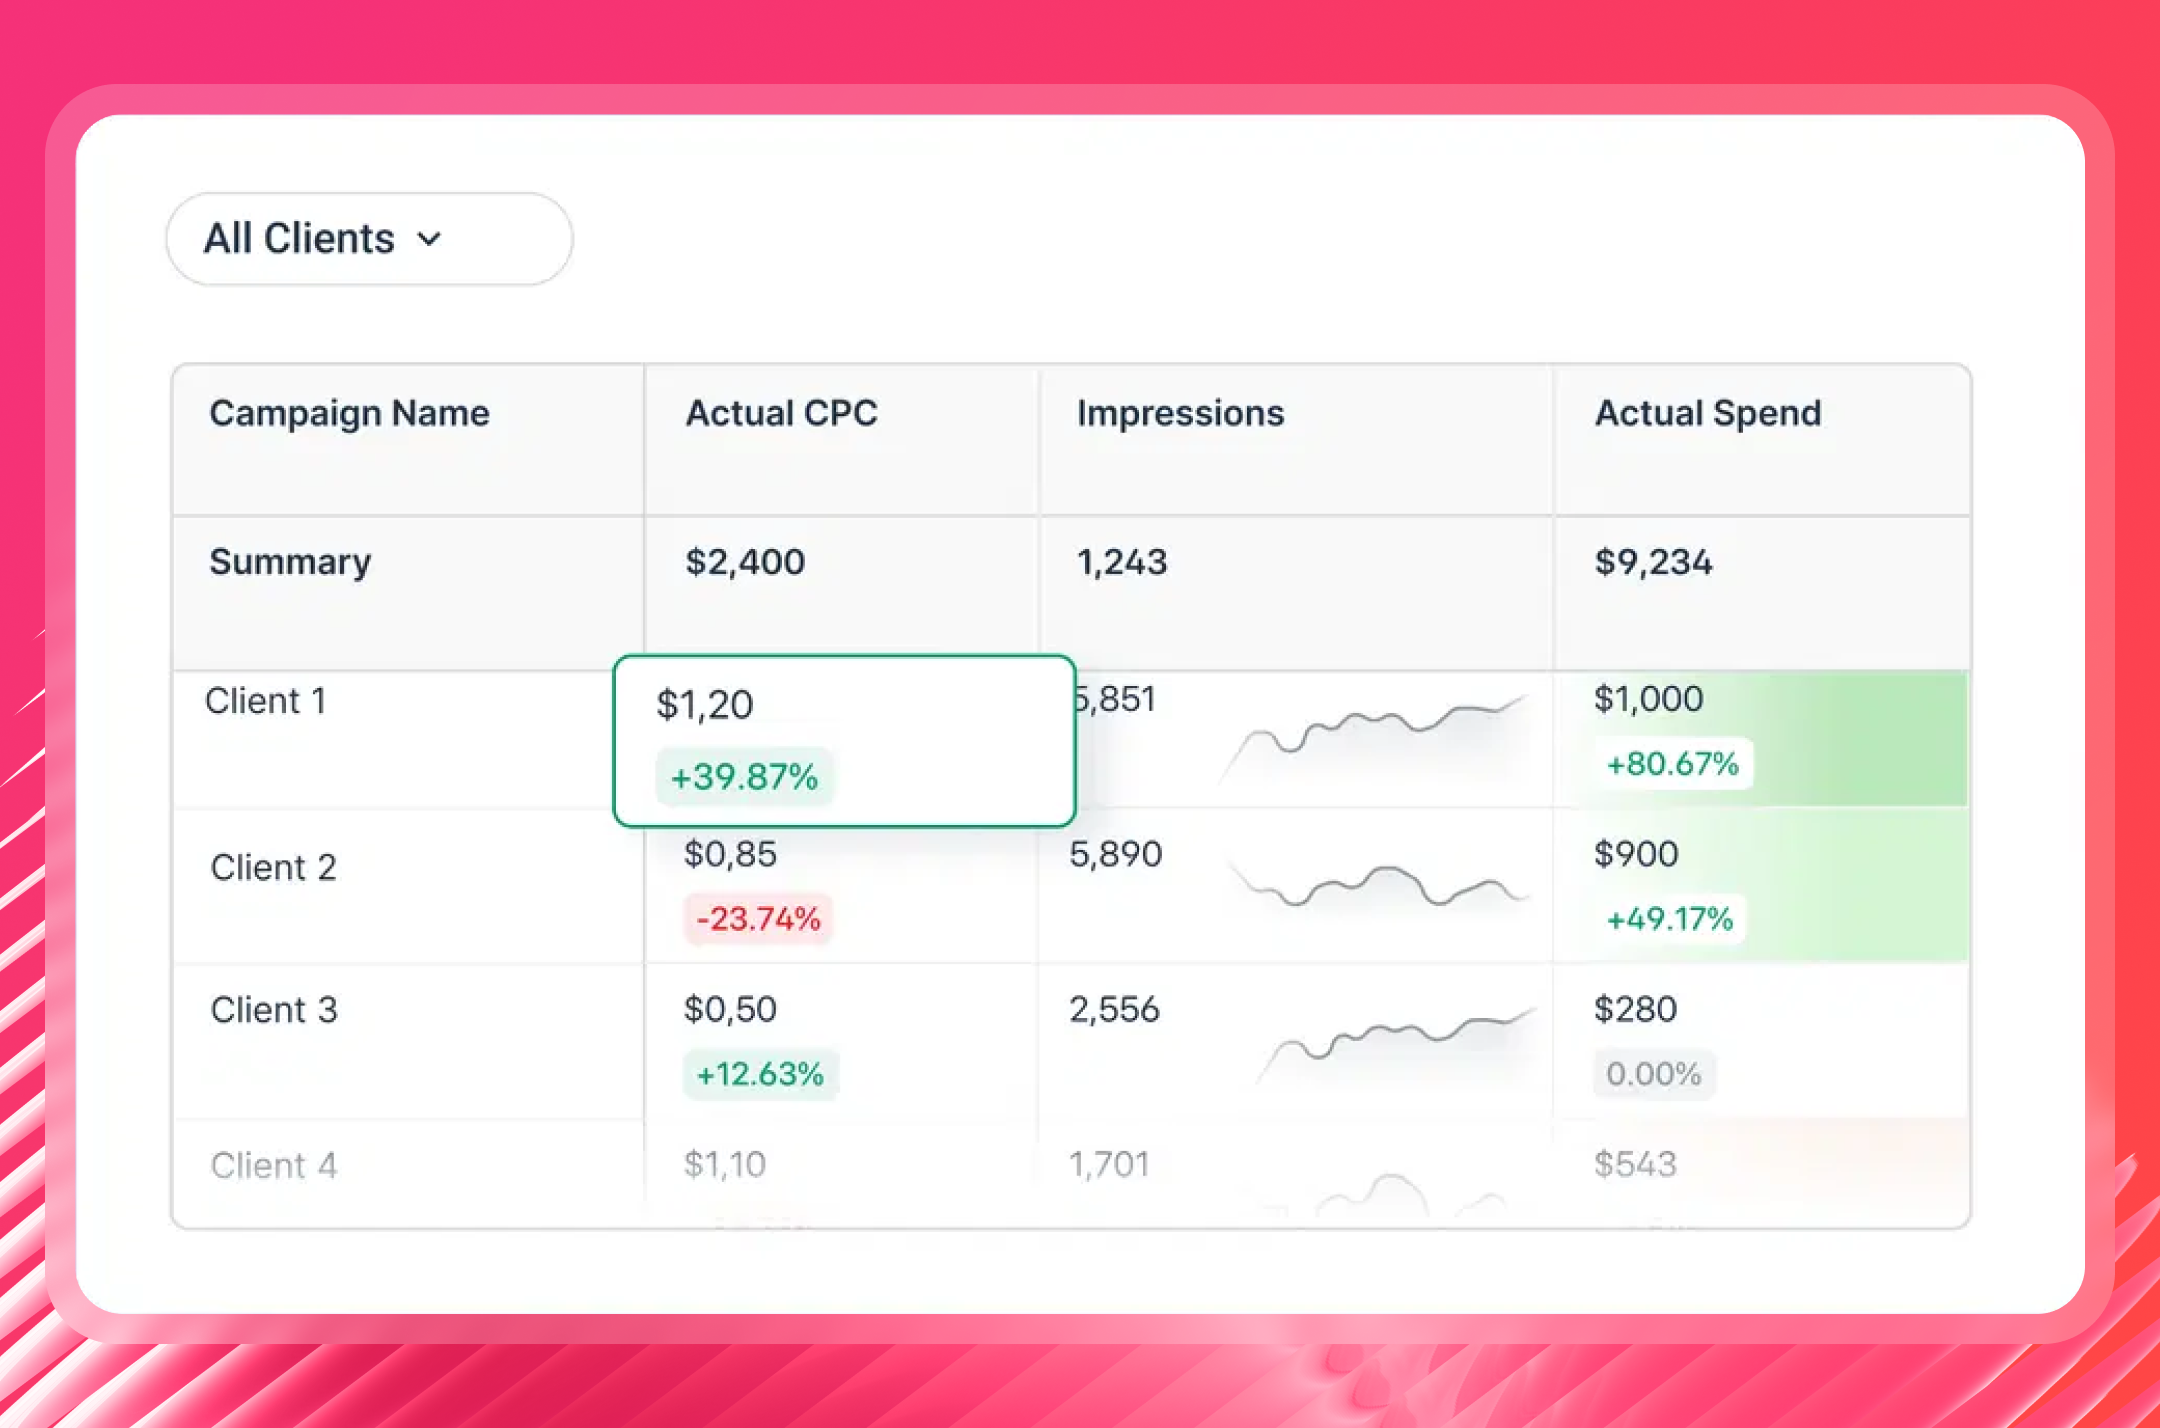
5. Use AI to write summaries and answer performance questions
Clients don’t want a wall of graphs and numbers. They want clear takeaways—and now, your team doesn’t have to write them from scratch.
Whatagraph AI helps you:
- Generate campaign summaries based on any data source and timeframe
- Choose short or long format, then tweak tone and messaging
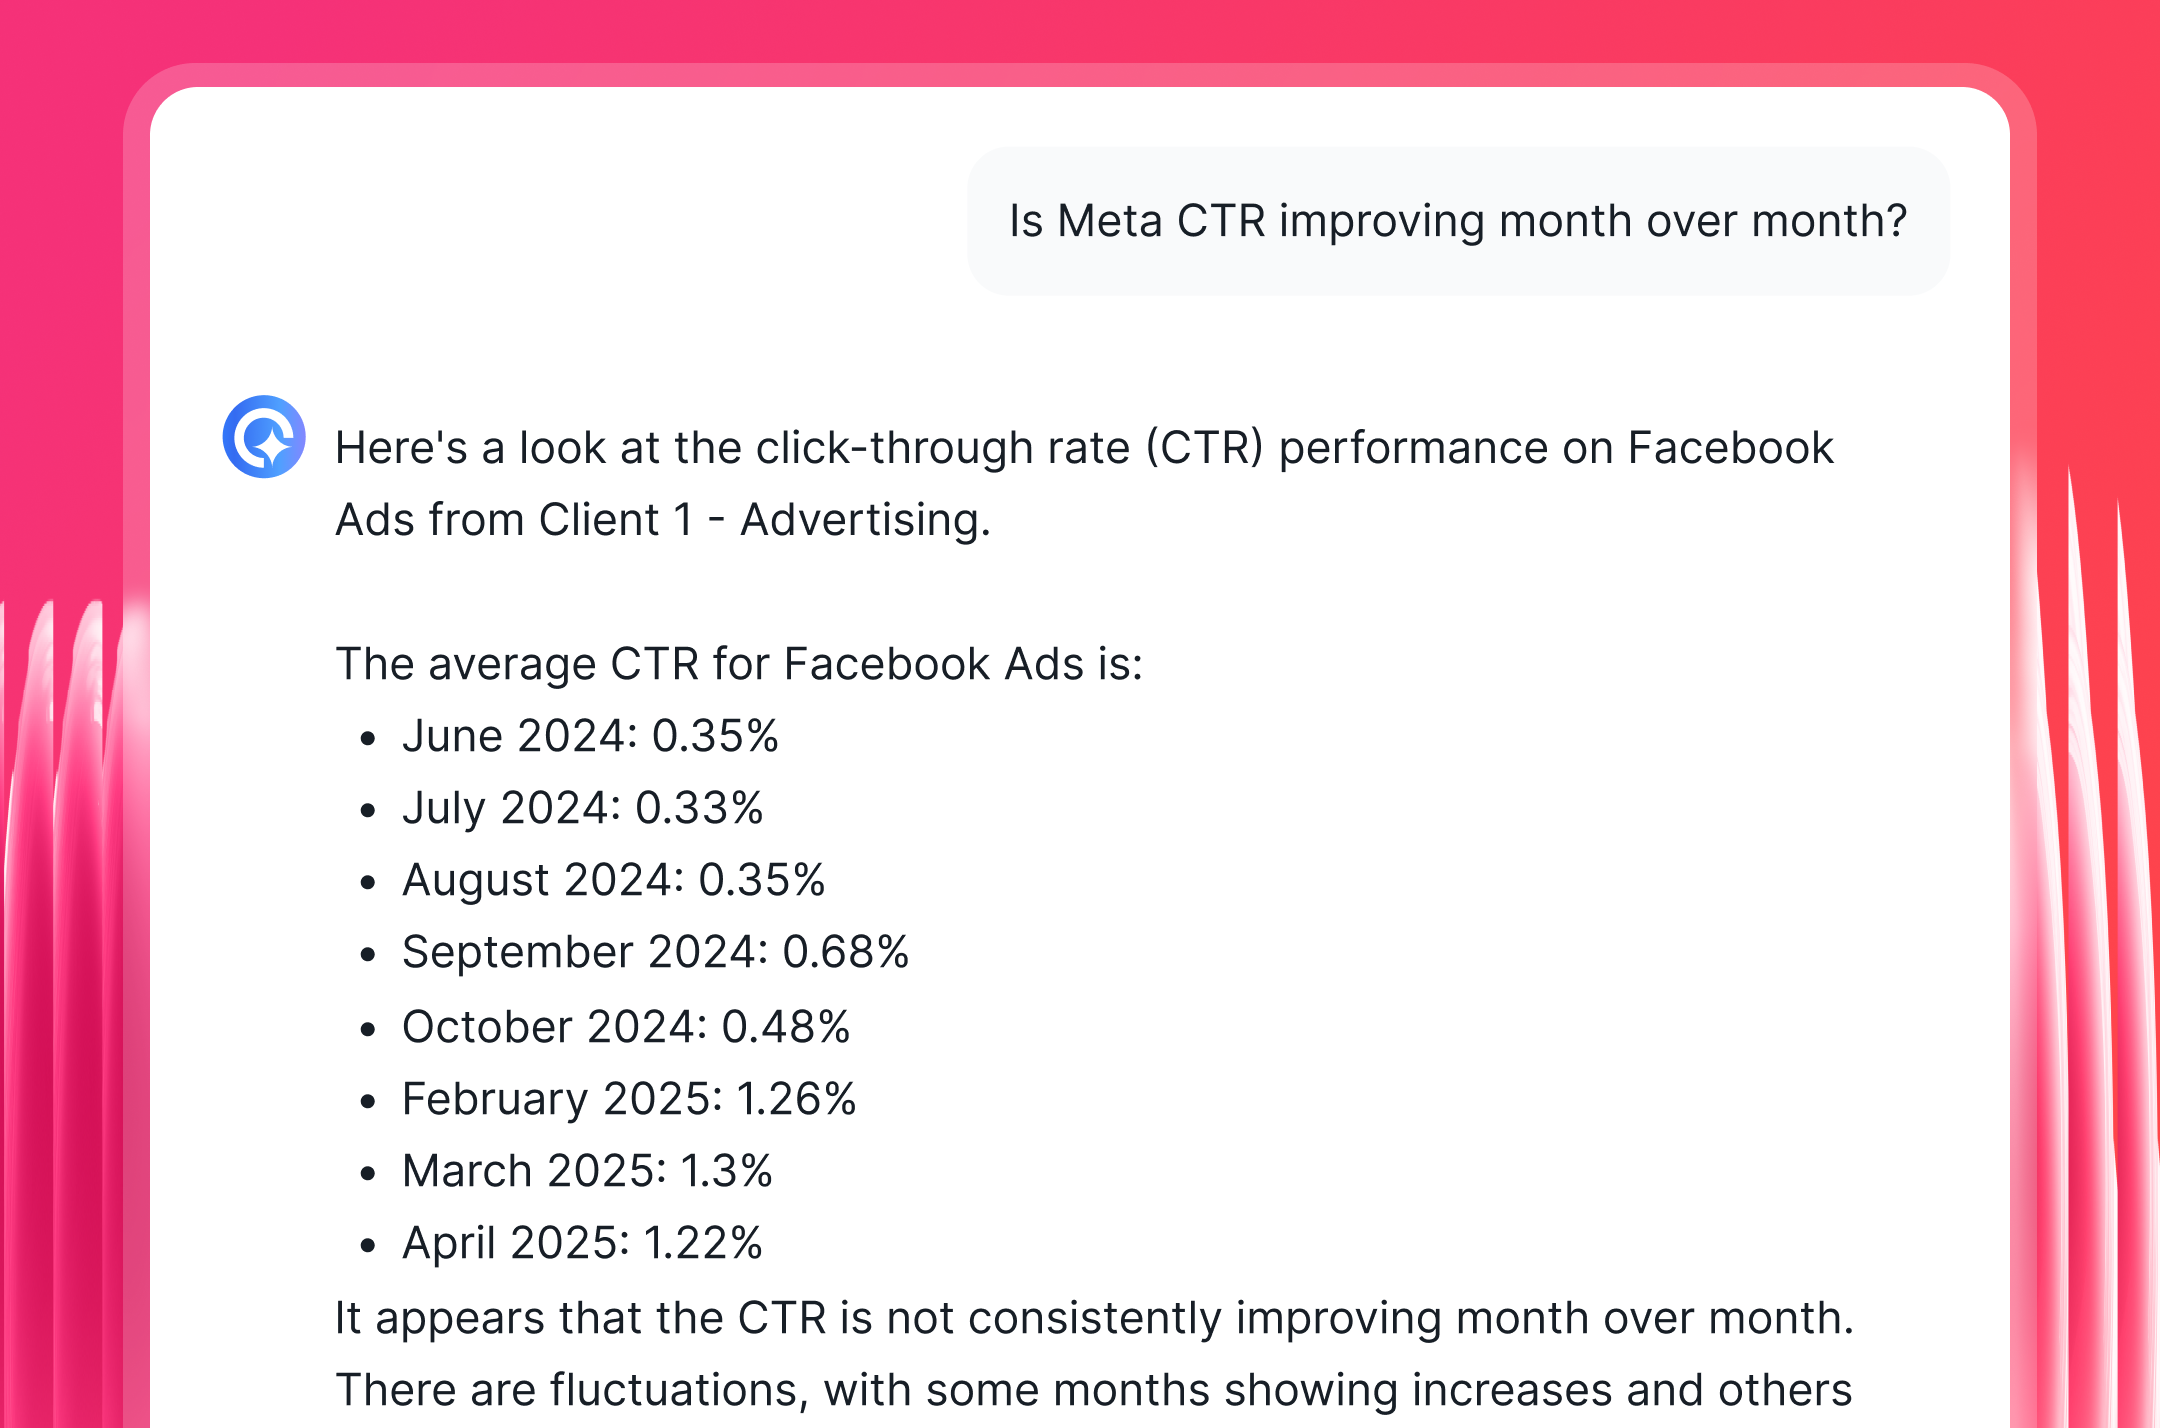
 For your internal team, they can ask any questions about campaign performance like “How many impressions did my social posts get?” and get real-time answers in plain English.
It’s like ChatGPT, but trained on your actual campaign data.
6. Share the report
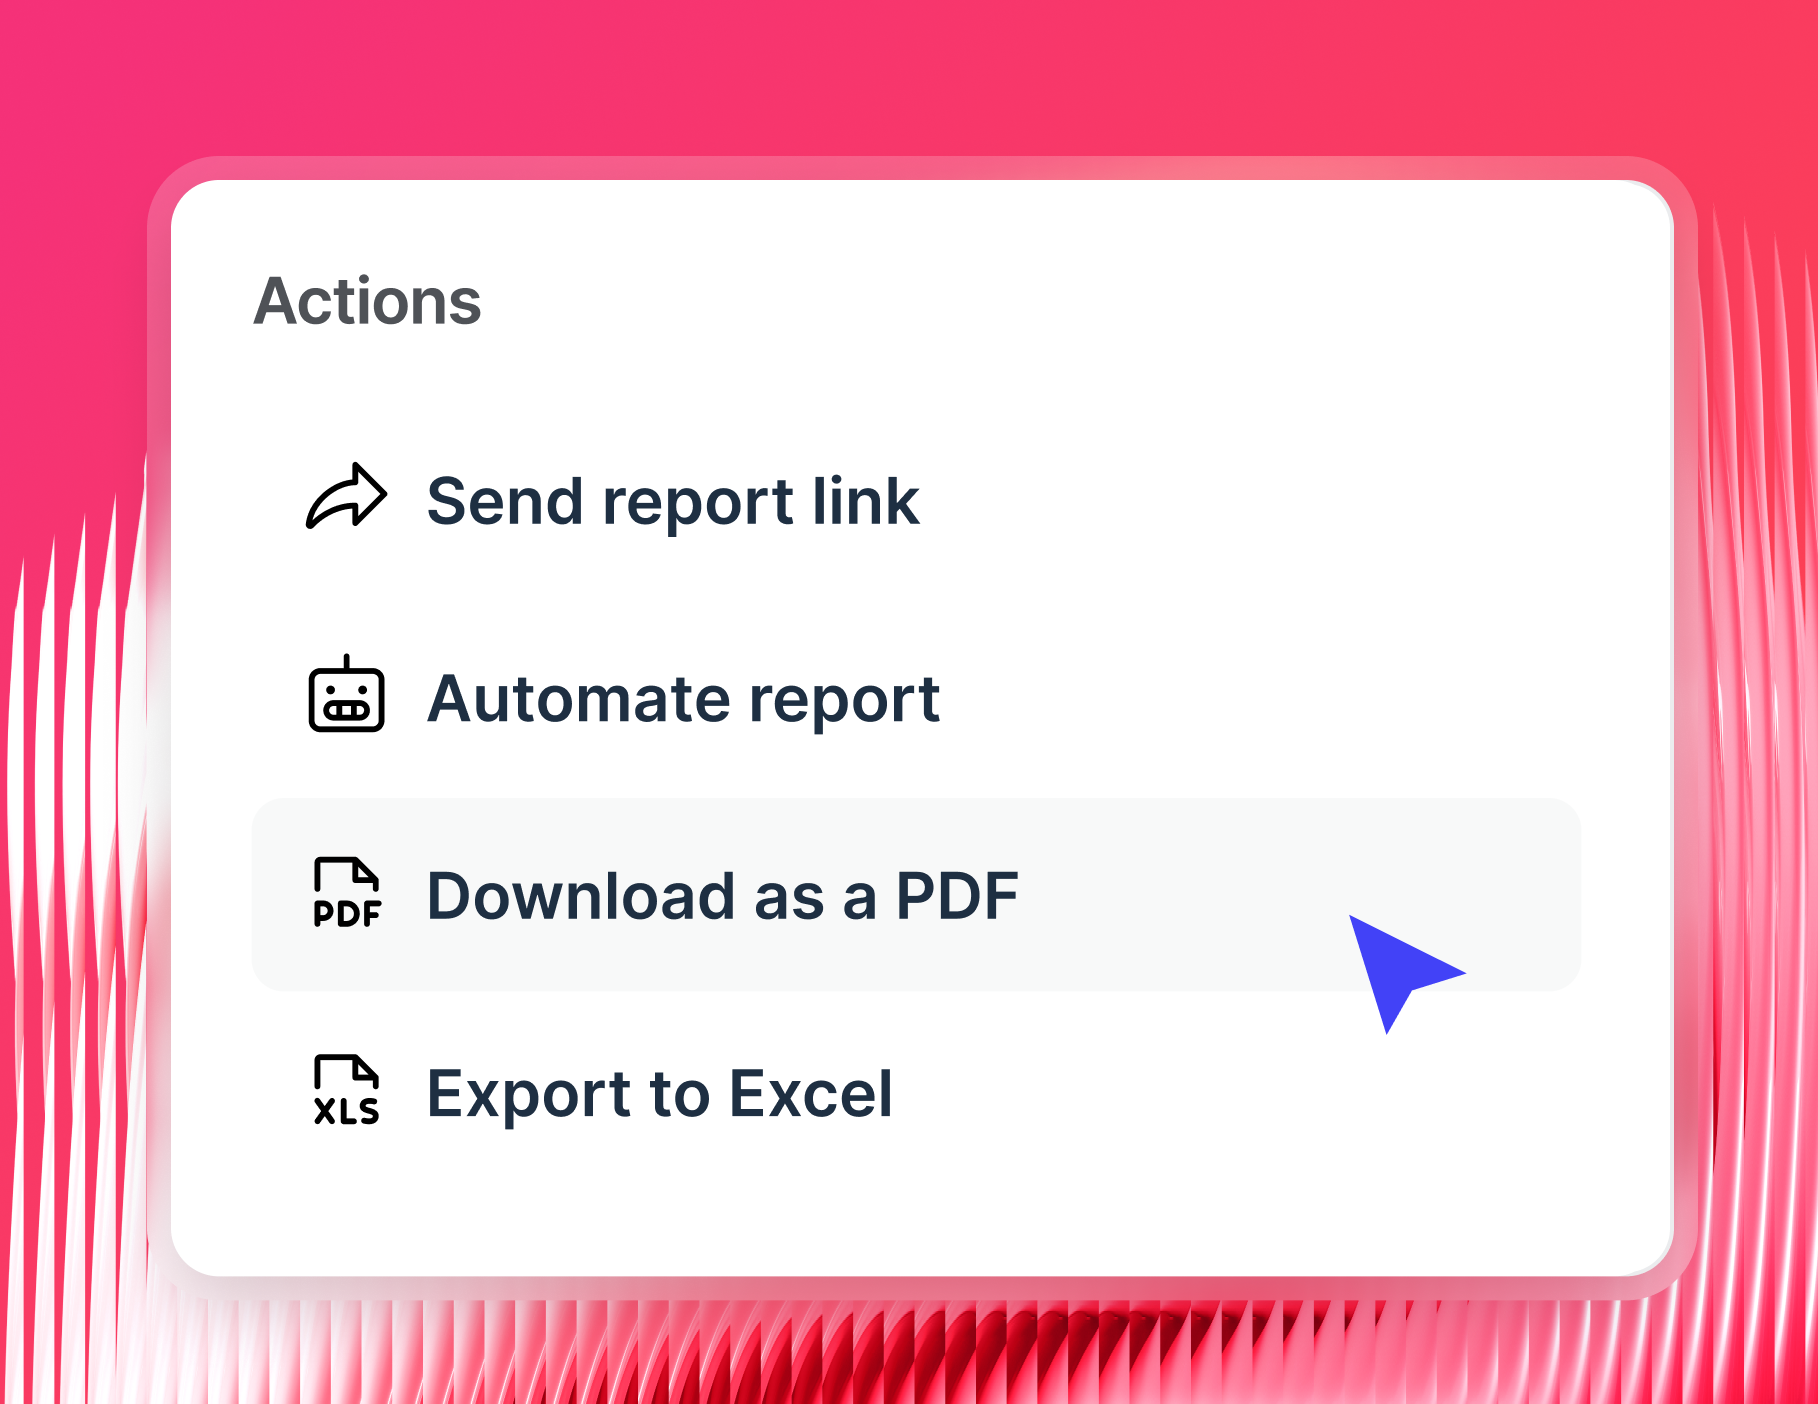
Once your report is ready, you have multiple sharing options:
- Automated emails: Schedule recurring delivery (weekly, monthly, quarterly)
- Live links: Clients get access to real-time data—no logins needed
- PDF or CSV exports: Perfect for internal archives or offline access
- White-label delivery: Use your own custom domain and sender details
You also have the option to turn on IQ Chat for clients or stakeholders, so they can ask questions about the data on a specific report and get back instant answers.
What metrics should you include in a social media report template?
Tracking the right social media metrics helps agencies measure what truly matters—not just vanity numbers.
The key is aligning your social media performance metrics with your overall social media strategy and client goals.
Below are the most important categories and KPIs every agency should monitor across all social media channels.
1. Performance Metrics
These metrics show how well your overall social media strategy is working.
- Impressions: How many times your social media posts were displayed—helps gauge overall reach across platforms.
- Reach: The number of unique users who saw your content—crucial for measuring campaign visibility and audience penetration.
- Click-Through Rate (CTR): Tracks how many users clicked on a post or ad versus how many saw it—vital for assessing content relevance and ad targeting.
- Conversion Rate: Measures how many users took a desired action after engaging—links your social media performance to real business outcomes.
2. Engagement Metrics
These key metrics reflect how your audience interacts with your content—great for optimizing content performance.
- Likes, Comments, Shares: Core engagement metrics that signal how compelling or share-worthy your content is.
- Engagement Rate: Combines likes, shares, and comments relative to followers or impressions—useful for comparing social media channels and formats.
- Saves or Bookmarks: Indicates value-driven content—especially useful on platforms like Instagram or TikTok.
3. Audience Growth Metrics
Follower growth helps you track brand momentum and long-term interest.
- Follower Count: The raw number of followers on a given platform—a basic signal of audience size.
- Follower Growth Rate: Shows how quickly your audience is expanding—helps evaluate the impact of your social media strategy over time.
4. Content Performance Metrics
Not all social media content performs equally—these key performance indicators help you pinpoint what works.
- Top-Performing Posts: Identifies your highest-reaching or most-engaged social media posts—useful for content strategy planning.
- Post Frequency: Tracks how often you’re posting on each channel—important for consistency and algorithm performance.
- Video Views / Completion Rates: Critical for measuring engagement on video-heavy platforms like TikTok, YouTube, and Instagram Reels.
5. Paid Social Metrics
If you’re running paid campaigns, these metrics help optimize budget and ROAS.
- Cost Per Click (CPC): Shows how much you're paying for each engagement—key for managing ad spend efficiently.
- Return on Ad Spend (ROAS): Directly ties your social media performance to financial outcomes—essential for client reporting.
- Frequency: Tells you how often the same user sees your ad—too high, and you risk ad fatigue.
What should a social media report include?
A great social media marketing report goes beyond surface-level metrics—it should give stakeholders a clear view of social media performance, how it ties into business goals, and what to do next.
Here’s what to include:
Executive summary
Start with a high-level overview. Wins, challenges, and next steps in plain language (this is where Whatagraph IQ Summaries shine).
Cross-channel performance overview
Show overall impressions, reach, clicks, CTR, conversions, and ROAS across all channels. This gives clients a single snapshot of how campaigns performed.
Channel-by-channel breakdown
Compare how each platform (Facebook, LinkedIn, Instagram, etc.) performed. Highlight strengths and where optimizations are needed.
Audience engagement insights
Demographics like age, gender, location, language, and device. Helps show whether campaigns are reaching the right people.
Content Performance
A breakdown of top-performing posts—engagement rate, clicks, video views, saves. Crucial for refining content strategy.
Next Steps / Recommendations
End with clear, actionable advice based on the data: where to double down, what to pause, and how to optimize marketing performance.