Discover a Powerful Funnel.io Alternative
Whatagraph is an easy-to-use, all-inclusive platform to connect, visualize, and share your marketing data with excellent support and automation features. This Funnel.io, alternative comes with advanced data visualization capabilities, including live dashboards and report-sharing automation.
- No tech background needed
- Easy and quick setup
- Accurate and reliable data


3 Reasons to Choose Whatagraph as Your Funnel.io Alternative
All your work in one intuitive platform
Funnel.io focuses on working with marketing data before exporting it to other tools for visualization and storage. Whatagraph, on the other hand, covers the entire data journey from any source to a desired destination. You can easily connect, organize, visualize, and share data in one platform.
Stunning native visualizations
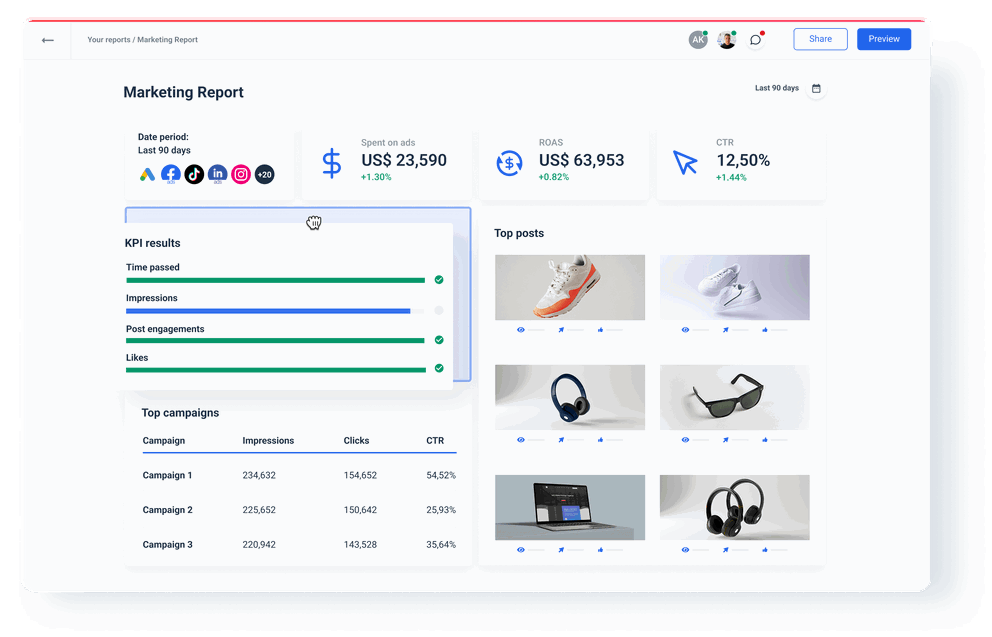
While Funnel provides a couple of basic widgets for internal use, Whatagraph has an intuitive drag-and-drop builder to create versatile marketing data visualizations. It’s just as easy to create a single dashboard as a report with multiple tabs and pages.
No data analytics knowledge needed
Funnel’s learning curve is still steep for some users despite all available training resources and support documentation. On the other hand, connecting, organizing, visualizing, and sharing data in Whatagraph is fast and easy and doesn’t require additional data analytics proficiency or specific tech knowledge.
All-in-One Funnel.io Competitor
Complete all your data-related tasks in one place. This includes fully-developed workflows for connecting data from multiple marketing platforms, visualization in drag-and-drop dashboards and reports, and automated sharing with clients and stakeholders.
 | ||
|---|---|---|
| General points | ||
| Pricing | ||
| Support | ||
| Connect | ||
| Native integrations with all popular marketing sources | ||
| One platform approach | ||
| Organize | ||
| Data organization capabilities | ||
| Instant visualization | ||
| Ad hoc rule changes from the report/dashboard | ||
| Visualize | ||
| Data visualization | ||
| Media widgets | ||
| Visual customization | ||
| Linked templates | ||
| Branding and white-labeling | ||
| Cross-channel overviews | ||
| Share | ||
| Marketing reporting automation | ||
| Data export in spreadsheet format | ||
| Data transfer to a warehouse | ||
| Links to live dashboards | ||
Funnel.io Pros and Cons – What Do Users Say?
Simplicity for data integration, up to 2 hours data freshness, awesome support, reliability of software.
Scheduling is not possible, which is quite annoying when you are developing business dashboards (and maybe you want you data updated every morning before the 9:30am meeting with the biggest stakeholders of the project.
Dashboarding features are limited and could be improved.
Sometimes it's impossible to get metrics that you get in the original channel you got the data from due to API issues or how they calculate their views and levels.
Graph and other data presentation has some limitations, but these issues can often be bypassed by rethinking and simplifying data presentation (which is usually a good direction to take anyway.)
Frequently Asked Questions
What integrations does Whatagraph support?
Whatagraph supports a variety of data management and analytics platforms including social media such as LinkedIn and Facebook, web analytics such as Google Analytics, paid media such as Google Ads, and CRMs such as HubSpot and Salesforce.
Is Whatagraph a data integration tool?
Yes, Whatagraph has data integration functionality, but unlike Funnel.io, Whatagraph also has data organization, visualization and sharing capabilities. Whatagraph is an all-in-one marketing data platform that digital marketing agencies can use to connect, organize, visualize, and all marketing data, with no need for additional tools.
Is Whatagraph a good choice for small businesses?
Yes, Whatagraph is a good choice for small businesses that want to maintain accurate data tracking and effective collaboration within the company. Using reports with high-level business metrics, business managers can track product sales and marketing campaigns or focus on more granular KPIs for individual teams.
Is Whatagraph a worthy Funnel.io competitor?
Yes, Whatagraph is a worthy Funnel.io competitor. Funnel.io is an ETL tool that uses third-party dashboard providers like Looker Studio and Tableau to visualize the collected data, while sharing is only possible to other platforms.
Whatagraph, on the other hand, offers native visualization, an intuitive cross-channel dashboard builder, and the ability to share live dashboards and automate reporting to clients and stakeholders.
Funnel.io has more destinations for data transfer, but the learning curve is steep. With Whatagraph, though, you can easily set up and manage data transfers to a cloud-based data warehouse without any previous data knowledge.
What are the Funnel.io advantages?
The advantages of using Funnel analytics tool are the centralized data aggregation, data transformation and normalization features, real-time insights, a large number of connectors, and integrations with popular BI tools.
What does Funnel.io do?
Funnel.io product details from GetApp describe it as a marketing data hub designed to help marketing teams connect data from any marketing platform; store, organize, and share it with any visualization tool or data warehouse – all without writing a single line of code.
What are the Funnel.io disadvantages?
The disadvantage of using Funnel.io is that it is not one platform to handle all your data management tasks. It is more focused on working with data and exporting them to other tools for visualization. Another disadvantage is the learning curve, as it requires new users to invest some time before they can use it effectively. The third disadvantage is the price, as it’s often more expensive than Whatagraph while at the same time offering very basic visualization options.
How does Funnel.io pricing work?
Funnel.io pricing has three plans — Starter, Business, and Enterprise. Your subscription cost is based on the number of flexpoints.
Flexpoints are capacity-based units that measure your usage of connectors, destinations, and other data features. Funnel allows you to re-distribute your flexpoints by toggling features on and off, or adding more flexpoints to increase your capacity.
How many flexpoints and how much it will cost depends on the number of accounts you connect and report types you select.
All this doesn’t tell you exactly what your subscription will cost, as some destinations require more flexpoints than others.
Are Funnel.io reviews mostly positive or negative?
Funnel.io reviews are mostly positive, with users praising a large number of integrations and data analytics capabilities. However, those who switched to Whatagraph or other competitors to Funnel also complained about limited visualization options and the learning curve needed to master the tool.
