13 Best Marketing Analytics Tools & Software: 2026 Reviews
There are hundreds of marketing analytics tools and software out there — how do you pick the one that best fits your needs?
To make your search easier, we reviewed 13 best marketing analytics tools highly loved by marketers and data analysts in 2026.

Mar 19 2026●10 min read


Whether you’re an agency owner, data analyst, or an in-house marketer, you’re probably looking for a marketing analytics tool that:
✅ Is easy to set up and use
✅ Integrates with all your marketing channels
✅ Is highly customizable (in terms of data and reports)
✅ Comes with extensive ready-made templates
✅ Is dedicated to customer success and support
In this article, we’re going to take you through 13 best marketing analytics tools that check these boxes.
13 Best Marketing Analytics Tools and Software in 2026
Before we dive into the details, here’s a list of all the tools we’ll be reviewing in this article:
- Whatagraph
- Metrics Watch
- Google Analytics 4
- Semrush
- Hubspot
- Mixpanel
- Tableau
- Supermetrics
- Sprout Social
- Heap
- Funnel
- Adobe Analytics
- Matomo
Let’s dive in.
1. Whatagraph
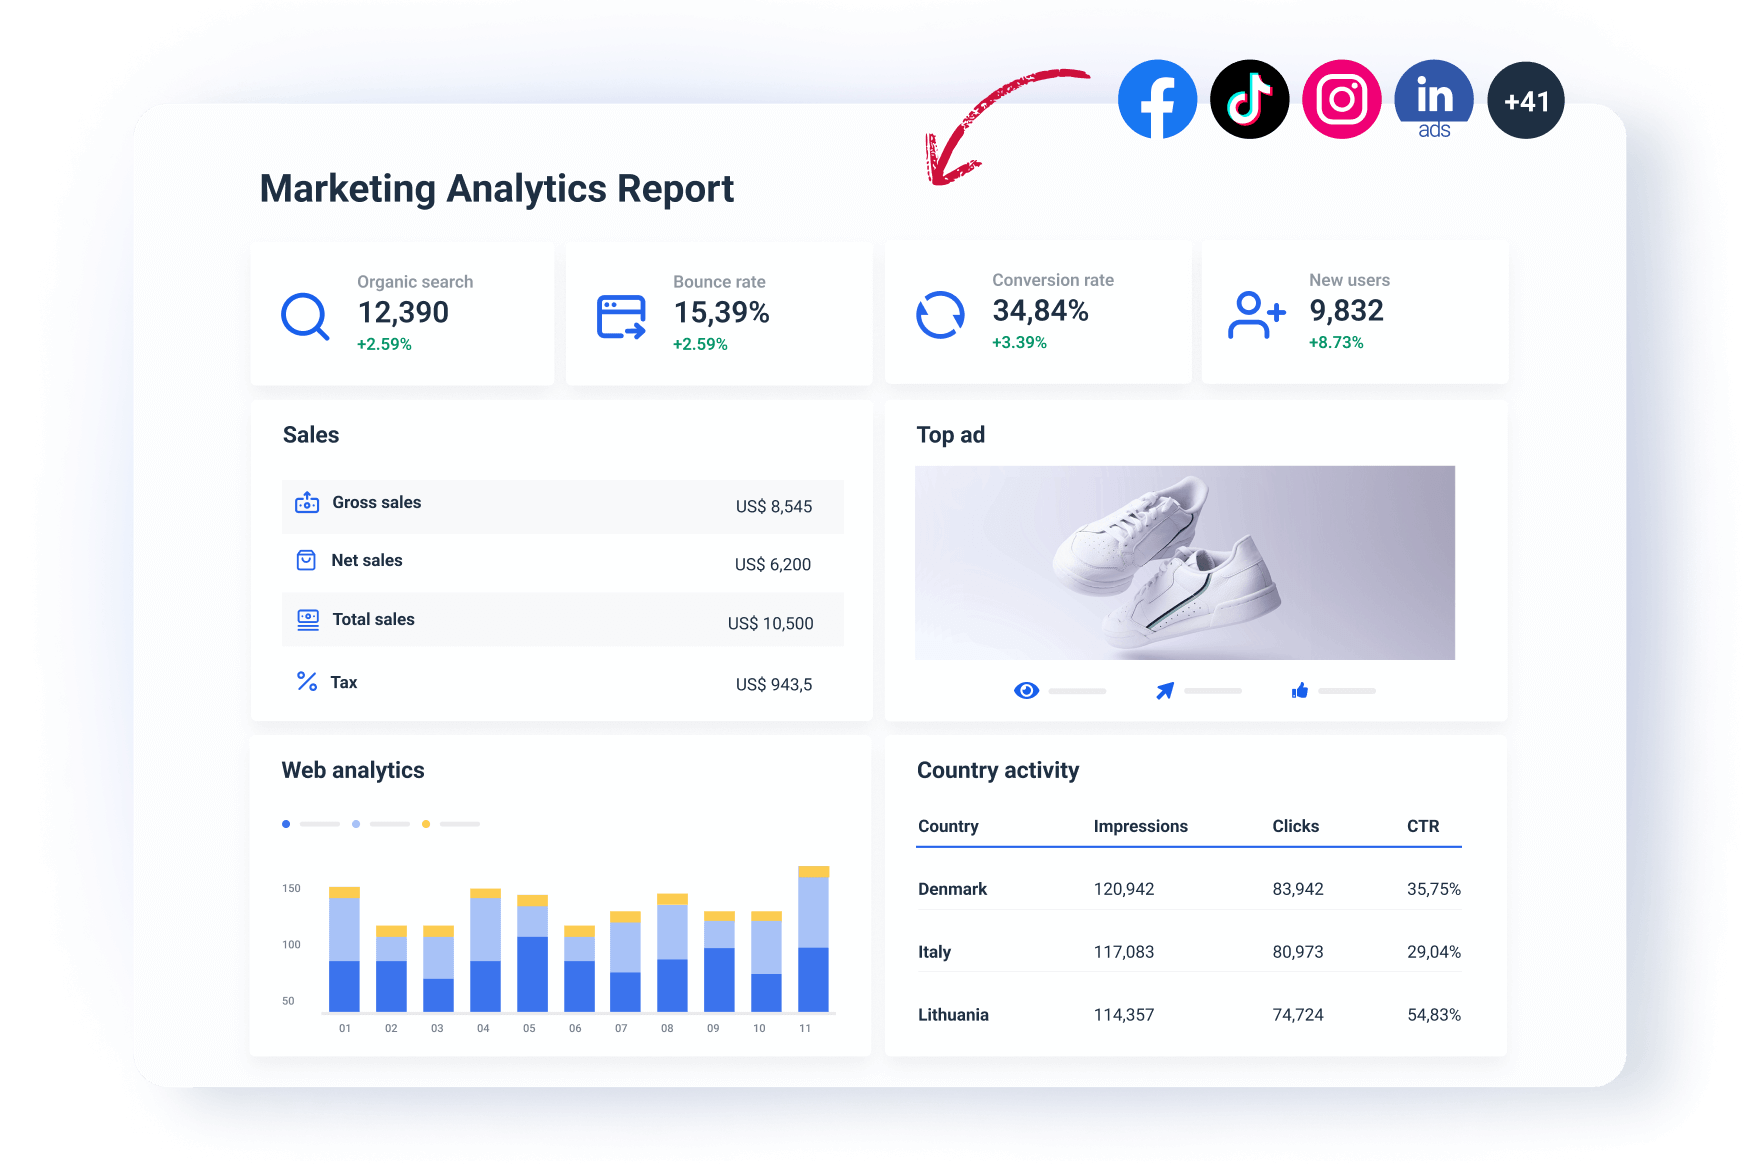
Whatagraph is an all-in-one marketing data platform which makes it ridiculously easy to collect, analyze, and report on your data—whether that’s PPC, social media, website performance, or more.
Unlike other tools like Looker Studio or Tableau, you can get Whatagraph up and running in a few hours (not days or weeks).
You also don’t need to hire a data scientist or spend thousands of dollars on an implementation partner.
Anyone on your team—whether that’s an Account Manager or a data analyst—can start analyzing data and building reports right away.
In a nutshell, here’s how Whatagraph works:
- Connect to your data sources and channels in a few clicks. Your data will flow in automatically.
- Organize your data, teams, and clients on one platform. Make custom metrics and dimensions, and blend data sources together.
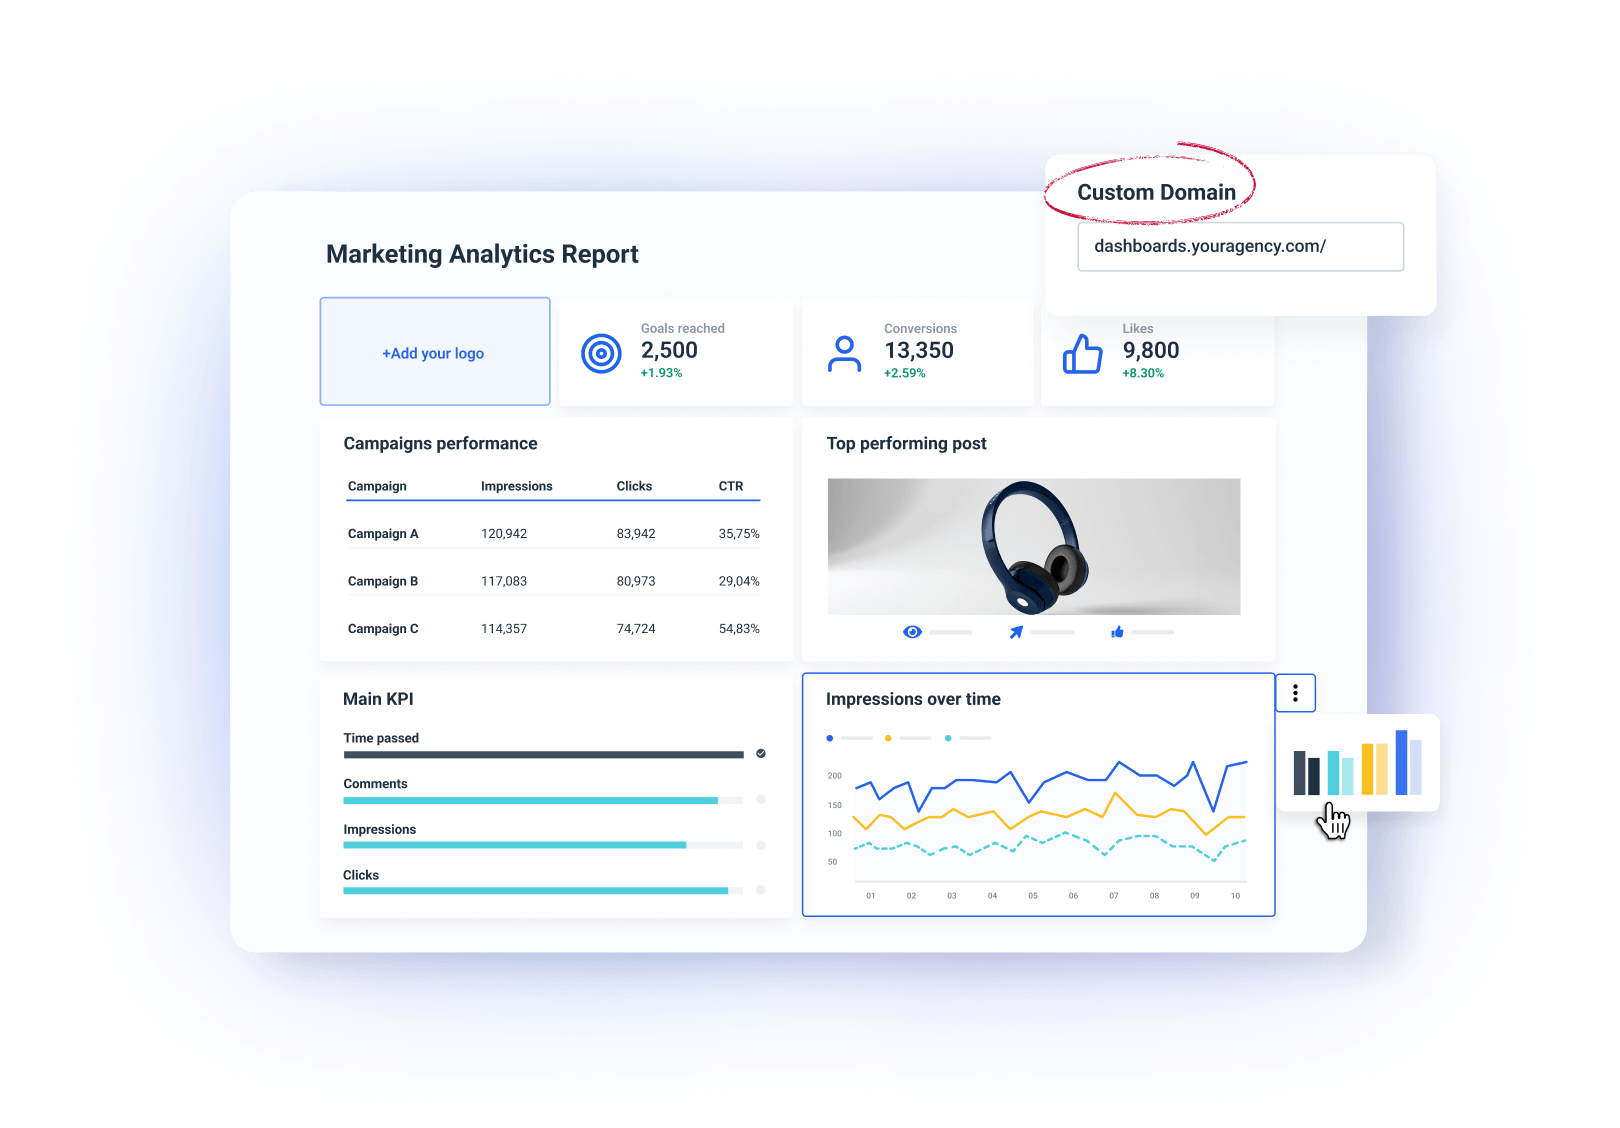
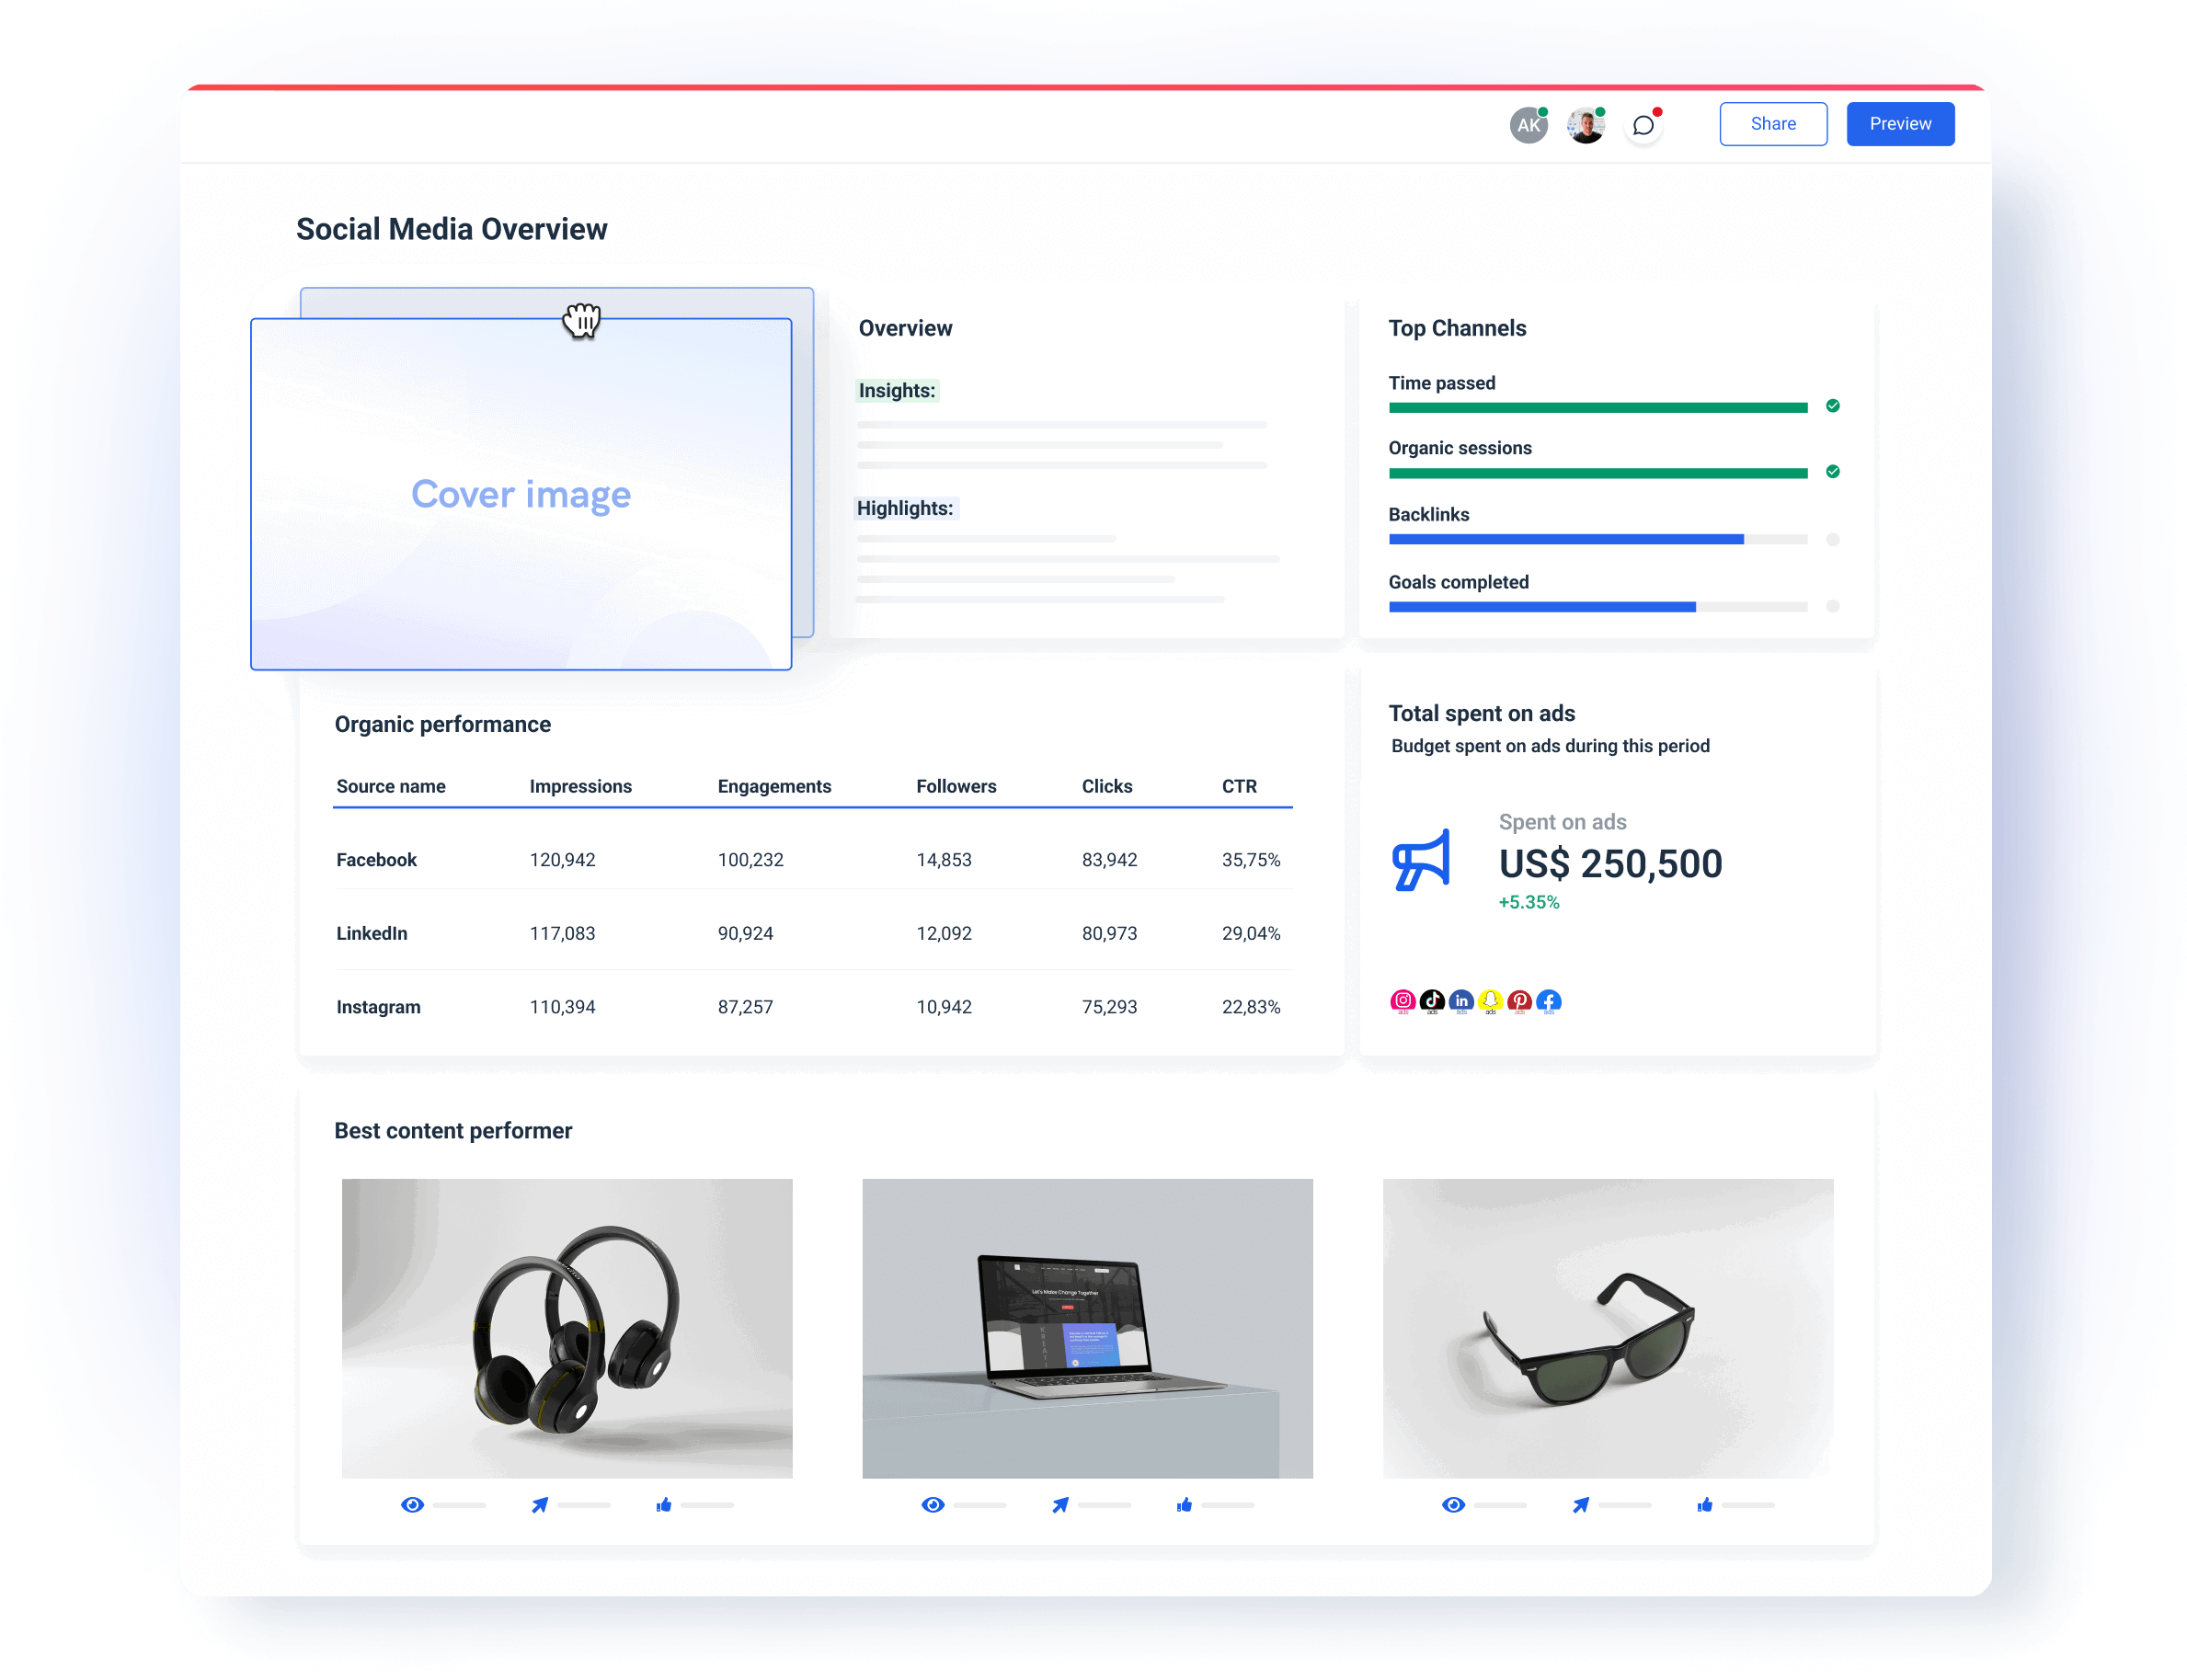
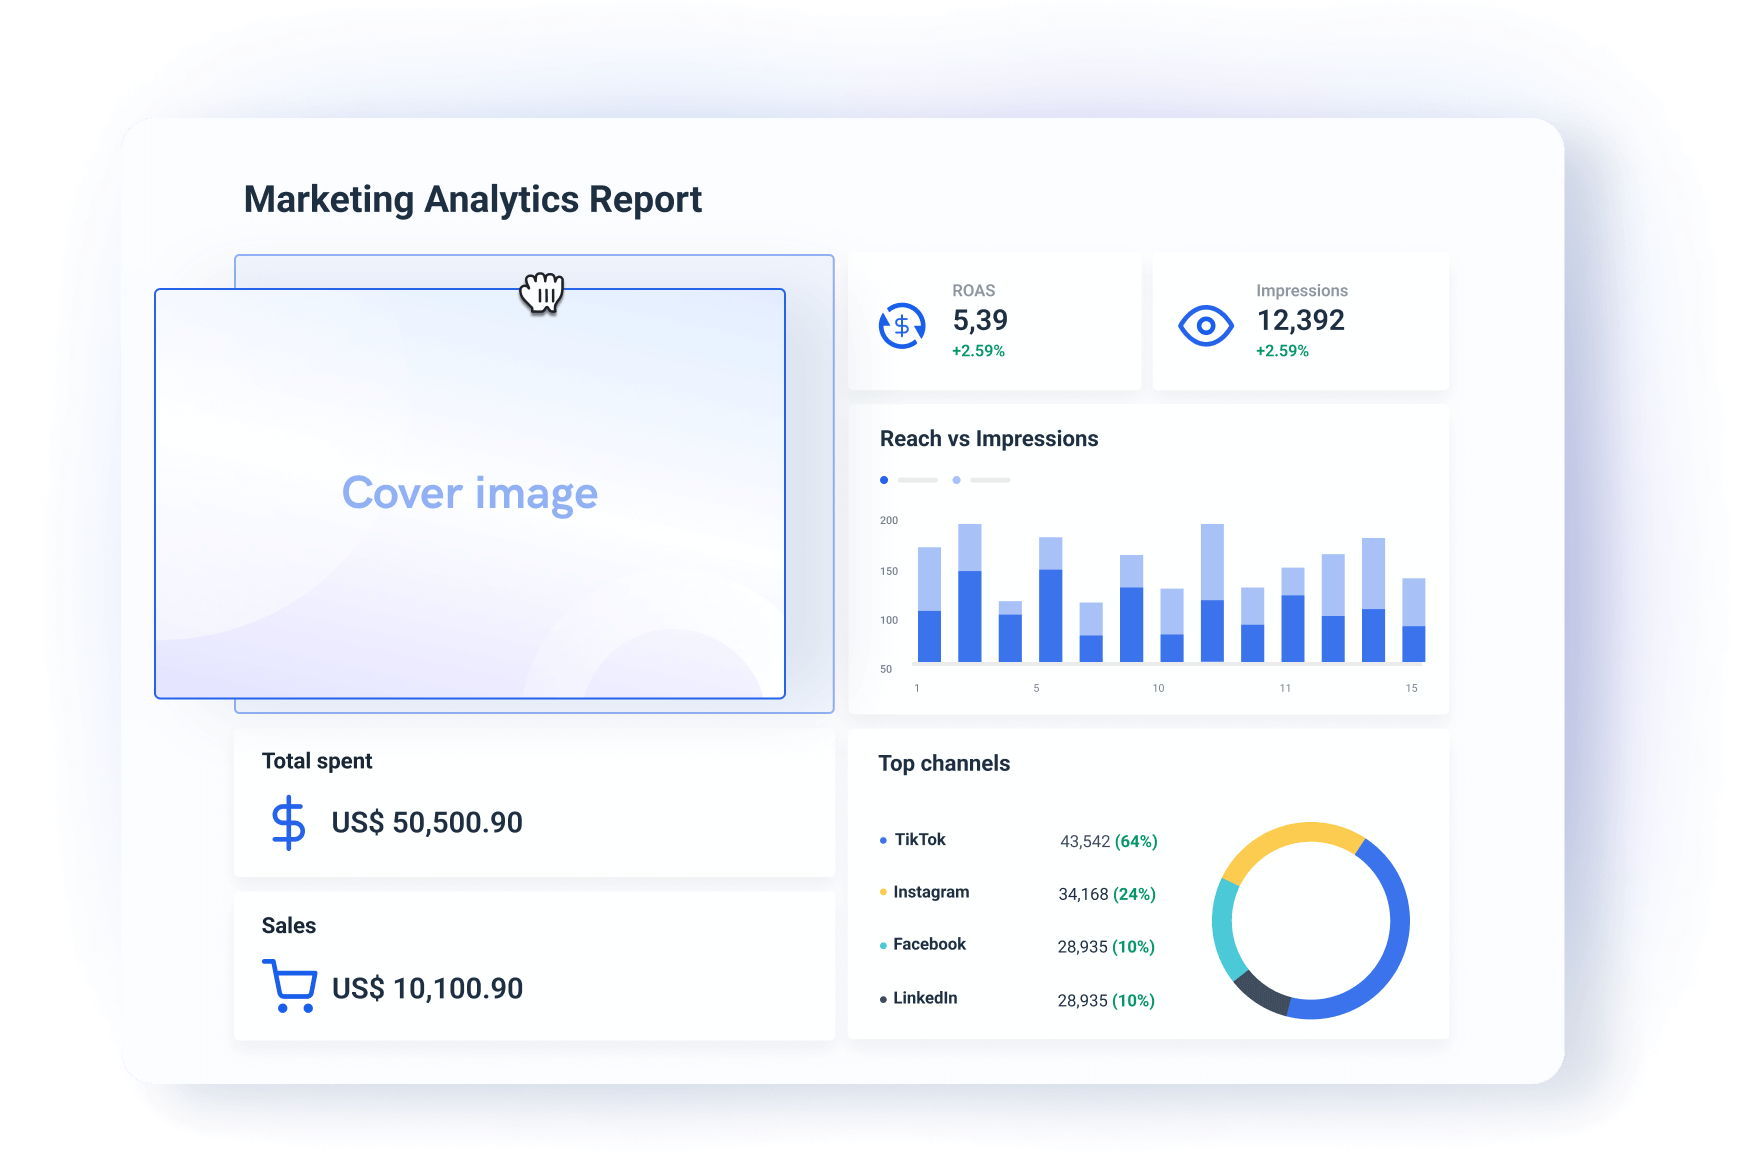
- Visualize your data using drag-and-drop widgets or ready-made templates. Create white-labeled reports with custom logos, domains, and color schemes.
- Share reports as live links, PDFs, Excel spreadsheets, or automated emails.
All of this on one fast and easy-to-use platform means:
✅ You don’t have to waste time manually compiling data from disparate sources.
✅ You can save up to 40 hours a month on analyzing data and creating reports.
✅ Your data is organized on one platform and you have a clear view of marketing performance.
✅ Your clients or the C-Suite clearly sees the value of your campaigns.
✅ It’s easy to onboard new employees and clients.
One of our customers said it best:
"To me, Whatagraph is like the Tesla or Mercedes of digital analytics tools, their clean and simple way to present complex marketing data. I highly recommend it to anyone working with marketing analytics who values efficiency and clarity in their reporting.”
But does Whatagraph actually check all the boxes that you’re looking for? Let’s take a look.
#1. Seamlessly integrates with all major marketing channels.
Scattered data is frustrating, to say the least.
Without a marketing analytics tool, you or your team might be taking 4-6 hours a week just to compile data from disparate channels.
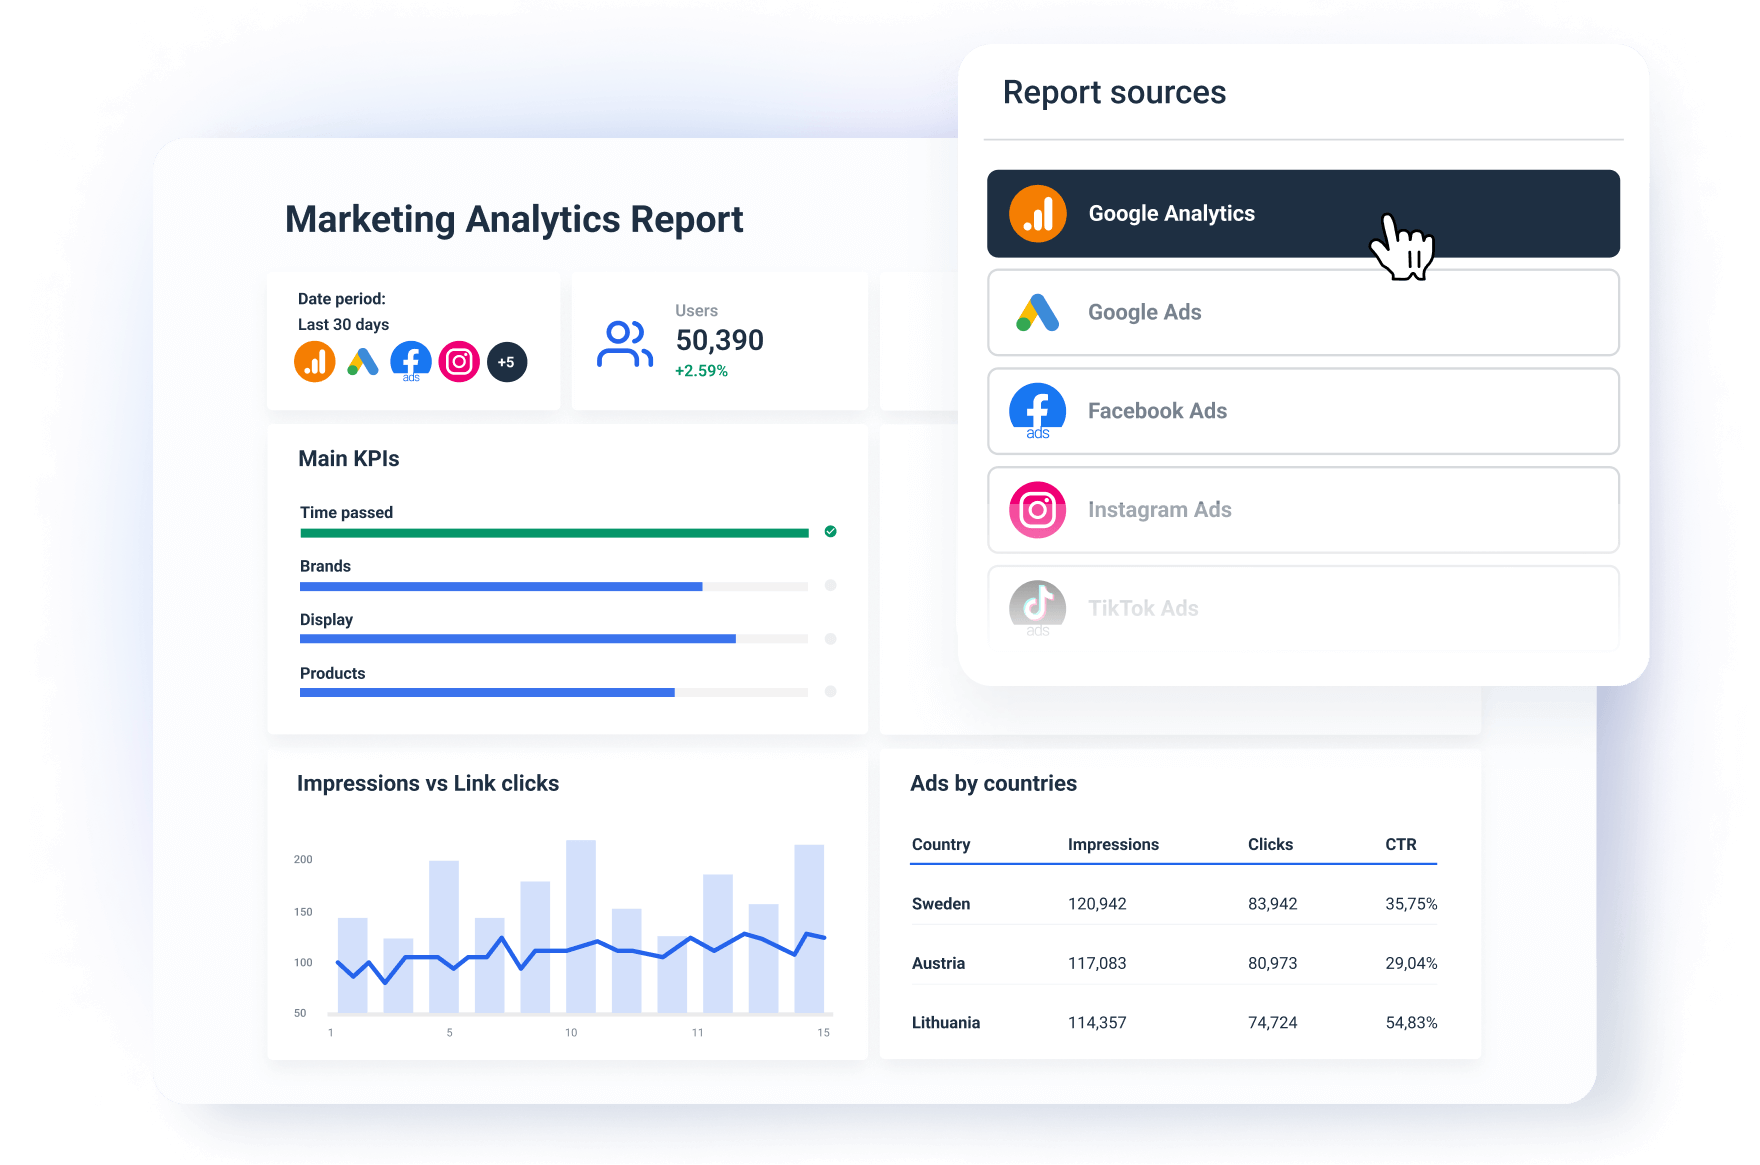
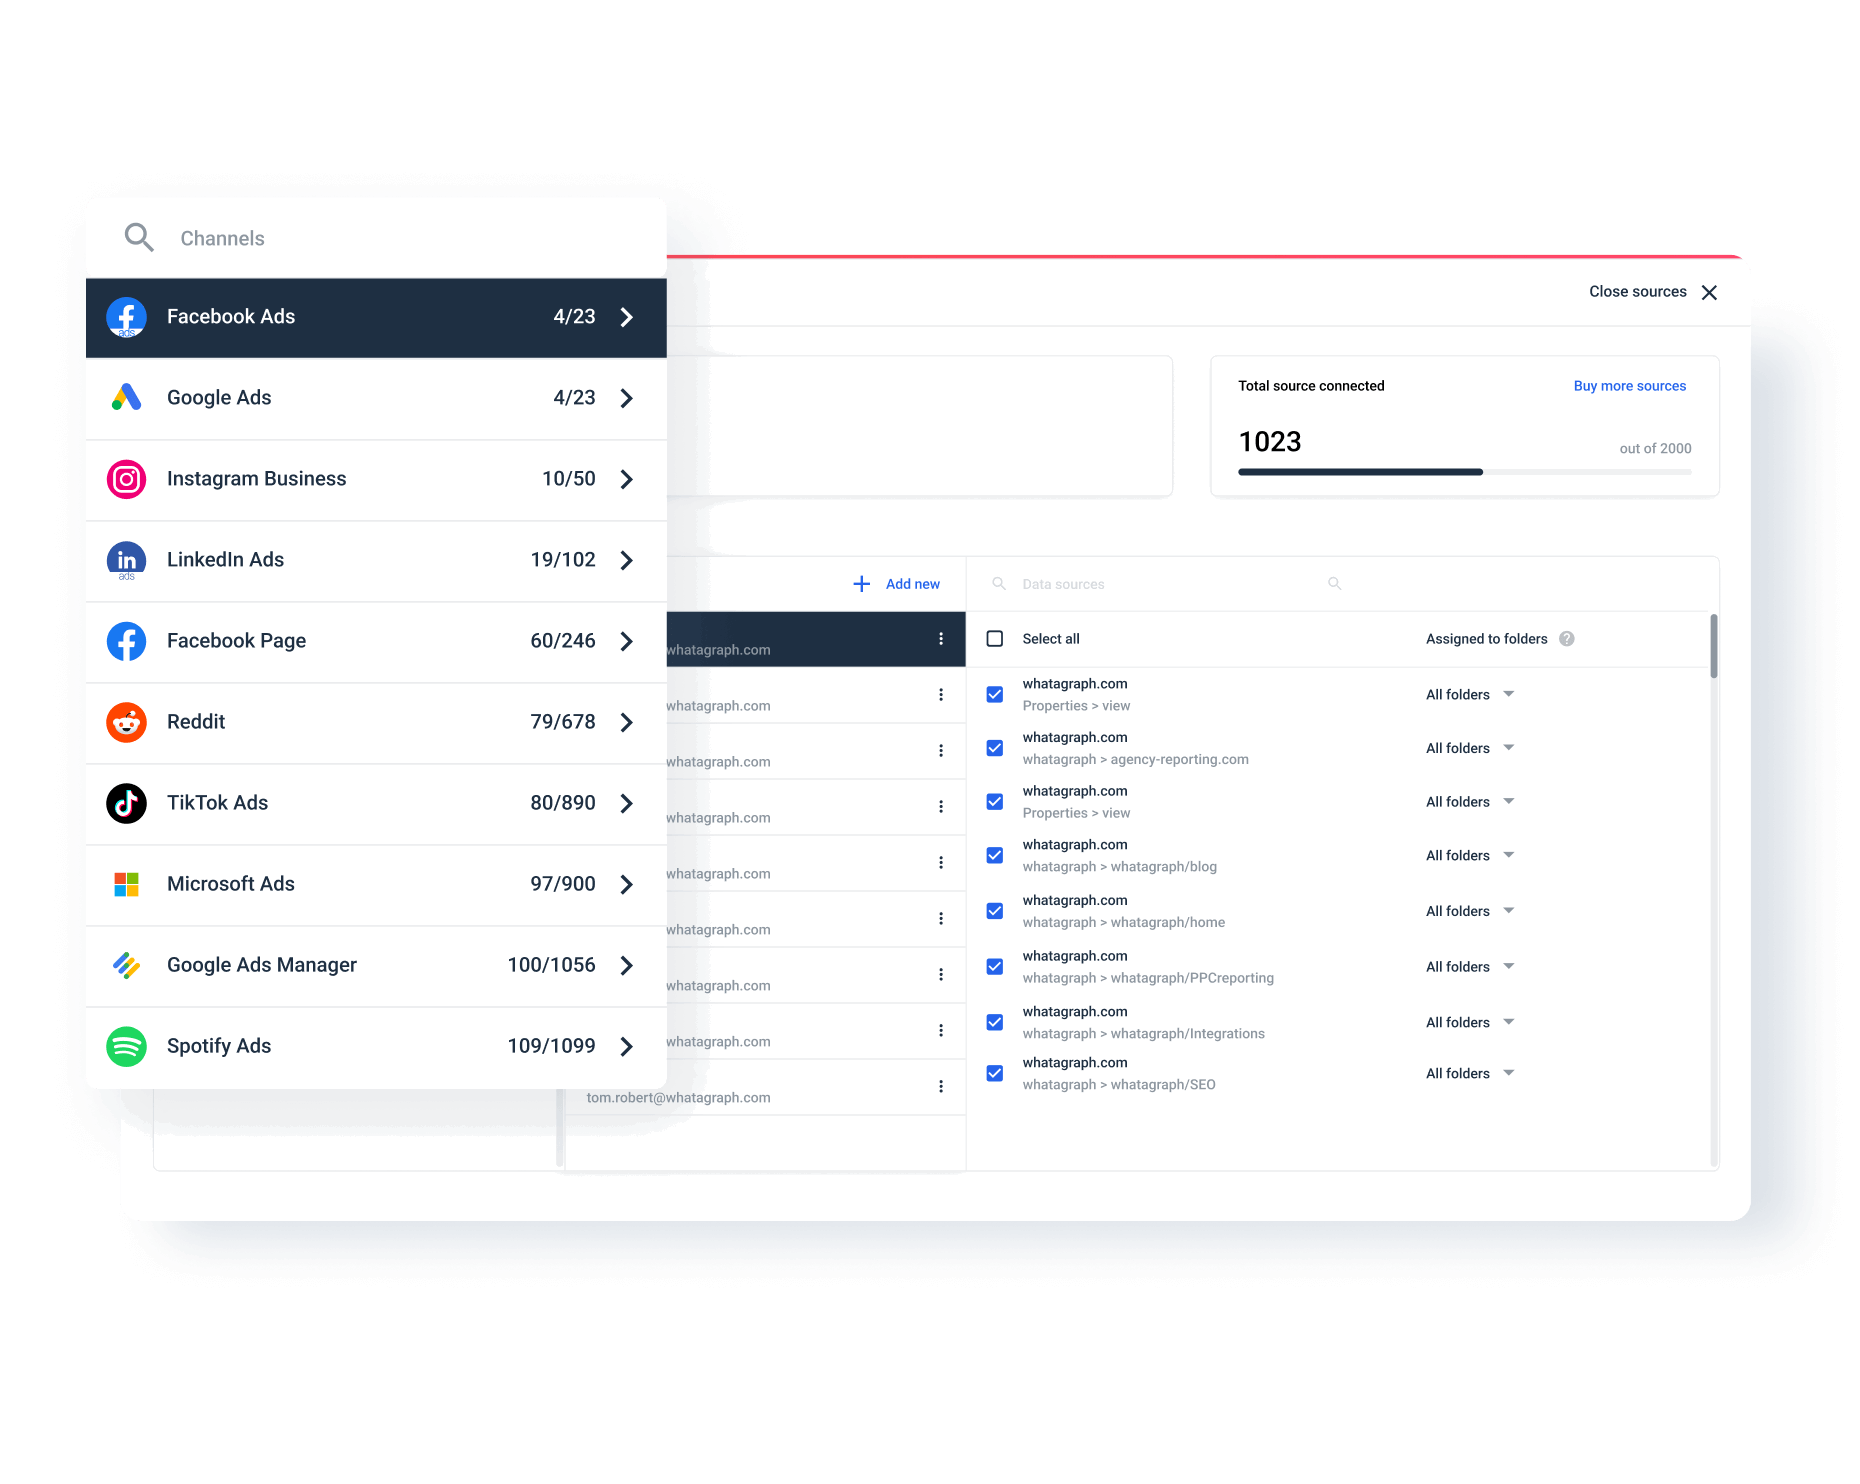
With Whatagraph, you can eliminate this tedious manual work by bringing data from 50+ marketing channels onto one platform. These include:
- Analytics: Google Analytics 4, Matomo, Piwik Pro
- PPC: Google Ads, LinkedIn Ads, Facebook Ads
- Social Media: Facebook, Instagram, LinkedIn
- SEO: Ahrefs, Google Search Console, Accuranker
- eCommerce: Shopify, WooCommerce, BigCommerce
- Email Marketing: ActiveCampaign, Klaviyo, Mailchimp
Explore all our integrations here.
Our Product team is also constantly working hard to add new integrations—reach out to us to see if we have one you need.
You don't need to have SQL or coding skills to set these integrations up either. All you need to do is:
- Choose a channel from a menu bar.
- Connect your account.
- Connect your data source.
But it’s not about how easy these integrations are, but also how stable they are.
In fact, most marketing analytics tools are notorious for having slow and buggy integrations due to clunky third-party connectors.
On Whatagraph, the integrations we provide are fully-managed, which means:
✅ They’re reliable, fast, and seamless.
✅ You can blend data from different sources to create custom metrics and dimensions for more comprehensive reporting.
✅ Bugs get resolved faster without having to get a third-party company involved.
#2. Highly customizable.
Whatagraph offers customization at two key levels:
- At the data level
- At the report level
When we say “customize” your data, we mean:
- Blending different data sources together to create new ones
- Creating custom metrics
- Creating custom dimensions
This helps you get a more comprehensive view of marketing performance and keep your reports neat and tidy.
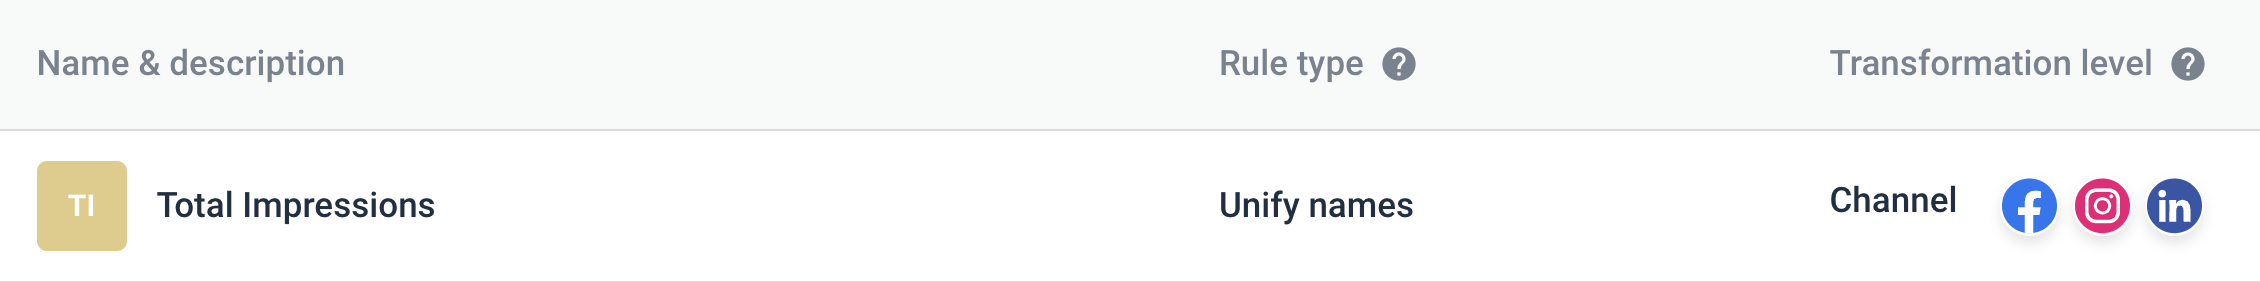
For instance, say you want to see the total impressions across all your social channels – Facebook, Instagram, and LinkedIn. You can easily create a new combined metric in (literally) 2 minutes. This video shows how.
The end result is a new metric called “Total Impressions” that you can add to your marketing reports:
What's more, with our newly-released product, Performance Monitoring, you can:
✅ Group 100s of scattered data sources into unified metrics in seconds, without having to do complicated blends
✅ Slice and dice your data by client, channel, location, or whatever makes sense for your business using custom tags
✅. Visualize key metrics from all your data sources in one place
On the reporting side of things, you can customize your reports by:
- Uploading your logo or your client’s logo
- Creating color schemes that fit your brand colors
- Adding text, headers, and footers
#3. Comes with ready-made templates and dashboards.
You don’t need to have long, excruciating onboarding calls with the Support team to build your first report on Whatagraph.
Even the least tech-savvy person on your team can easily create reports using our ready-made templates and dashboard examples.
Here are the most popular templates among our customers:
- Marketing analytics report template
- PPC report template
- Cross-channel analytics report template
- Google Analytics 4 report template
- White-label dashboard template
These ready-made templates save you significant time (up to 40 hours a month) on creating reports.
They also help you tell a compelling story about how marketing campaigns contribute to the bottom line of your business, or your client’s business. This means:
- Your marketing team gets the praise and recognition they deserve.
- You can retain your clients for longer (and even onboard new ones!).
You can also choose to start from blank and use our pre-made widgets. Simply drag-and-drop them onto your blank canvas and your data will be visualized automatically.
Then, you can share these reports through:
- Live links
- PDFs
- Excel spreadsheets
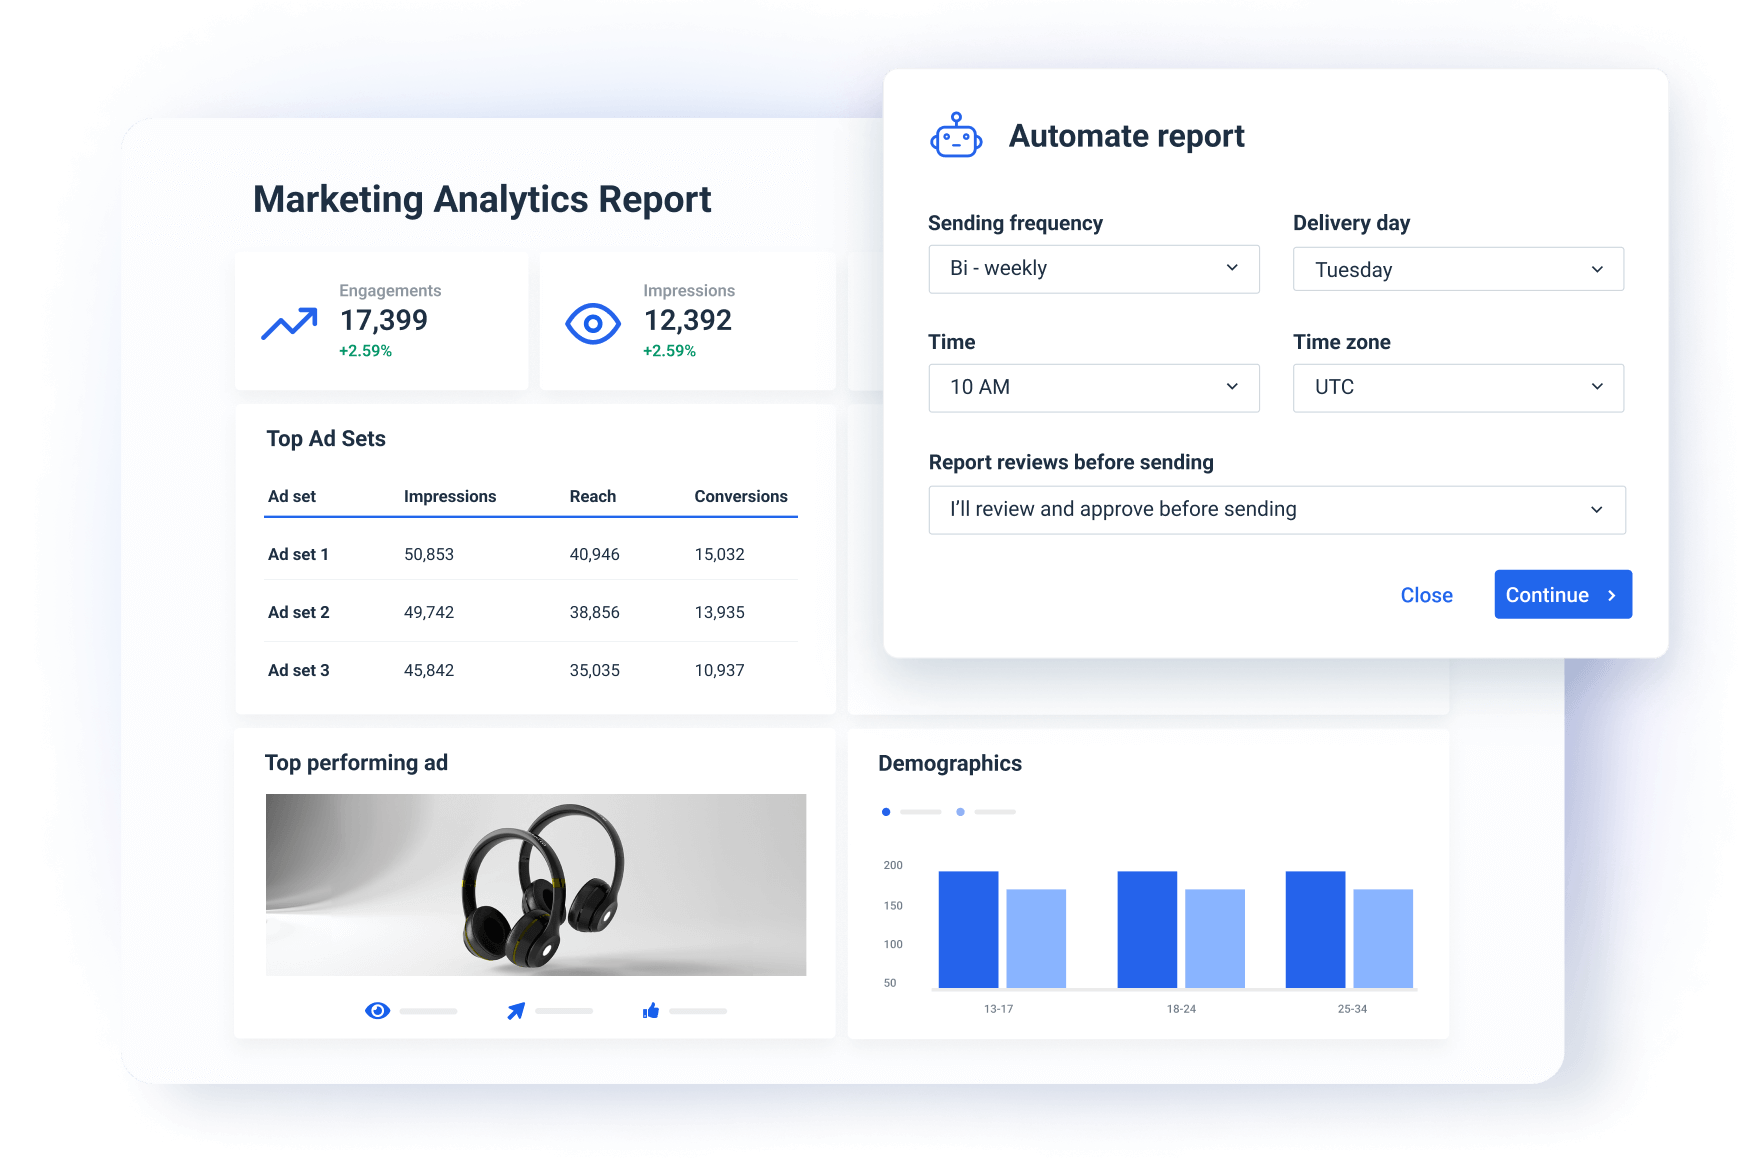
- Automated emails that go out daily, weekly, or monthly
#4. AI insights.
Busy clients will often go straight for the insights section, sometimes ignoring the rest of the report.
A problem is that digging out valuable insights from the pile of data takes a lot of time.
Whatagraph solves this problem with two innovative AI features that save you time.
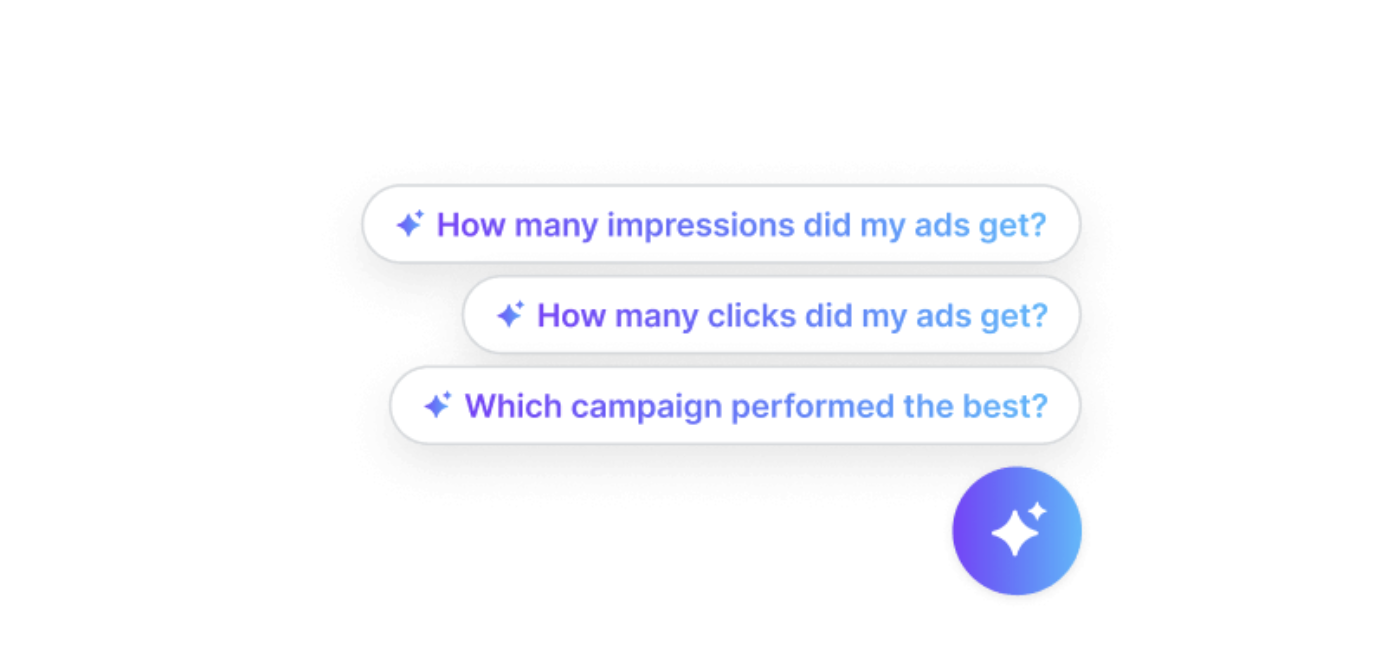
AI data chatbot: You can ask our AI chatbot questions about all your connected data or campaigns in natural language—just like talking to your personal data expert.
For example, “What was the total ad spend from Google Ads and LinkedIn Ads in January last year”?
AI summaries for reports: Instead of writing summaries yourself, you can generate AI report summaries and add them to your reports using our Text widget.
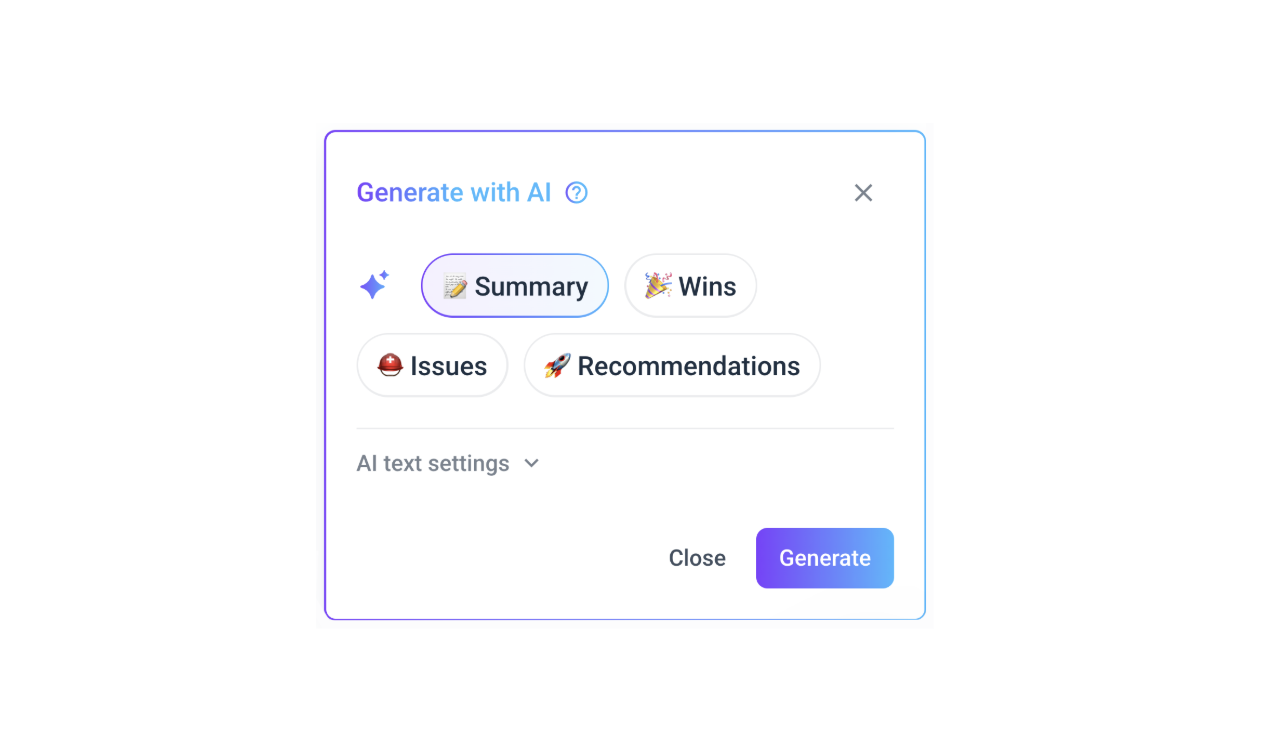
If needed, you can also edit the AI summary to add more granular insights or personal comments.
#5. Fast and friendly Customer Success.
No matter how easy a platform is, there are times when you just need some human help to get everything up and running correctly.
At Whatagraph, you can reach out to us instantly via live chat on our website or email.
Our amazing Customer Support team will get back to you within 34 seconds to 4 minutes, and resolve issues within 5 to 24 hours.
And all our pricing plans come with a dedicated Customer Success Manager who will guide you through:
- Migrating your data from your current platform
- Setting up data connections
- Organizing your campaigns and data
- Automating reports
- Anything else that ensures your success
Convinced Whatagraph is the right marketing analytics tool for you? Book a call and we'll show you how we can help you.
Who is Whatagraph for?
Whatagraph is ideal for large full-service marketing agencies and enterprises with many scattered marketing data sources to monitor, analyze, and report.
Pros:
- All-in-one marketing analytics solution
- Easy to use by anyone on your team
- Fast campaign performance and insights
- Stunning visual reports
- AI insights
- Makes results easy to interpret
- Excellent live chat customer support
Cons:
- No freemium plan
- Just one data warehouse destination is available so far (We're launching a new destination soon!)
Pricing
Whatagraph offers three pricing plans based on the amount of “source credits” and access to customization and data organization capabilities.
You can use source credits to connect data sources, send data from a source to a warehouse, and blend cross-channel data together.
Get a 7-day free trial and see how Whatagraph simplifies your marketing analytics and reporting.
2. Metrics Watch
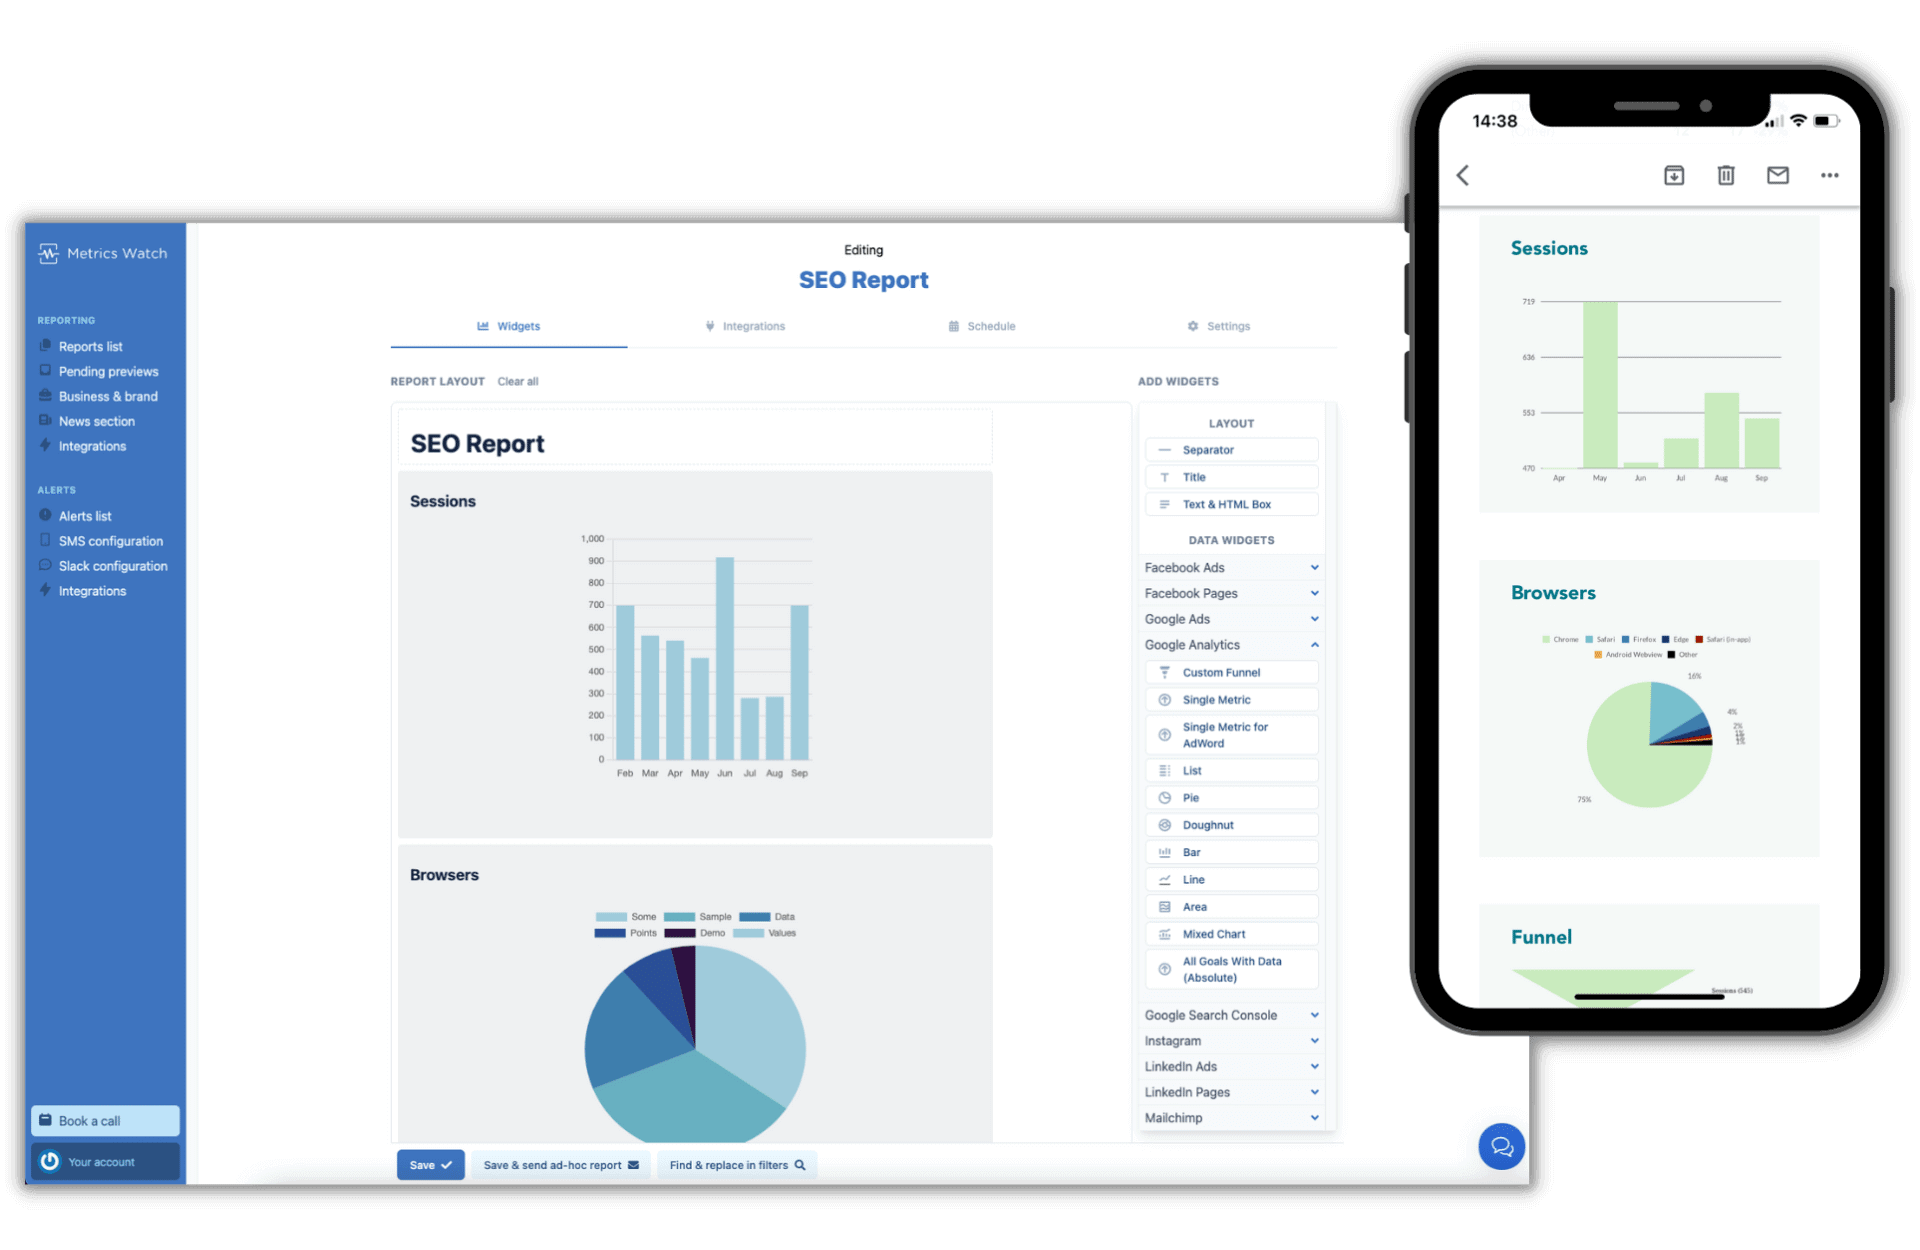
Metrics Watch is an email-based digital marketing analytics tool for marketers and agencies. It allows marketers to send daily, weekly, or monthly reports directly inside the email body so clients can conveniently view their marketing performance data in their inbox.
This tool lets you combine data from multiple marketing channels (including Google Analytics 4, Google Ads, Microsoft (Bing) Advertising, Facebook, Google Sheets, Mailchimp, and more) and visualize it using charts and graphs.
Key features:
- Pre-made report templates
- Drag-and-drop visualization builder
- Automated report delivery
- White-label reports
- Create identical reports in bulk
- Custom PPC markup option
Who is Metrics Watch for?
Digital agencies, freelancers, SaaS businesses, and other marketers who need a quick way of sharing marketing results with their clients or stakeholders.
Pros:
- Easy to set up
- Convenient report sharing in email body
- Automated reporting process
- Good support
Cons:
- Limited choice of integrations compared to competitors
- Limited design options
- No blended metrics
- No data transfer option
Pricing
Four pricing plans based on the number of configured reports. Free migration service from competing software is available for all plans.
3. Google Analytics 4
Google Analytics 4 is an integral part of the Google Marketing Platform that offers free marketing analytics solutions
The successor of Universal Analytics, this marketing analytics tool generates essential web and app analytics reports that give critical insights, enabling companies to make smarter and better-informed business decisions.
Using Google Analytics 4, businesses can learn more about their website visitors, their behavior, and the best ways to convert them into loyal customers.
Key features:
- User-centric metrics
- Audience analysis based on behavior, demographics, tech attributes, etc.
- Codeless event tracking
- Machine learning attribution models (only paid version)
Who is Google Analytics 4 for?
Google Analytics 4 is a digital analytics platform designed for users who need advanced data analytics capabilities to understand and improve their online presence.
Its advanced features, such as cross-platform tracking, event-driven data models, machine learning capabilities, and enhanced customization, make it a powerful tool for marketers, business owners, product managers, data analysts, developers, e-commerce businesses, nonprofits, and educational institutions alike.
Pros:
- Provides a holistic view of user behavior across platforms
- Anticipates future trends using predictive analytics
- Customizable dashboards and reports
- Works seamlessly with other Google services and marketing tools
Cons:
- No Views are allowed in the free GA4 version
- Challenging to build reports and extract insights
- Data retention is limited to 14 months for the free version
- Data sampling in reports
- Non-existent customer support
- Steep learning curve
An easier way to extract insight from GA4
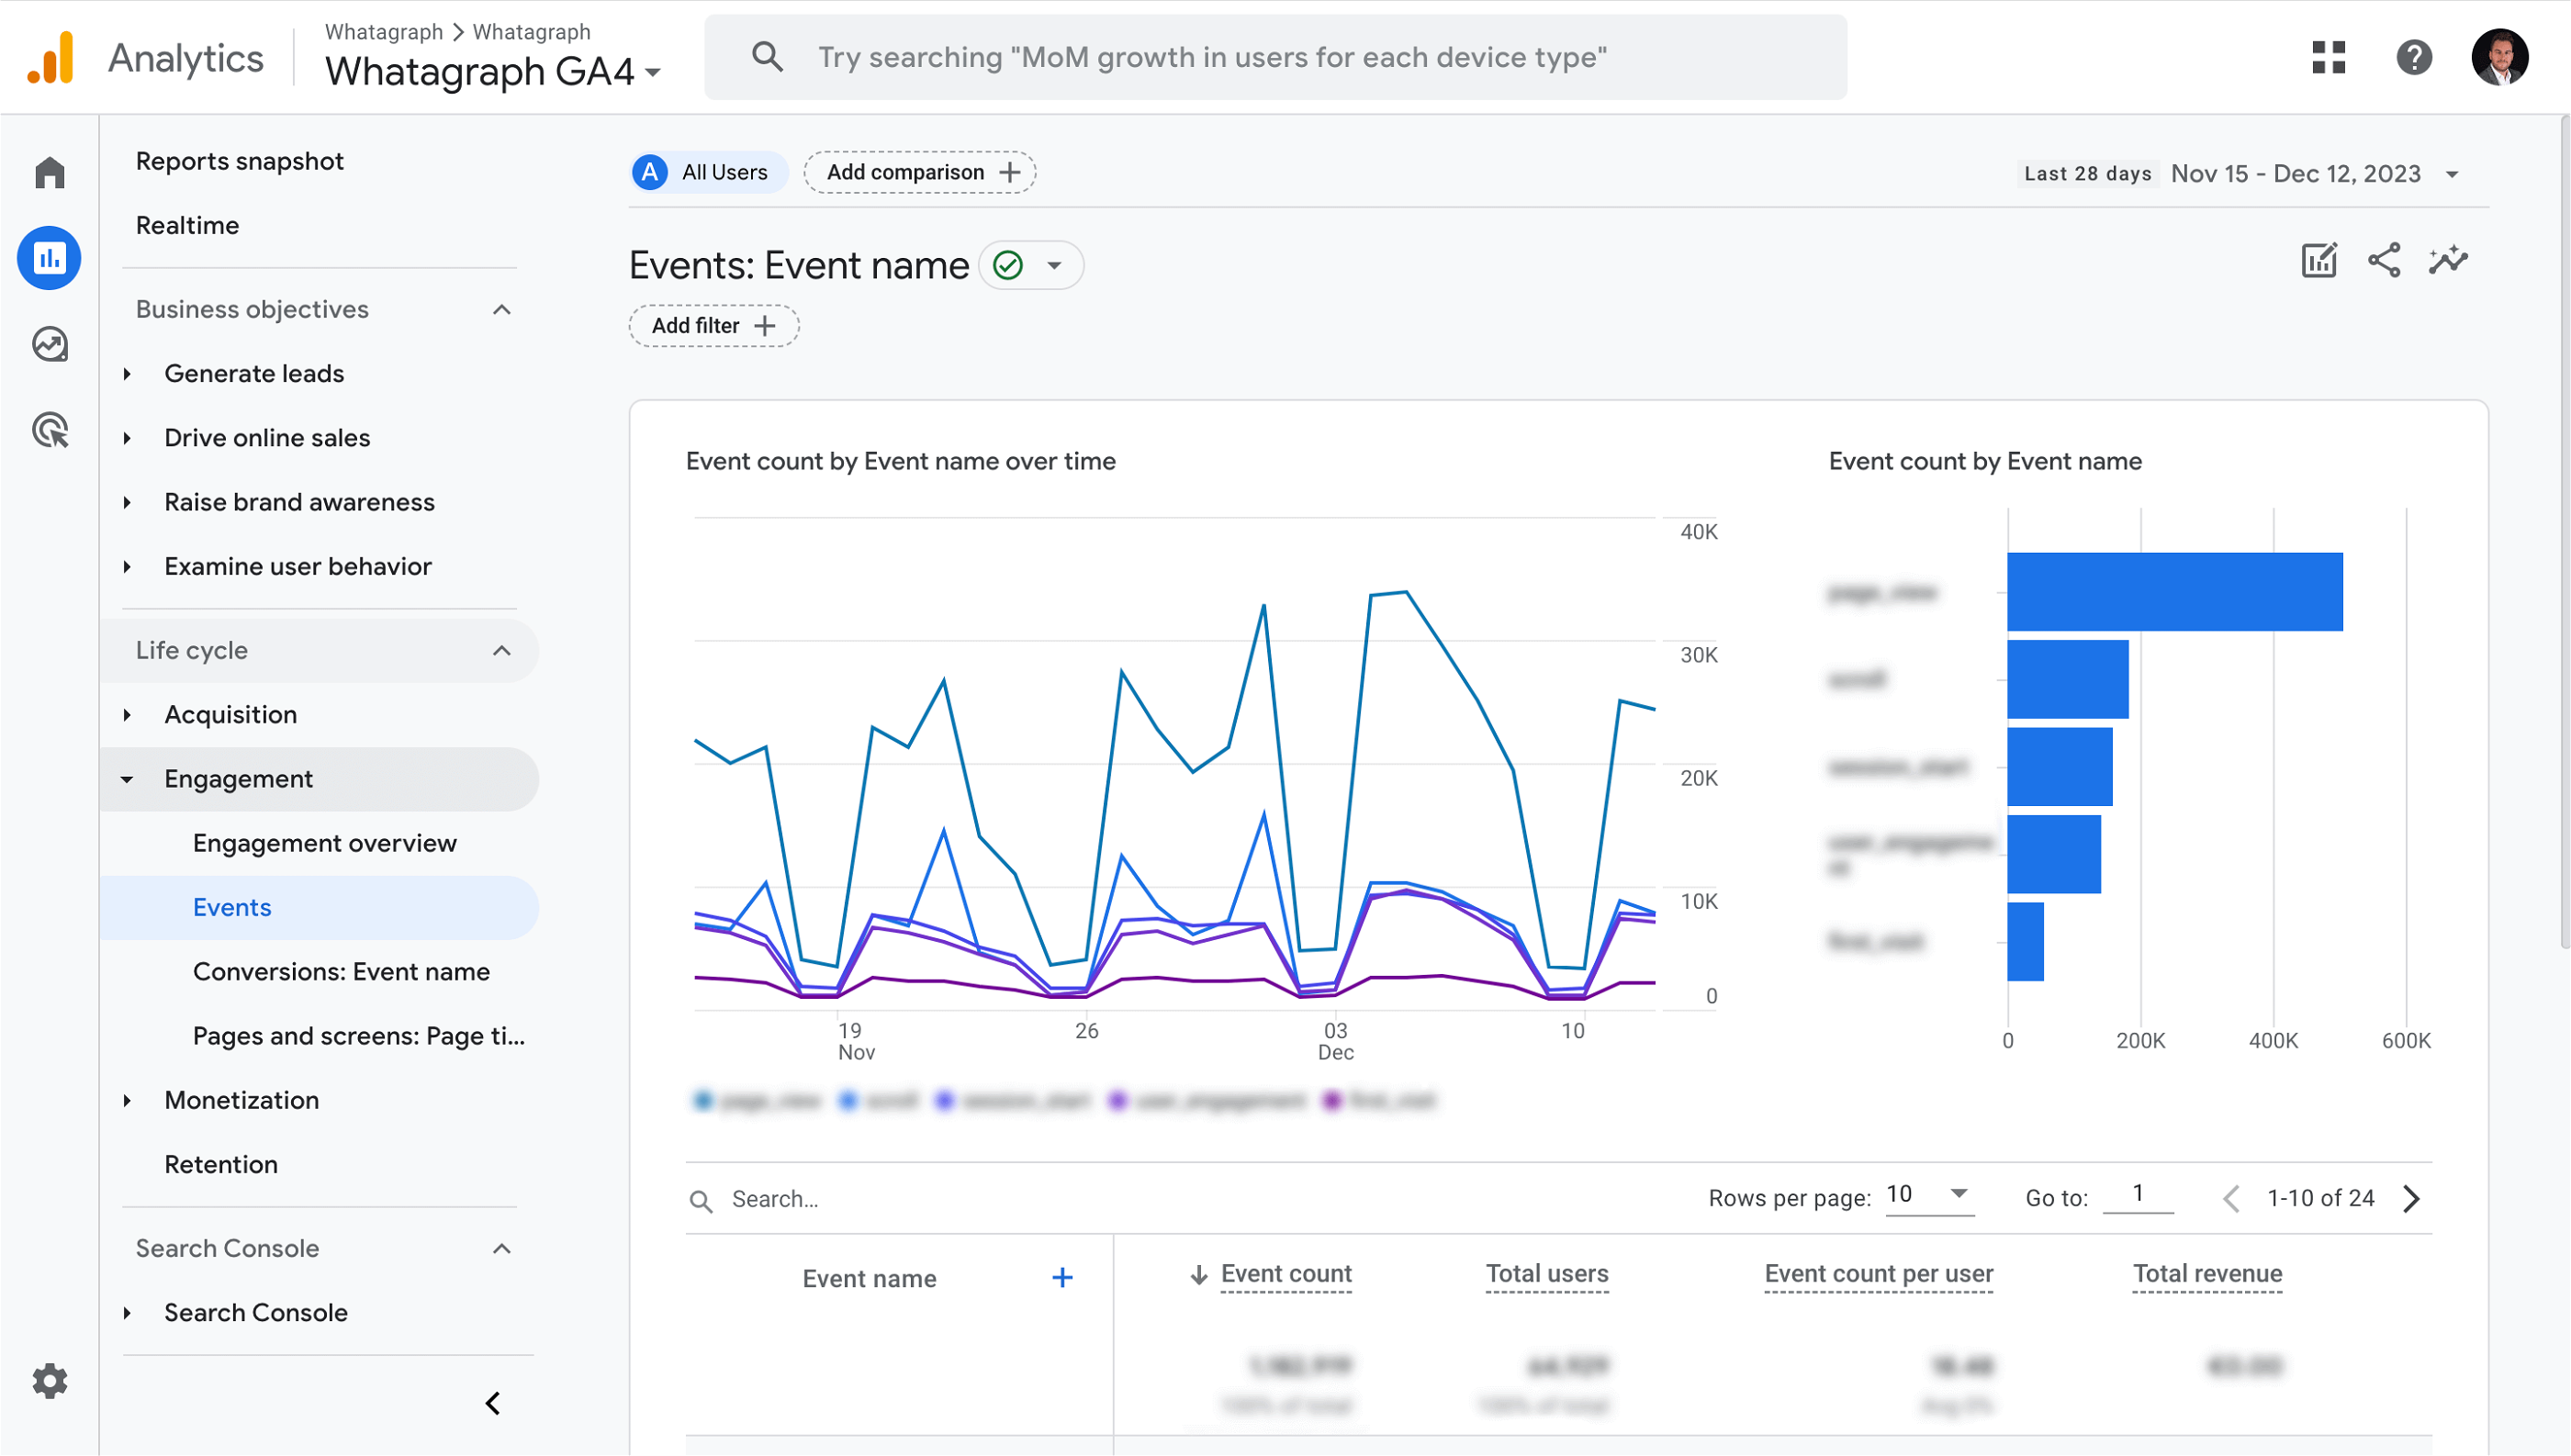
A serious disadvantage of Google Analytics 4 is the difficulty of building reports.
The native GA4 reporting gives you just a handful of customization options. There are seven Exploration Report templates, but there’s no way to change the information.
And if you create new reports from scratch, you face another set of challenges:
- First, you need to standardize and consolidate data across different data streams and dimensions to ensure the data is consistent and accurate.
- Then, you need to have a clear understanding of the client’s business KPIs to ensure the data is presented in a relevant order that helps decision-making.
- Finally, you must configure all the dimensions, metrics, and segment details before the visualization appears, which can lead to a painstaking trial-and-error session. This is especially true since you can’t save any visualization you create along the way as a template.
Whatagraph offers a much more intuitive, faster, and flexible GA4 reporting method. Using a drag-and-drop visualization builder, you can easily adapt our GA4 dashboard to your needs and save it at any stage as a new template.
How to solve limited data storage and sampling?
By default, Google Analytics 4 stores your data for 14 months, and unless you upgrade to a much more expensive Analytics 360 version, it’s gone for good.
Another problem is the data sampling, which was grandfathered from Universal Analytics.
Namely, to analyze vast amounts of data — and balance both speed and accuracy — GA4 sometimes samples a portion of your traffic data. This can lead to inaccuracies in your reports, especially if the sample is not large enough, e.g., when you’re trying to compare results between two running campaigns.
Both issues can be solved if you start “owning” your marketing data. By moving your data to a warehouse, you bypass both the limited data retention and data sampling issues as you work with your own data.
And if you use Whatagraph’s no-code data transfer, you don’t need a data specialist to set up anything. You can create scheduled data transfers for any of your sources in just a few clicks.
Pricing
Google Analytics 4 is free if you use the free version. A paid plan called Google Analytics 360 includes advanced analytics features, such as attribution modeling and data integration. To learn more about how much the paid version might cost you, visit our article on Google Analytics pricing.
4. Semrush
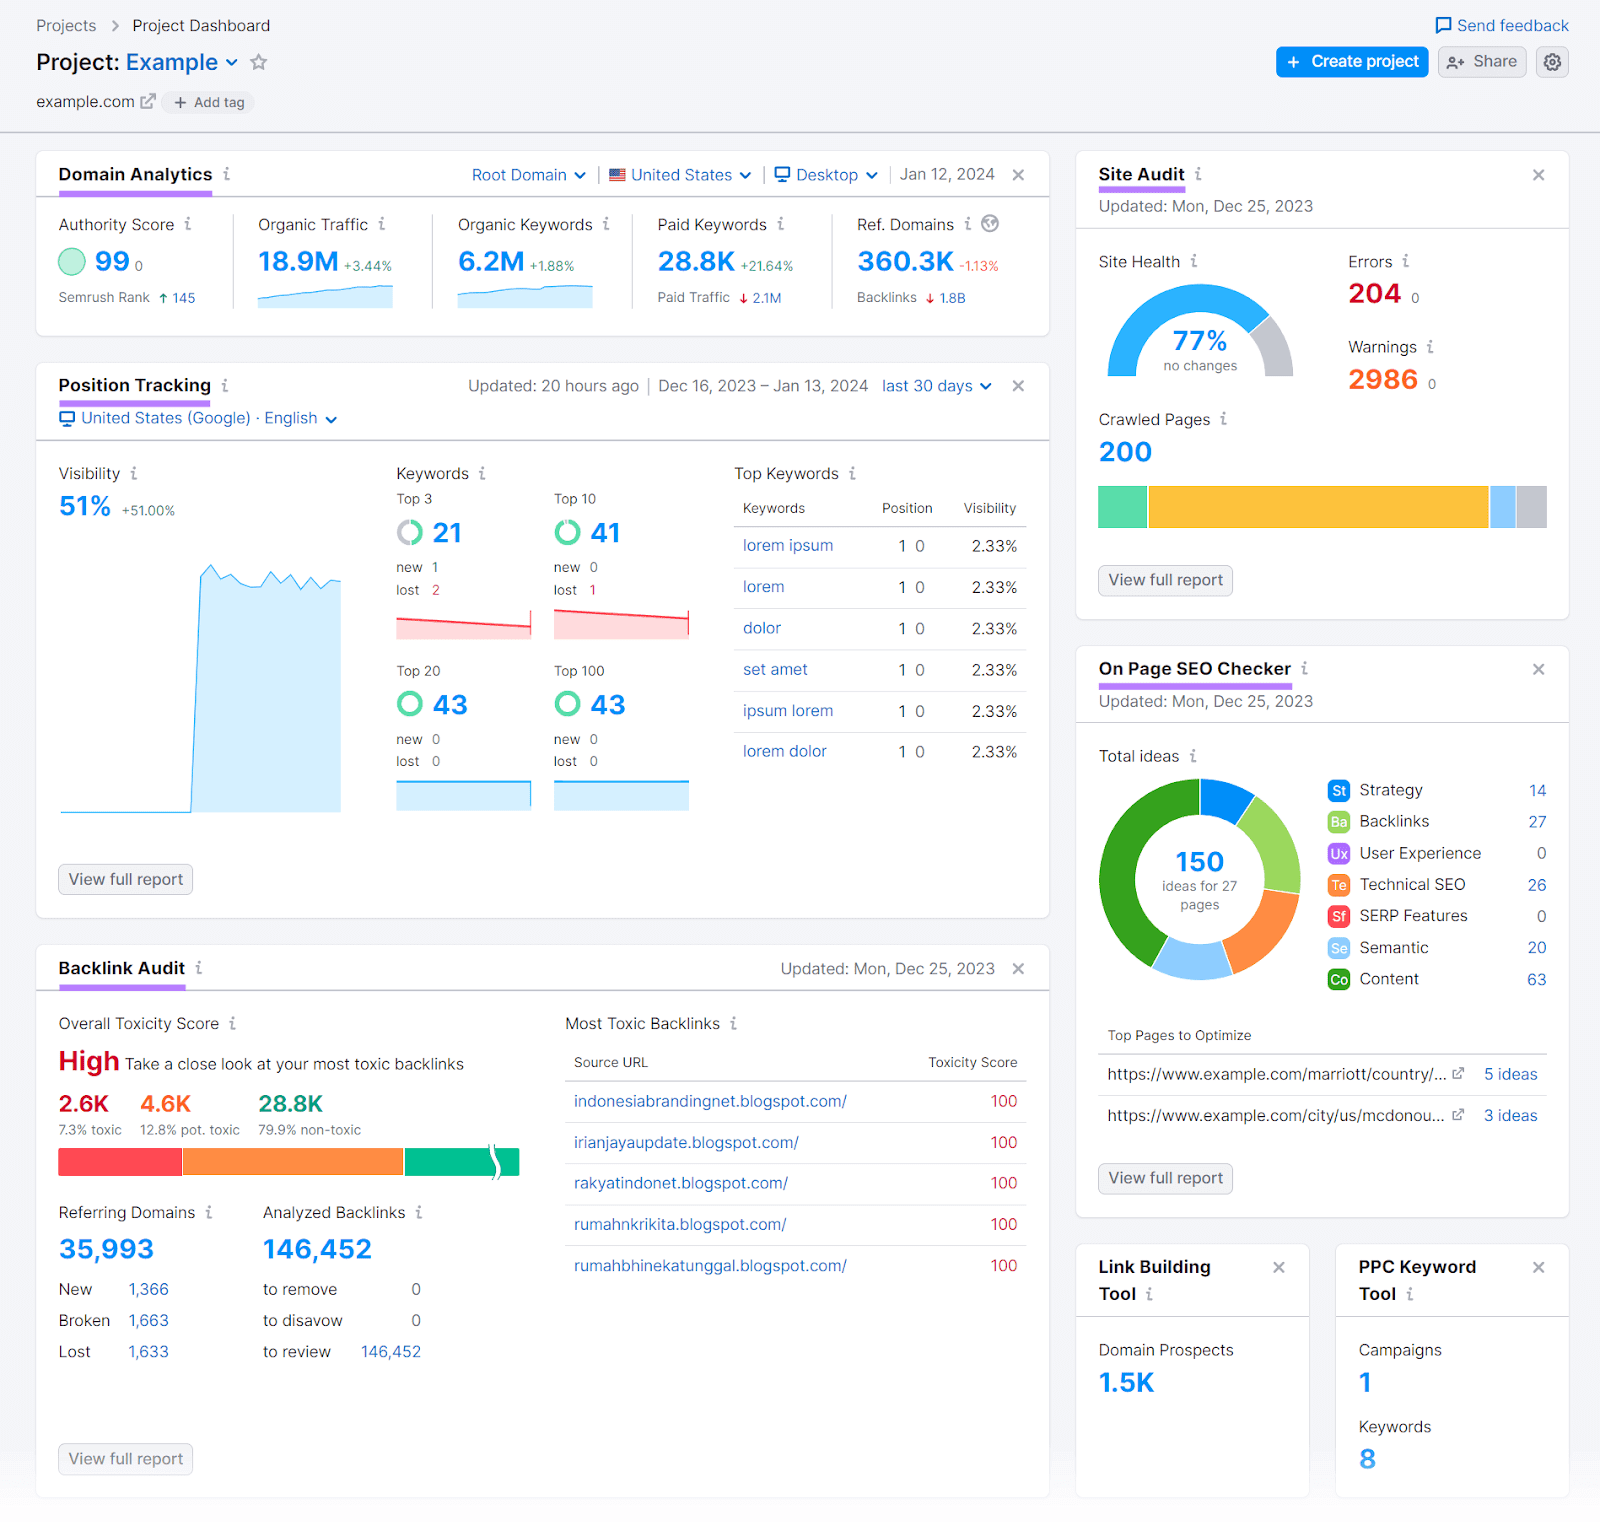
Semrush is a comprehensive digital marketing analysis tool that merges SEO, content marketing, competitor analysis, PPC, and social media monitoring capabilities. It is a critical solution for all companies who want to monitor and analyze their online presence.
The base of Semrush's offerings is the powerful SEO toolkit, which gives users insights into keyword rankings, backlink opportunities, and site health.
In addition, the platform offers detailed analytics on competitors’ initiatives, including their search engine marketing tactics and advertising content. This allows businesses to benchmark their performance and identify areas for improvement.
In the content marketing department, Semrush offers tools designed to improve content strategy and creation.
This includes content auditing capabilities, topic research tools, and SEO writing assistants that help writers optimize content for search engines and the intended audience.
Key features:
- Keyword research
- On-page SEO
- Competition analysis
- Local SEO
- Rank tracking
- Content optimization
Who is Semrush for?
Semrush is a tool of choice for marketing managers in businesses of all sizes who want to optimize their online visibility across key channels and create engaging content for users.
Pros:
- Extensive keyword data
- Information listing management
- Local search query monitoring
- Integration with other platforms like Google Analytics 4 or Google Search Console
Cons:
- Limited database for certain languages or regions
- Limited reporting and data management capabilities
- Steep learning curve due to a huge number of functions
- Expensive add-ons
Pricing
Semrush offers three pricing plans based on the number of projects, tracked keywords, and the number of results per project. Numerous paid add-ons are also available.
5. Hubspot
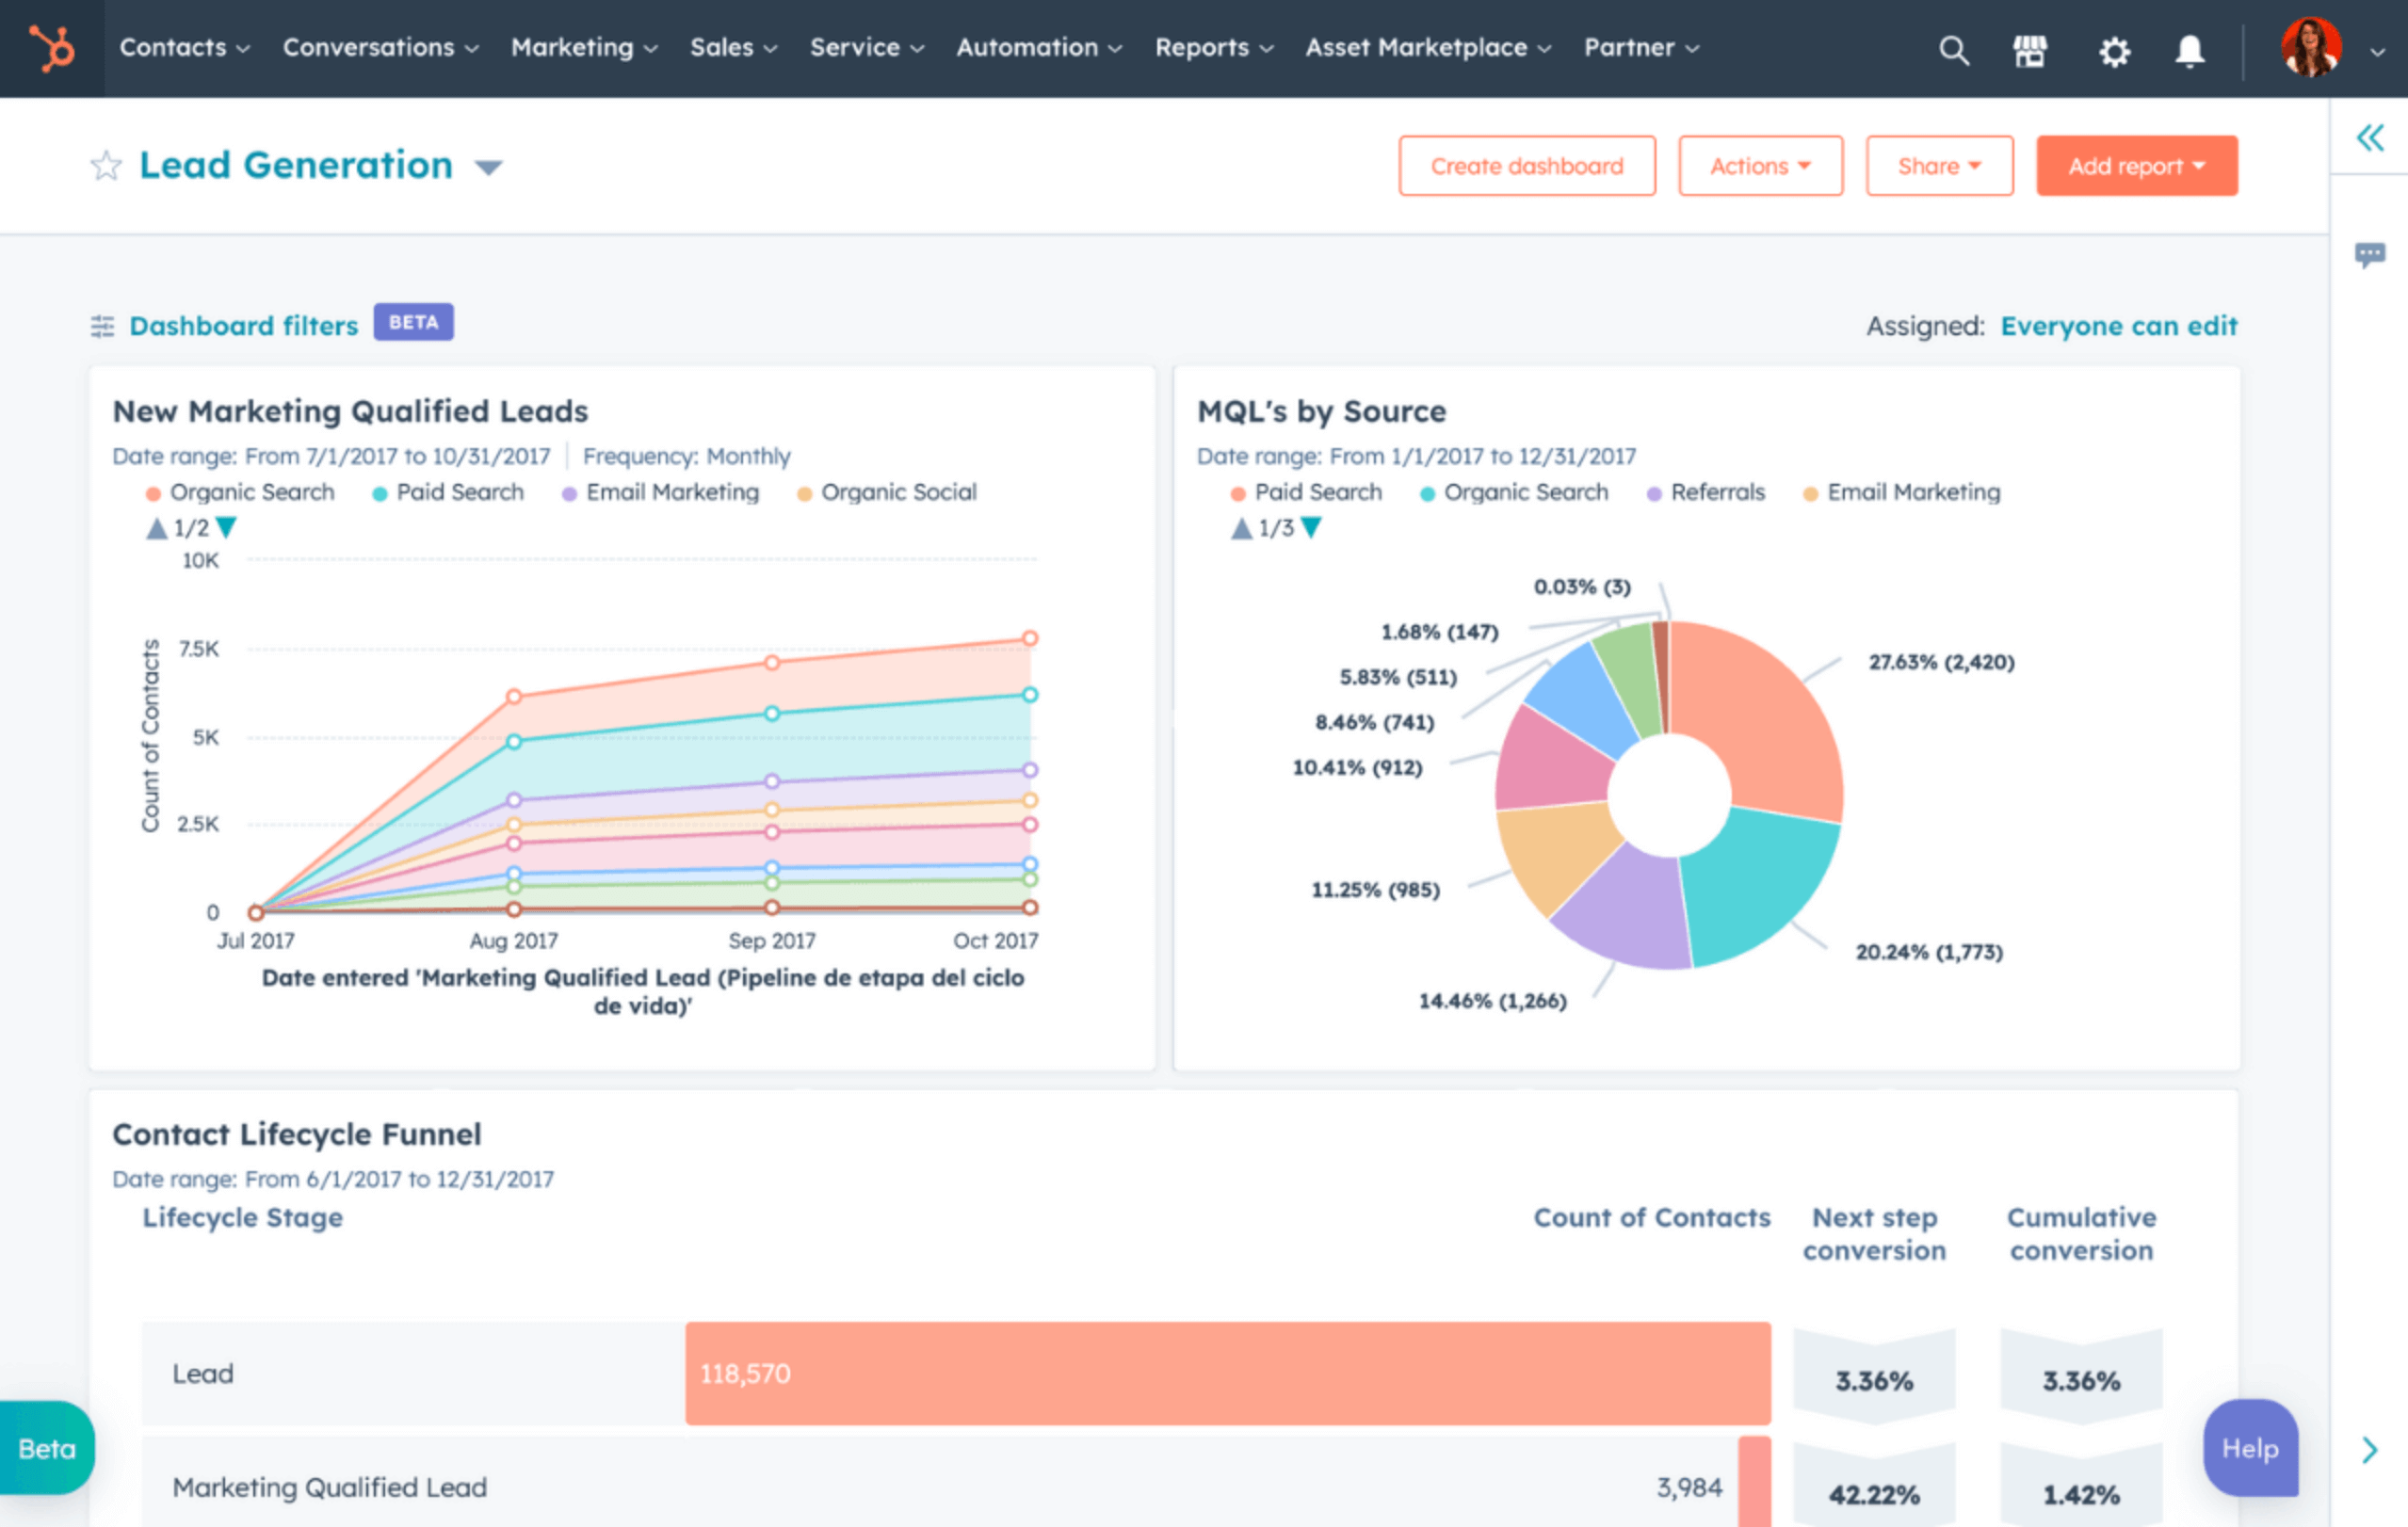
HubSpot is a game-changing software for marketing analytics for B2B businesses looking to optimize their digital marketing performance.
Using the HubSpot email tool, users can create and send highly personalized professional emails, supported by a large base of email templates and advanced segmentation options.
However, what gives HubSpot a spot on this list is its robust marketing analytics. Using comprehensive reports and real-time customer data, marketers can gain actionable insights into the performance of their email marketing campaigns.
This data allows businesses to identify what works and what doesn’t and refine their approach for better results.
Key features:
- Free CRM (for a limited number of contacts)
- AI content writer
- Website builder
- Live visitor chat
- Drag-and-drop email builder
- Marketing automation
Who is HubSpot for?
As inbound marketing and sales software, HubSpot is a good choice for any growing B2B company that wants to attract visitors, convert leads, and close customers. It can also sync data across teams and devices through automatic updates.
Pros:
- A large number of analytic KPIs and metrics
- Built-in charts, data sources, and filters
- Customer and campaign segmentation
Cons:
- A large number of features might prove challenging for some users
- Not so intuitive to remove add-on features
- Steep enterprise pricing plan
- Limited free tools suite
Pricing
HubSpot has an elaborate pricing scheme based on the product category, number of users, marketing contacts, and added features.
6. Mixpanel
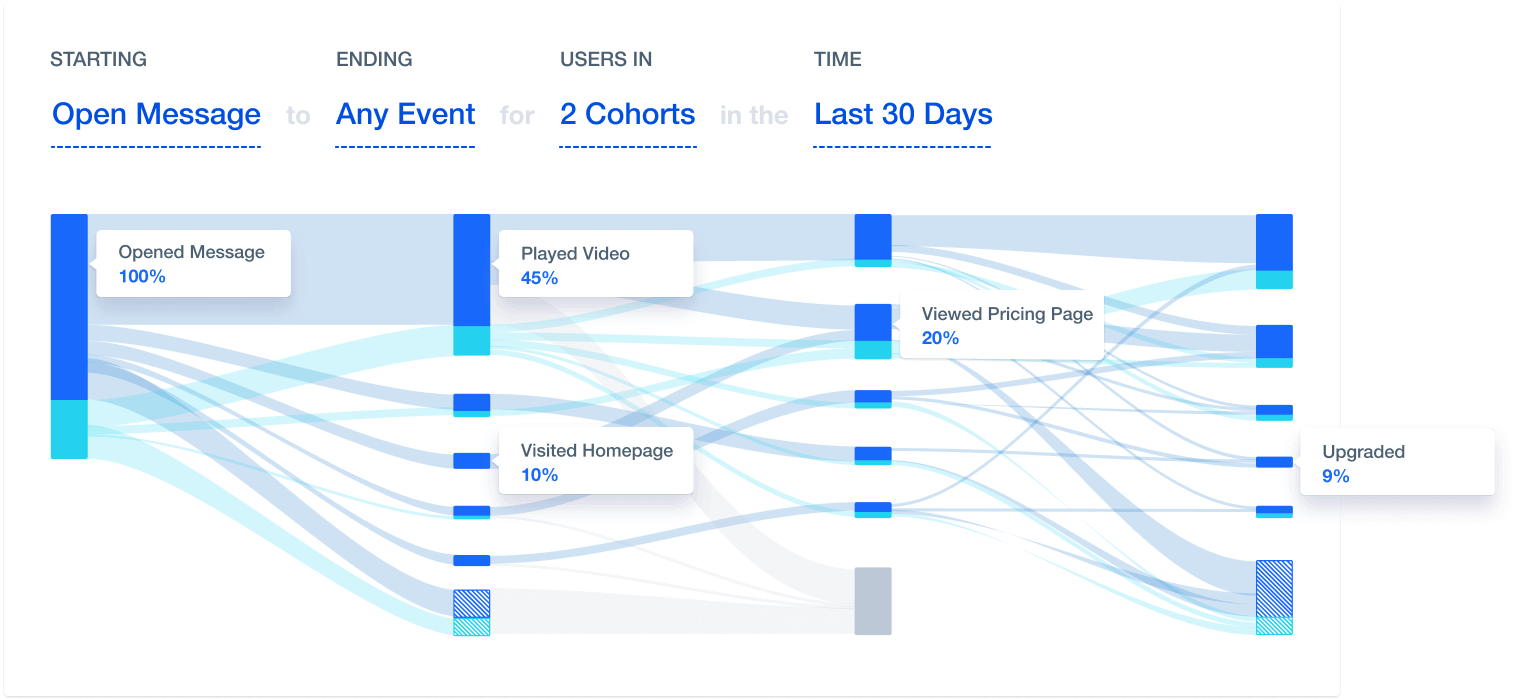
Mixpanel is a user analytics platform that tracks user interactions with web and mobile applications and provides detailed insights into user behavior and engagement patterns.
This marketing analytics tool helps marketers immediately see how changes they implement affect user behavior.
Unlike traditional pageview-based digital analytics platforms, Mixpanel allows marketers to track specific user actions in an app or website, such as playing a video, adding items to a cart, or sharing content.
In addition, Mixpanel offers advanced segmentation tools that allow teams to divide their user base into groups based on behavior, demographics, or custom events to deliver more targeted and effective marketing campaigns.
This feature can be used to run A/B tests and further analyze what features or changes positively affect user engagement.
Key features:
- Integrations with various tools
- Customizable dashboards
- Anomaly explanations
- Event tracking
- A/B testing
- Recurring messages
- Insights formulas
Who is Mixpanel for?
Product teams and businesses who want to understand how users interact with their product. By analyzing those insights, you can make data-informed decisions to enhance user engagement and retention.
Pros:
- Intuitive and easy to use
- Detail insights into user behavior
- Test ideas based on data-driven insights
- Powerful analytics and user segmentation
Cons:
- No dynamic dashboards
- Restricted historical data on low-tier plans
- Challenging to export large datasets
- Mixed UX
Pricing
Mixpanel offers three event-based pricing plans. Events represent interactions between a user and your product. Events-based pricing calculates the cost based on the number of events, such as purchases, video views, friend requests, etc., across all projects in each period.
7. Tableau
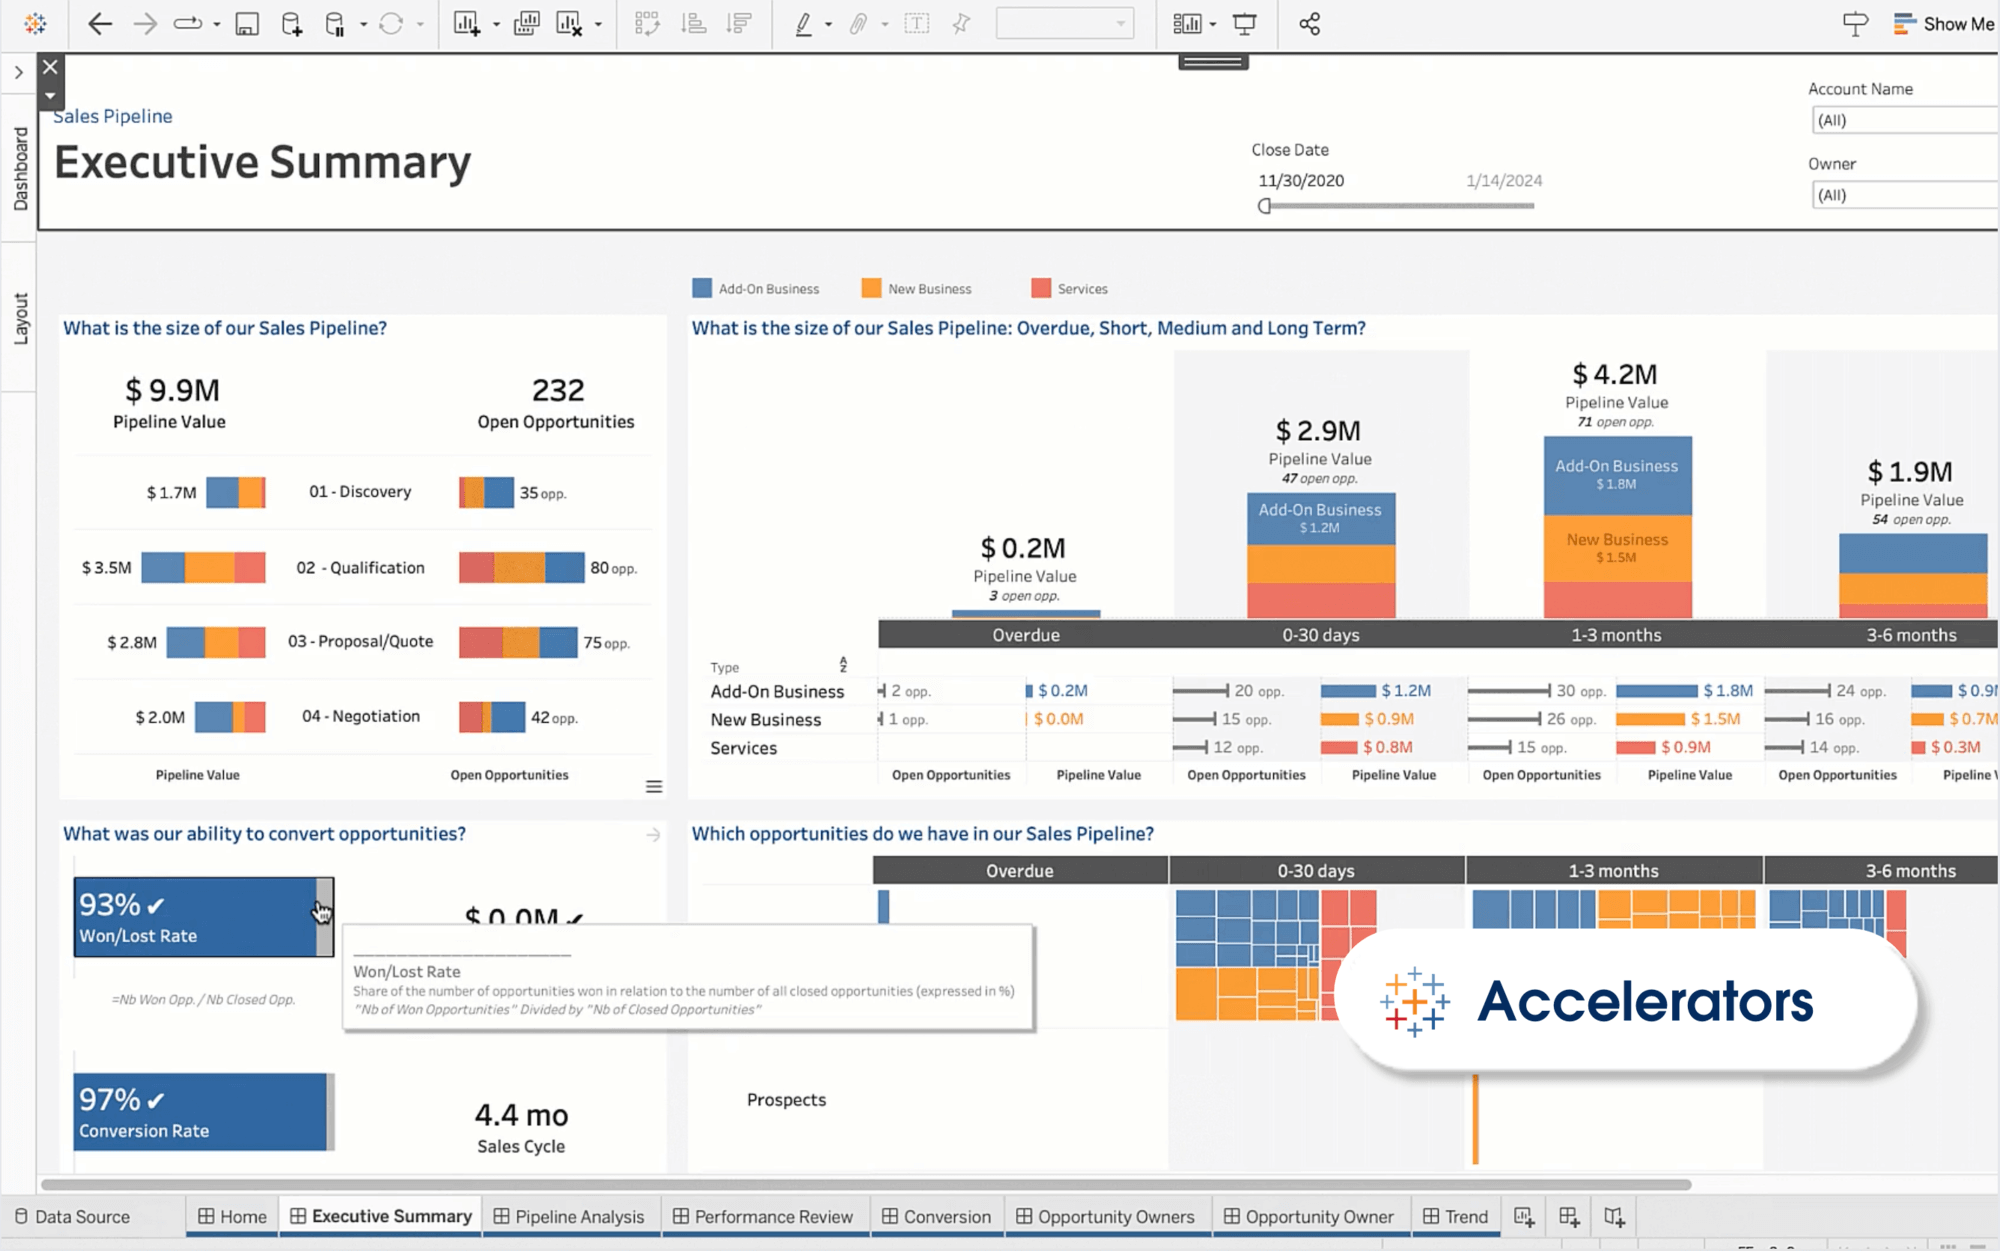
Tableau is a powerful marketing insights tool that connects to various data sources, including big data platforms, spreadsheets, and cloud databases, enabling users to integrate and analyze data from multiple channels.
The marketing analytics platform also supports advanced analytical tasks such as trend analyses, forecasting, and statistical summaries.
Key features:
- Ready-to-use Accelerator dashboards
- Data grouping bins
- Embedded analytics
- Tableau Catalog
- Data stories
- Predictive modeling
- Geospatial analysis
- Metadata API
Who is Tableau for?
Tableau is mainly used by data analysts, business analysts, accountants, and financial analysts, but marketers can also use it to organize and visualize their marketing data, improve their analytics processes, and implement high-converting solutions.
Pros:
- Marketing data management
- Visualization version control
- Custom SQL queries
- Interactive fiscal calendar
- AI and machine learning functionalities
Cons:
- Setting up data automation requires some Python programming
- The cloud version lacks some visualization and formatting settings that are available on the desktop version
- Limited programming options for predictive functions
- Steep learning curve
Pricing
Tableau has three pricing plans, Viewer, Explorer, and Creator, based on the data exploration abilities and data management functions.
8. Supermetrics
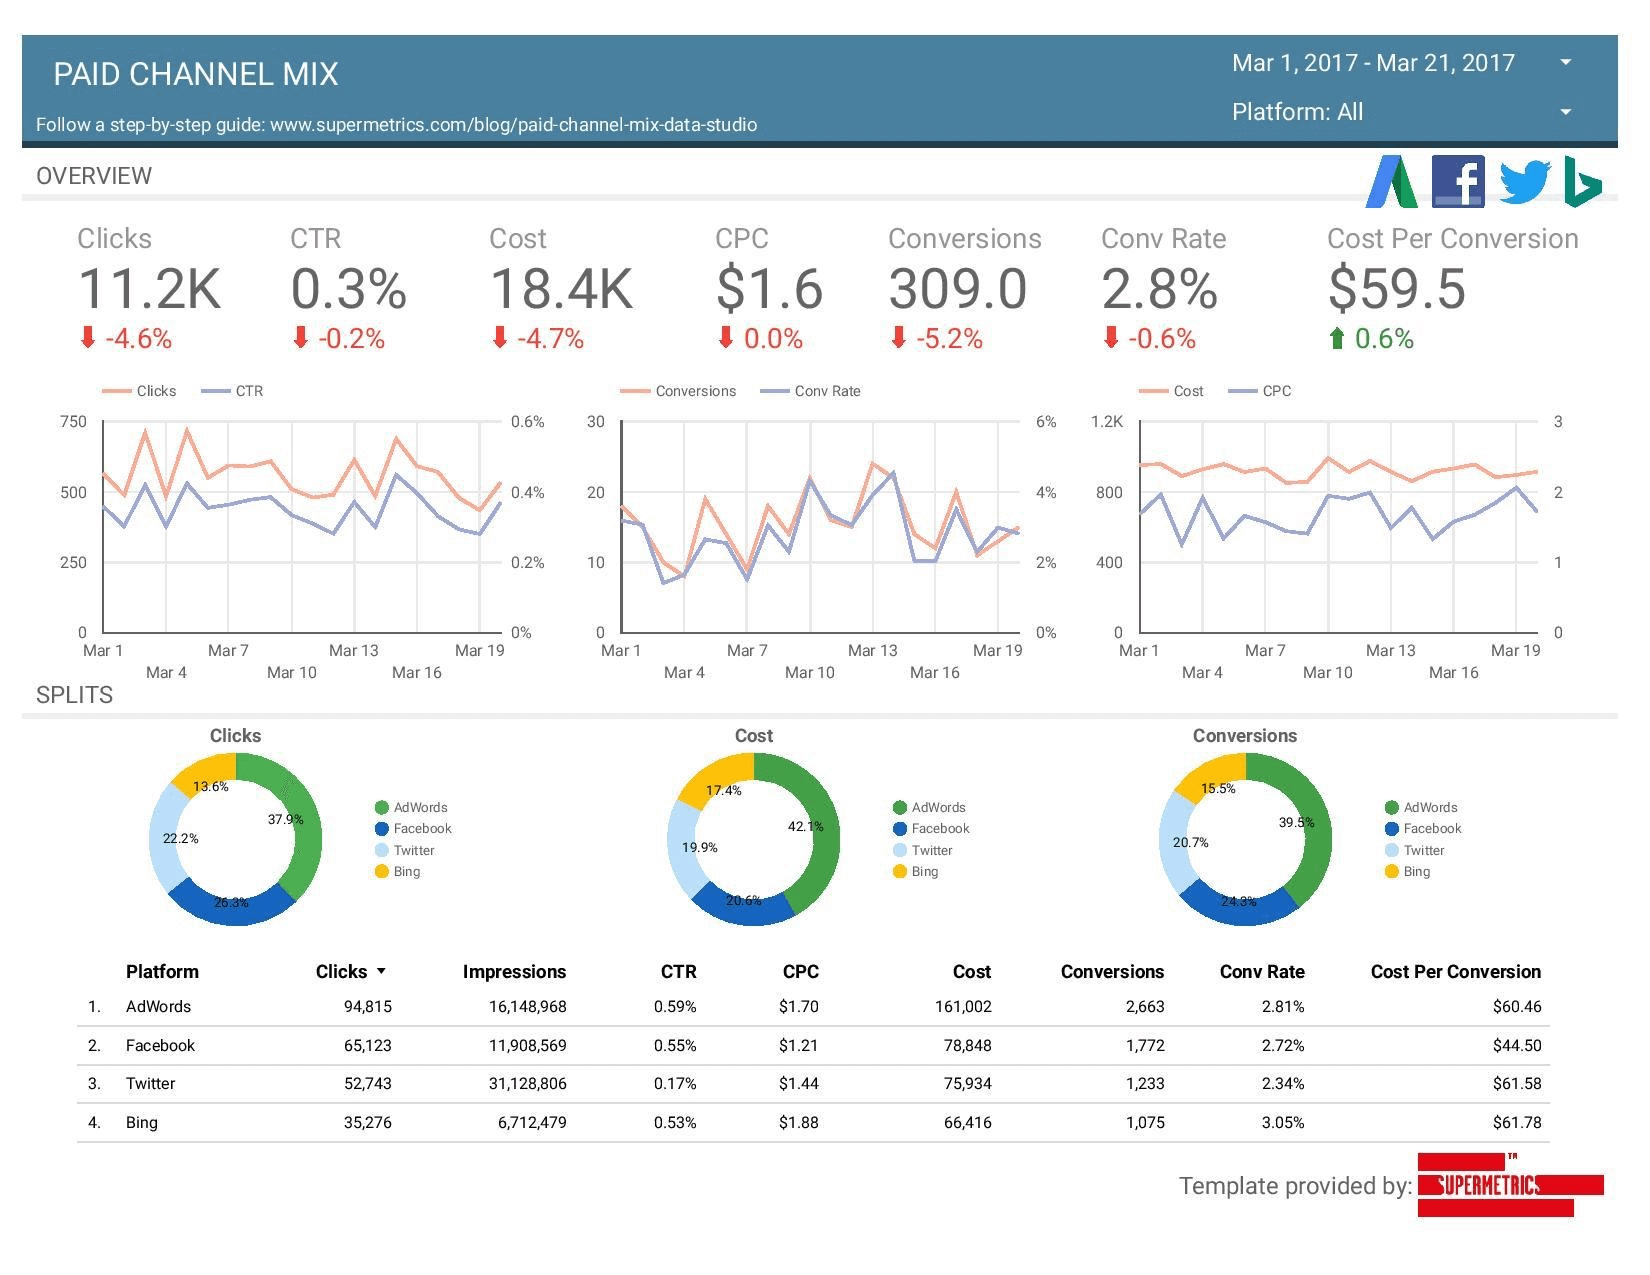
Supermetrics is data aggregation and loading software for marketing analytics. The platform integrates with over 100 data sources and destinations, including Tableau, Power BI, Excel, Looker Studio, Snowflake, BigQuery, and many others.
On the other hand, Supermetrics provides only basic data transformation features. Marketing teams who use this digital analytics tool need IT expertise or data analysts to execute data mapping and transformation.
Another characteristic of Supermetrics is that it lacks native visualization. However, there is a library of pre-built marketing analytics templates designed for popular platforms such as Looker Studio or Google Sheets.
The templates are created for specific marketing reporting needs such as SEO monitoring, PPC campaign analysis, social media performance, etc.
Key features:
- Event tracking
- Real-time and retroactive reporting
- User, role, and access management
- Data collection
- Multichannel tracking
Who is Supermetrics for?
Supermetrics is a marketing tracking tool for small businesses or marketing teams with basic analytics needs and a low-to-moderate number of data sources.
Pros:
- Simple and easy to use
- Automated no-code data transfers
- Easy retrieval of historical data
- Great for extracting data to BI or ML platforms
Cons:
- Loading data to multiple destinations is not available with a single pricing plan
- Adding more data sources requires buying more connectors
- Looker Studio connector can get slow when connected to multiple ad accounts
Pricing
Supermetrics offers pricing plans based on the final destination and the number of data sources you want to connect. However, for most plans, you need to contact their sales department to get quotes. We have an article that explores Supemetrics pricing in more detail.
9. Sprout Social
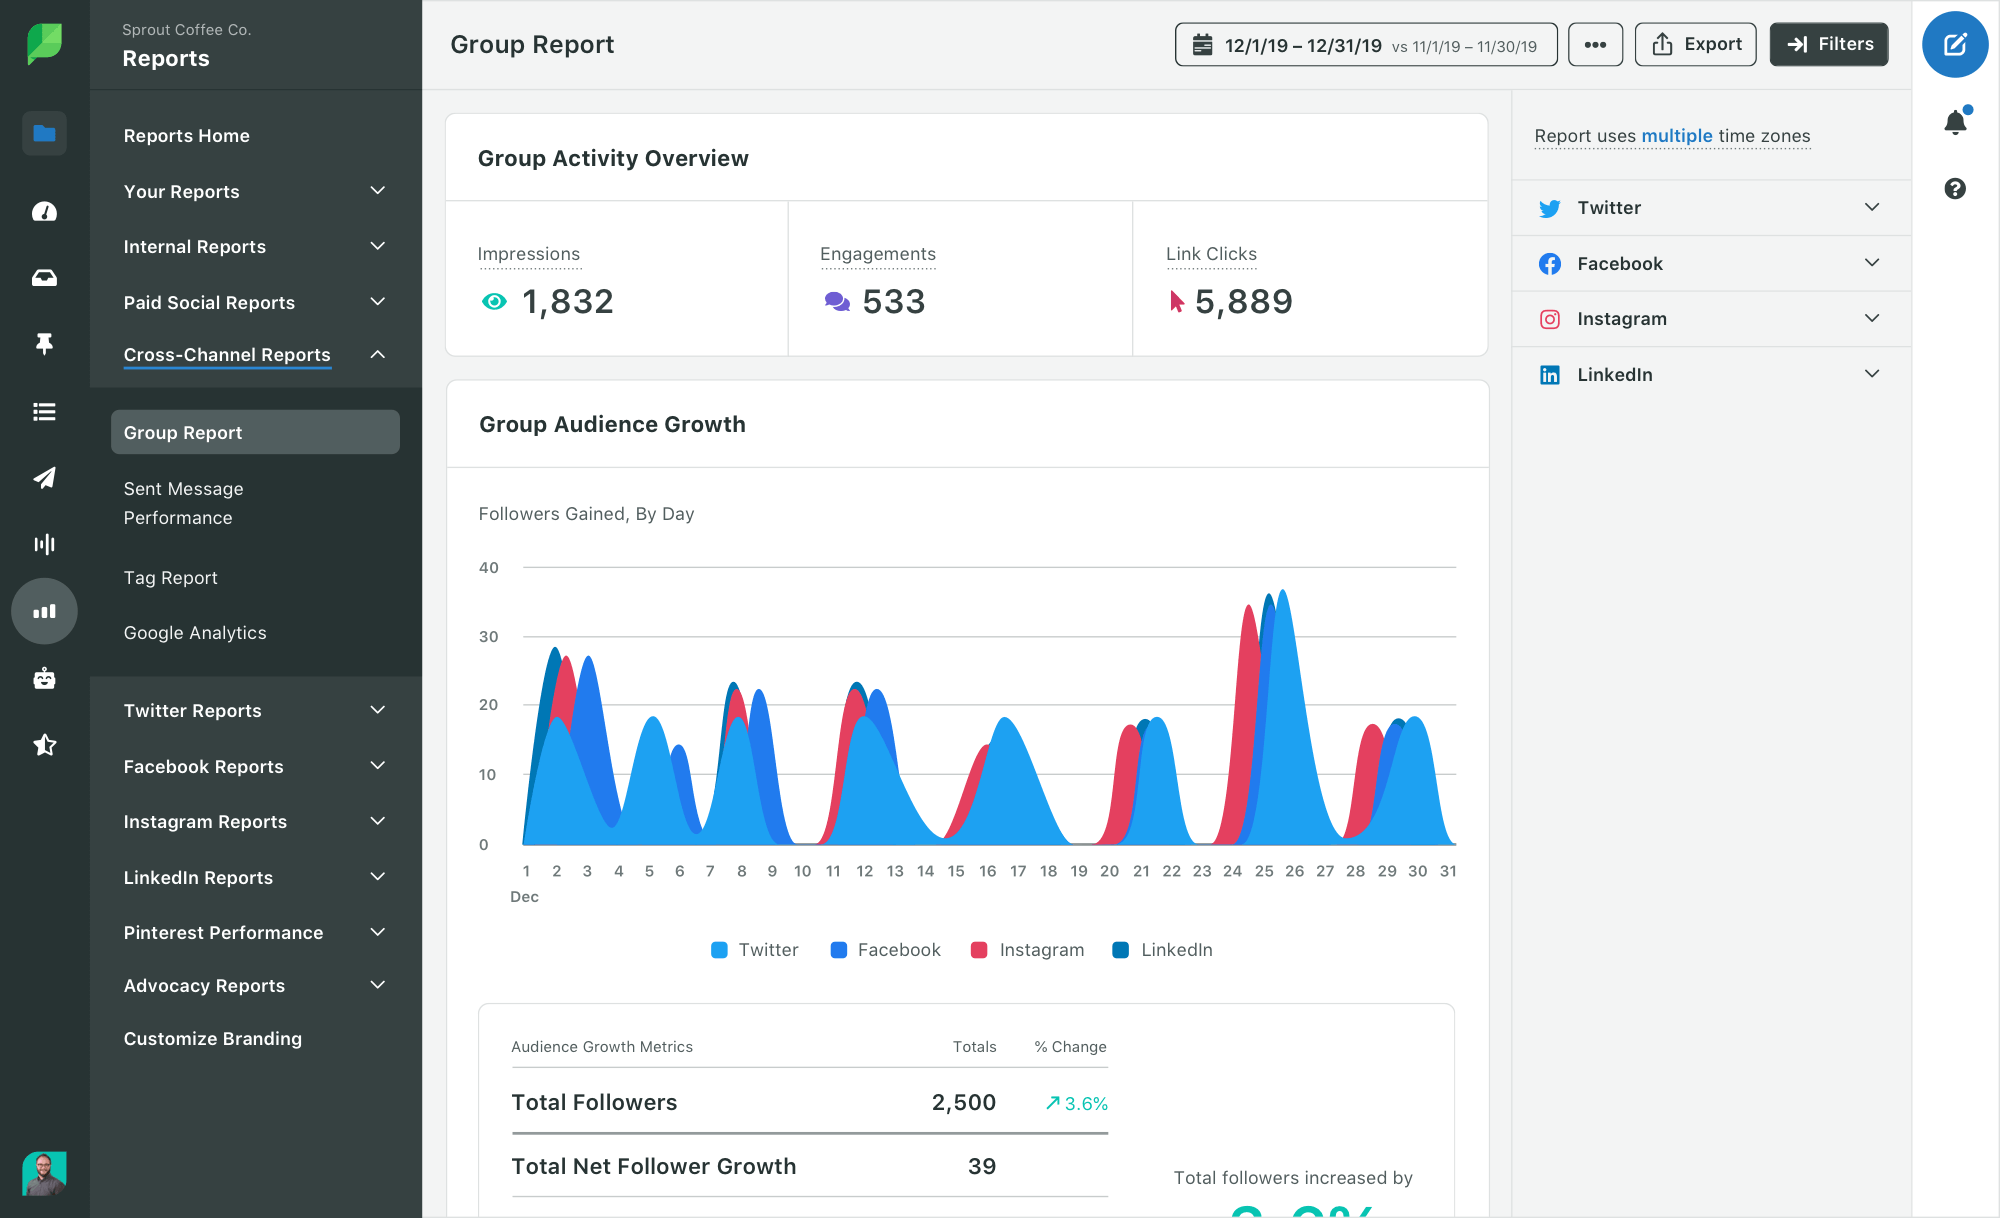
Sprout Social is a social media marketing analytics platform for scheduling and publishing content across multiple social networks from a single, unified interface.
This simplifies social media campaign management, which in turn enables more efficient workflow and consistent messaging.
Apart from basic scheduling, Sprout Social is an advanced analytics tool for marketing that provides deep insights into social media performance.
These analytics help marketers understand audience behavior, campaign effectiveness, and the overall impact of social media activities on their clients’ or stakeholders’ business goals.
The platform's listening tools analyze the sentiment and context of social conversations, offering valuable insights that can inform content creation and marketing tactics.
Key features:
- Social calendar
- Social content library
- Custom reports
- Sentiment analysis
- Chatbots integration
Who is Sprout Social for?
Marketing agencies, businesses, and social media managers looking to analyze and optimize social media strategies and improve overall engagement across various social media platforms.
Pros:
- User-friendly interface
- Unified inbox feature
- In-depth and customizable reports
- Social listening
Cons:
- Higher cost compared to some competitors
- Limited automation features
- Limited functionality of certain integrations
- Limited reporting capabilities
While Sprout Social has native reporting capabilities, you’ll run into limitations when you try to tailor the reports to specific client requests or combine specific metrics for your visualizations.
Also, depending on the integration, you may not have access to historical data from when you connected your accounts.
If you want total flexibility to design your reports, organize your metrics, and include data from all marketing sources you have, you need a dedicated marketing reporting software that can scale as your business grows.
Pricing
Sprout Social offers four pricing plans based on the availability of advanced social media scheduling and analytics features.
10. Heap
Heap is marketing insights software that gives you a complete understanding of your customers’ digital journeys so you can quickly improve conversion, retention, and customer experience.
It allows you to easily divide your critical clients into relevant segments, monitor them separately, and use the insights to optimize for a better customer journey or experience.
Key features:
- Autocapture
- Detailed user segmentation
- Funnel analysis
- Event visualizer
- Cohort analysis
- Custom reports and dashboards
Who is Heap for?
Data analysts and marketers to track the effectiveness of marketing campaigns, optimize conversion funnels, and segment audiences by diving deep into user behavior data analytics.
Pros:
- User-friendly interface
- Automatic capture of all user interactions
- Retrospective analysis
- Advanced segmentation and cohort analysis
- Connection with a range of third-party tools
Cons:
- Expensive for smaller businesses or startups
- Advanced analyses may require a steep learning curve
- Extensive data collection can be overwhelming without effective filtering and segmentation to extract meaningful insights
Pricing
Heap offers four pricing plans, including a free plan, based on the specific marketing analytics needs and the available advanced functionalities.
11. Funnel
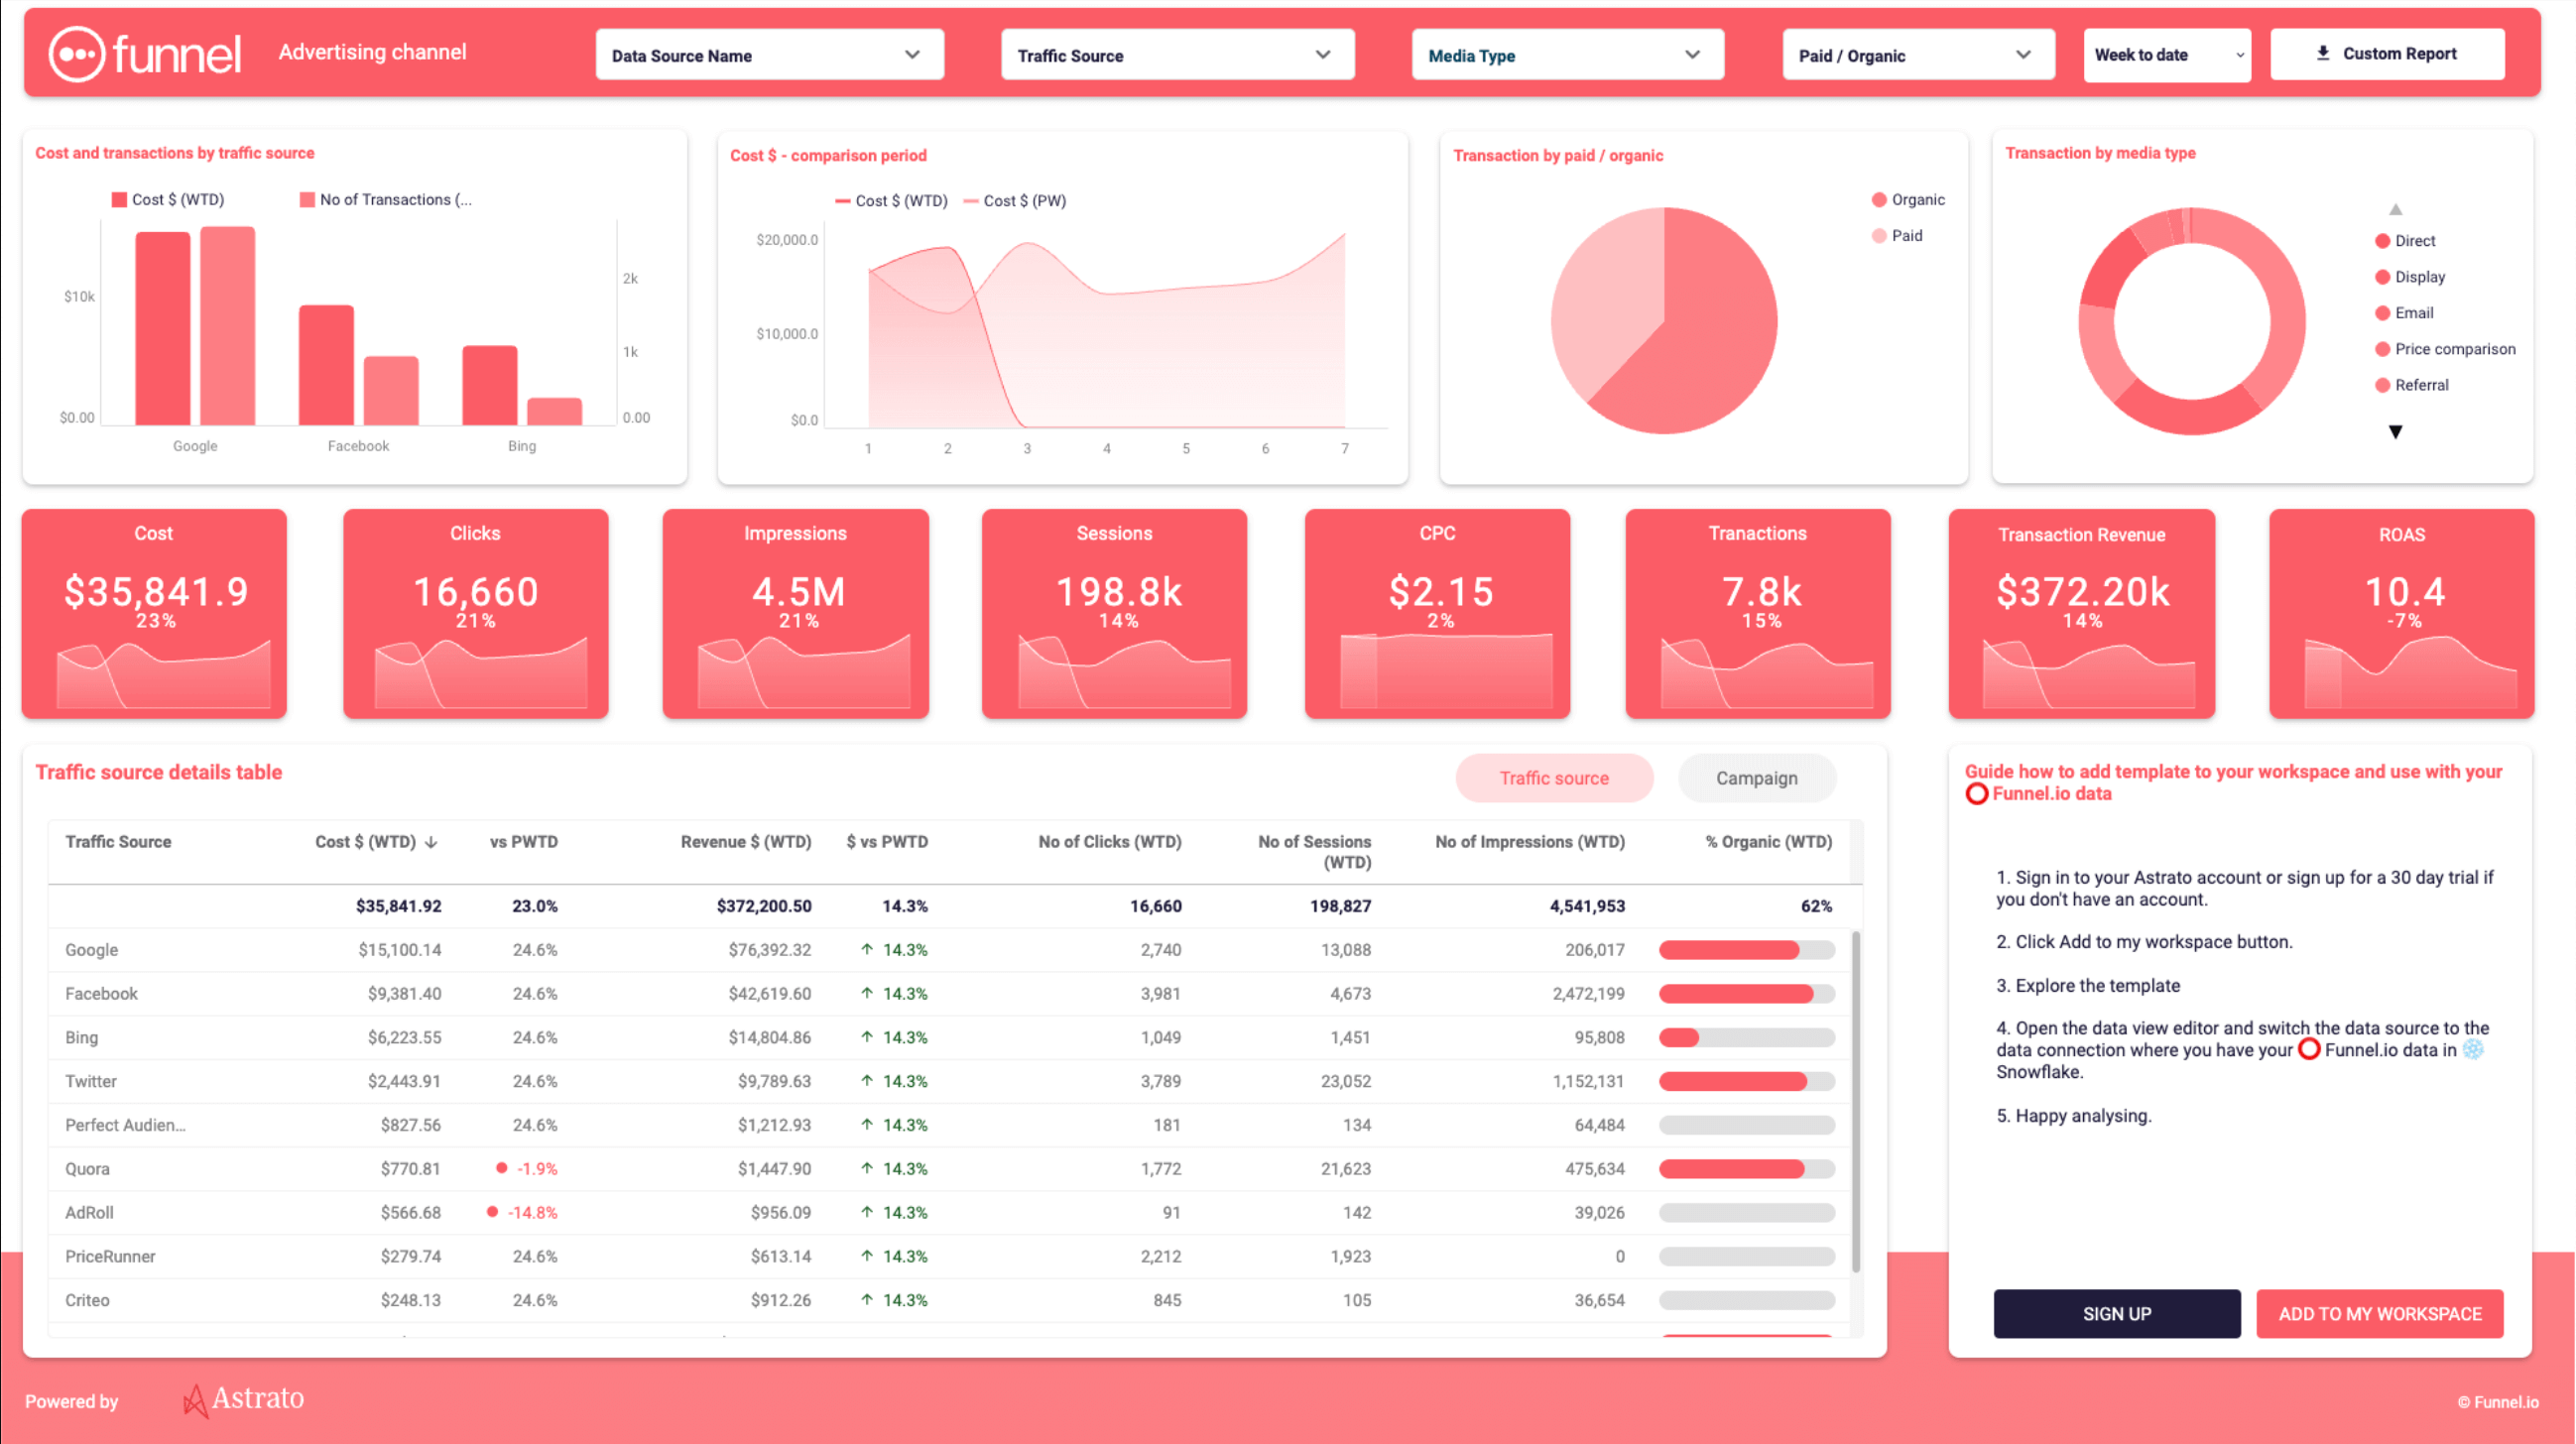
Funnel is an analytics tool for digital marketing that automates data collection, transformation, and loading to streamline marketing reporting and analysis.
This marketing analytics software connects with over 500 apps and platforms, including PPC, e-commerce, email marketing platforms, CRMs, and more.
Funnel allows users to manage raw data, customize the frequency of imports and exports, and perform automated data categorization.
However, Funnel supports a limited number of marketing analysis functions and performs only basic data transformation tasks. Any advanced data processing tasks should be done manually or using other data transformation tools.
Key features:
- Integration with over 500 data sources
- Consolidates data from multiple sources into a single dashboard
- Custom metrics and calculations
- Automated reporting
- Exports data to various formats and destinations such as Google Data Studio, Google Sheets, Excel, and data warehouses like BigQuery and Snowflake.
Who is Funnel for?
Funnel is used by data analysts to integrate marketing data with other business data for holistic analysis. Marketing agencies can also use it to manage multiple client accounts and consolidate marketing data across various channels.
However, since Funnel has only basic native visualization capabilities, a marketing analytics platform that covers an entire data journey would be a better choice for agencies.
Pros:
- Wide range of integrations
- User-friendly interface
- Automated data handling
- Suitable for businesses of all sizes, from small teams to large enterprises
Cons:
- Significantly more e than most of the competition
- Steep learning curve
- Users report delays in data updates from certain sources
- No automated reporting
Pricing
Funnel has three plans — Starter, Business, and Enterprise, while the subscription cost is based on the number of flexpoints. Flexpoints are capacity-based units that measure your usage of connectors, destinations, and other data features.
12. Adobe Analytics
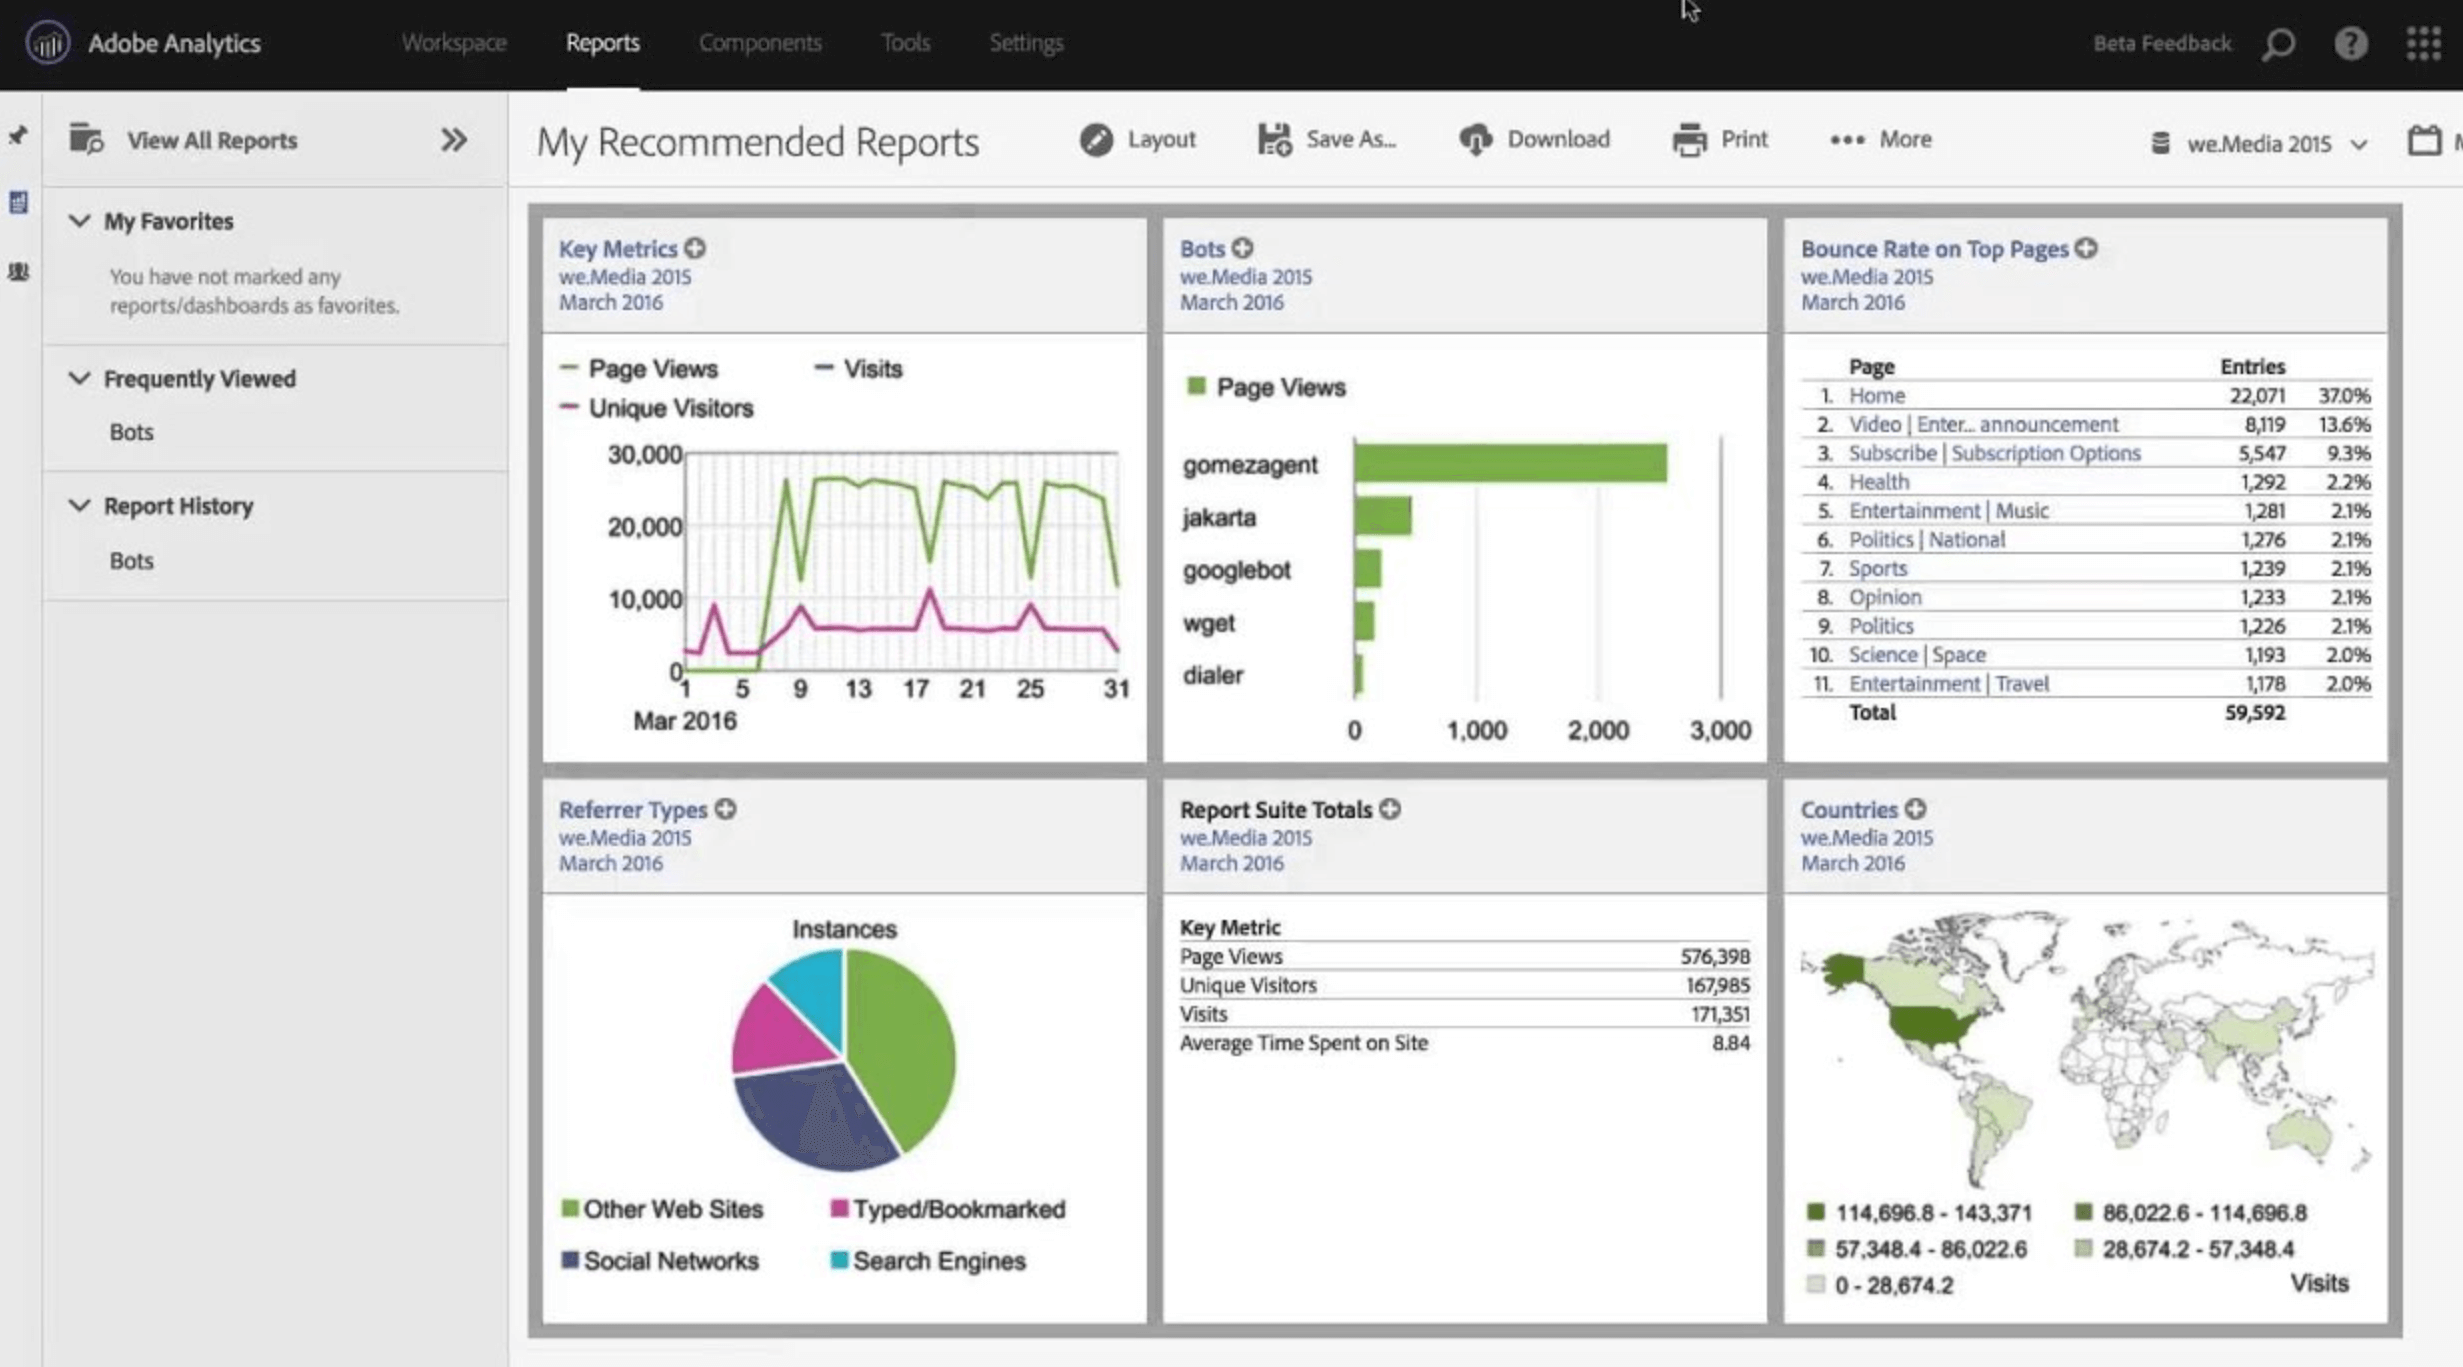
Adobe Analytics is an advanced analytics tool — part of Adobe Experience Cloud — that provides comprehensive data analysis capabilities for web and mobile applications.
The primary function of Adobe Analytics is to collect and segment user data, which leads to detailed and customizable reports that reveal user behaviors, preferences, and trends.
Adobe Analytics also offers advanced segmentation and cohort analysis, which allows marketers to create detailed user segments based on different criteria and track their behaviors over time.
Finally, flow analysis and pathing tools within Adobe Analytics give marketers insights into the customer journey, demonstrating how users navigate a website or app.
This helps marketing teams optimize user flows and boost conversion rates by addressing potential friction points.
Key features:
- Detailed user segmentation
- Cross-channel analytics
- Unified customer view
- Machine learning models
- Interactive dashboards
- Automated reporting
Who is Adobe Analytics for?
Marketing teams in large enterprises with complex data needs and extensive marketing campaigns.
Pros:
- Comprehensive analytics
- Highly customizable reports
- Seamless integration with other Adobe Experience Cloud products
- Real-time data
- Predictive insights
Cons:
- Steep learning curve
- High pricing structure
- Time-consuming implementation
- The depth of features might lead to overwhelming data, making it challenging to focus on key metrics
Pricing
Adobe Analytics does not have a transparent, fixed pricing structure published online. Pricing is typically customized based on several factors, such as the size of the business, number of users, features and add-ons, and data volume. To obtain specific pricing, you need to contact Adobe’s sales team for a tailored quote based on your unique requirements and usage scenarios.
13. Matomo
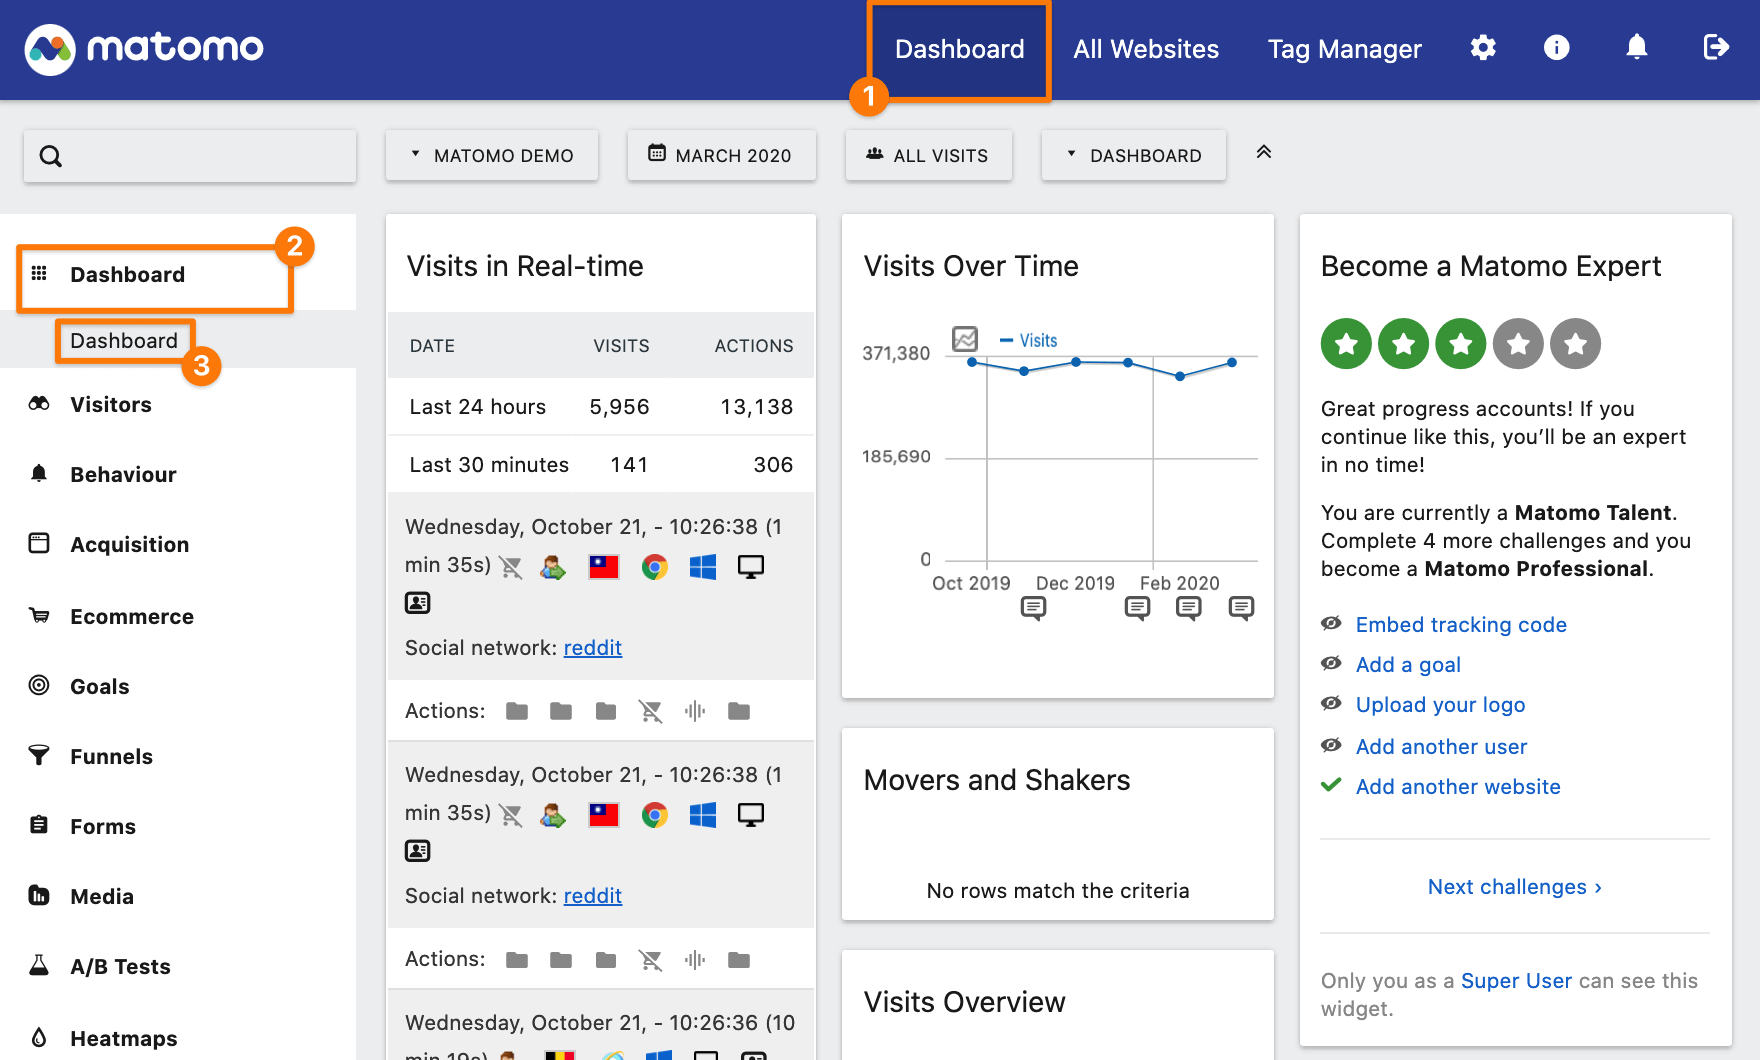
Matomo is an open-source web analytics platform that provides detailed insights into website and mobile app performance. It is designed to offer comprehensive analytics while prioritizing user privacy and data ownership. Formerly known as Piwik, this digital analytics platform enables businesses to track and analyze user behavior, measure key performance indicators (KPIs), and optimize their digital presence.
Key features:
- Comprehensive website analytics
- Privacy and data ownership
- GDPR compliance
- Self-hosted option
- E-commerce conversion tracking
- Mobile tracking
Who is Matomo for?
Matomo is ideal for large enterprises that prioritize data privacy and need advanced customization and extensibility.
Pros:
- Highly customizable with numerous plugins
- Full control over data and compliance with privacy regulations
- Flexible and transparent open-source platform
- Both free and competitively priced version
Cons:
- Self-hosting requires technical expertise to set up and maintain
- UI is less polished compared to other analytics tools
- Steep learning curve
- Self-hosted versions may take up significant server resources
Pricing
Matomo has two pricing plans: On-Premise and Cloud. The Cloud plan depends on your monthly website traffic expressed as hits, while the On-Premise is initially free but includes paid add-on functionalities.
FAQs
What is a marketing analytics tool?
Marketing analytics tools provide a wide range of functions, from tracking website traffic and social media engagement to analyzing customer behavior and predicting sales trends. They allow marketers to dive deeper into the data and identify patterns, customer segments, and opportunities for optimization. On the client or stakeholder side, marketing analytics tools can influence data-driven decisions.
What is marketing analytics software used for?
Marketing analytics software helps marketers get a full overview of their marketing performance. With analytics tools and software, they can track the results across all campaigns, monitor the number of leads generated by each channel, calculate metrics, report to clients or stakeholders, and more.
What is the future of marketing analytics?
In the future, marketing analytics will increasingly rely on artificial intelligence and use machine learning models for forecasting. Generative AI for marketing is becoming increasingly significant, offering capabilities like automated content generation and predictive analytics. The critical ability of generative AI in marketing analytics is to turn data into instant insights, which foster decision-making and help businesses optimize their marketing activities.
Published on May 29 2024
WRITTEN BY
YamonYamon is a Senior Content Marketing Manager at Whatagraph. With an eye for detail and a knack for always considering context, audience, and business goals to guide the narrative, she's on a mission to create genuinely helpful content for marketers. When she’s not working, she’s hiking, meditating, or practicing yoga.