Discover a Powerful Looker Studio (Google Data Studio) Alternative
Whatagraph offers an easy-to-use, all-inclusive platform to connect, organize, visualize, and share all your marketing data with excellent support. Explore a fast and reliable Looker Studio alternative with native integrations, no-code data blending, intuitive cross-channel reporting, and time-saving team features.
- 55+ native integrations
- Live chat customer support
- No extra connectors needed
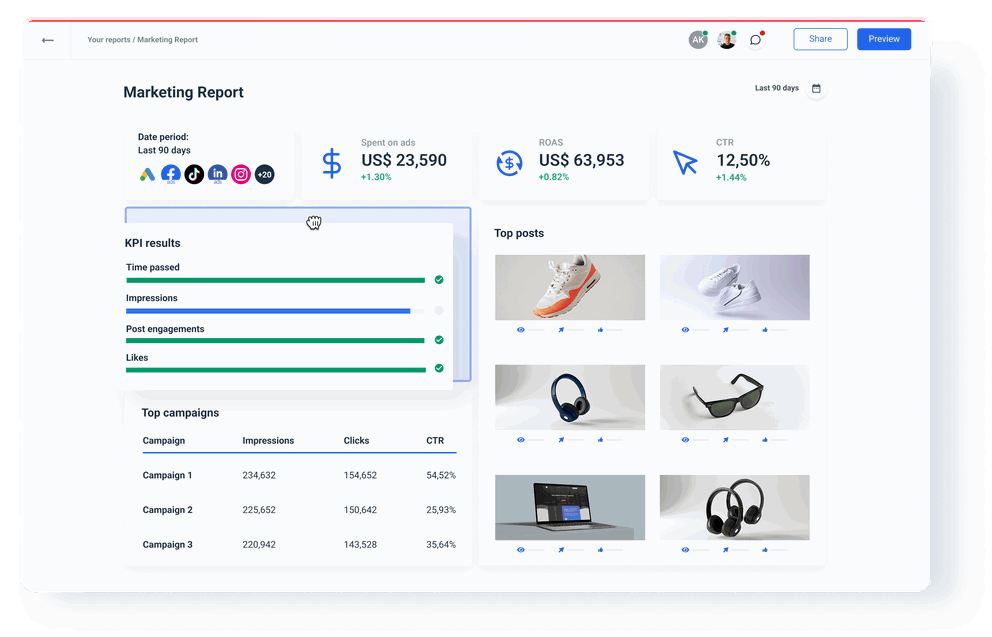


3 Reasons to Choose Whatagraph as Your Looker Studio Alternative
No connectors needed
Whatagraph has direct integrations with popular marketing sources. Looker Studio natively connects only with the Google ecosystem. You will need third-party connectors like Supermetrics to add other data sources, which slow things down, cost money, and tend to break off.
Whatagraph is fast and stable
Looker Studio slows down a lot, even when you use just two data sources to create a data blend. In Whatagraph, you can work with 10 sources and 100 widgets simultaneously and won’t notice any speed or stability difference.
Goodbye to Looker Studio limitations
With Looker Studio, you run into a limitation on every corner. You are limited to 5 sources in a data blend. You can’t save and reuse custom metrics in two different widgets without recreating them from scratch. Many actions are limited to the widget level, with no way to scale them.
An all-in-one Looker Studio alternative
No additional connectors. No extra payments. A single platform for all your marketing data needs.
 | ||
|---|---|---|
| General points | ||
| Speed and stability | ||
| Reusable assets | ||
| Save and link templates together to edit all at once | ||
| Support | ||
| General time spent and effort invested | ||
| Connect | ||
| Native integrations | ||
| Consistent data refresh rate | ||
| Cross-channel reporting | ||
| Organize | ||
| Data organization capabilities | ||
| No limitations | ||
| Intuitiveness | ||
| Scalability, reusing, and editing rules and blends | ||
| Visualize | ||
| Pre-made widgets | ||
| Linked templates | ||
| Customization and white-labeling | ||
| Share | ||
| Links to live dashboards | ||
| Marketing reporting automation | ||
| Export to spreadsheets | ||
| Data transfer to a warehouse | ||
Looker Studio Pros and Cons – What Do Users Say?
The learning curve is steep. It can be really difficult to figure out how to use it at first. But once you get the hang of it, it's great!
I like because is free. I also like its integration with multiple data sources, which allows me to have all my dashboards centralized with the data from all my applications.
As a data-nerd, I love to incorporate a lot of charts, however there is a limit per page that I seem to hit rather often.
The best thing is the number of metrics and graphs that you can capture, not only from the point of view of utility but also visually. Also, being a Google product, it perfectly integrates Google Ads and Google Analytics metrics.
Frequently Asked Questions
Is Whatagraph a good Google Data Studio Alternative?
Yes, Whatagraph is a good Google Data Studio alternative, especially for marketers who are looking for more flexibility, stability and support than what GDS offers. Whatagraph allows you to track the results marketing campaigns, organize data for faster insights, as well as zoom down into the performance of individual teams. On top of it, Whatagraph comes with transparent pricing plans, which help with budget planning.
How does Looker Studio pricing work?
Looker Studio is free if you use data from Google products. If you want to include data sources outside the Google platform, you need to pay a monthly subscription and purchase third-party connectors for those data sources.
There’s also the premium, paid version called Looker Studio Pro. It has extra features like a team dashboard, connection to Google Cloud projects, and better support. However, unlike most other alternatives to Looker Studio, there’s no information about how much it costs.
You’ll have to request a demo and if Google recognizes you as their ICP, you’ll get custom pricing according to your needs.
As a viable Looker Studio alternative, Whatagraph provides absolute transparency when it comes to pricing. All the native integrations and data transfer are available in all pricing plans, and you can clearly see what features you’re paying for.
Are Looker Studio reviews mainly positive or negative?
Looker Studio reviews are mainly positive, with users praising the free price and the abundance of third-party connectors. However those who moved to Whatagraph or other Looker Studio competitors point out too basic visualization, limitations to data blending, and a steep learning curve needed to master the tool.
Is Whatagraph a good data visualization tool for small businesses?
Yes, Whatagraph is a good data visualization and data analysis tool for small businesses, especially those who are looking for more stability and support that open source tools can offer. Whatagraph allows managers to track marketing campaigns and product sales, as well as zoom down into the performance of individual teams. On top of it, Whatagraph comes with transparent pricing plans, which help with budget planning.
