Google Sheets Integration

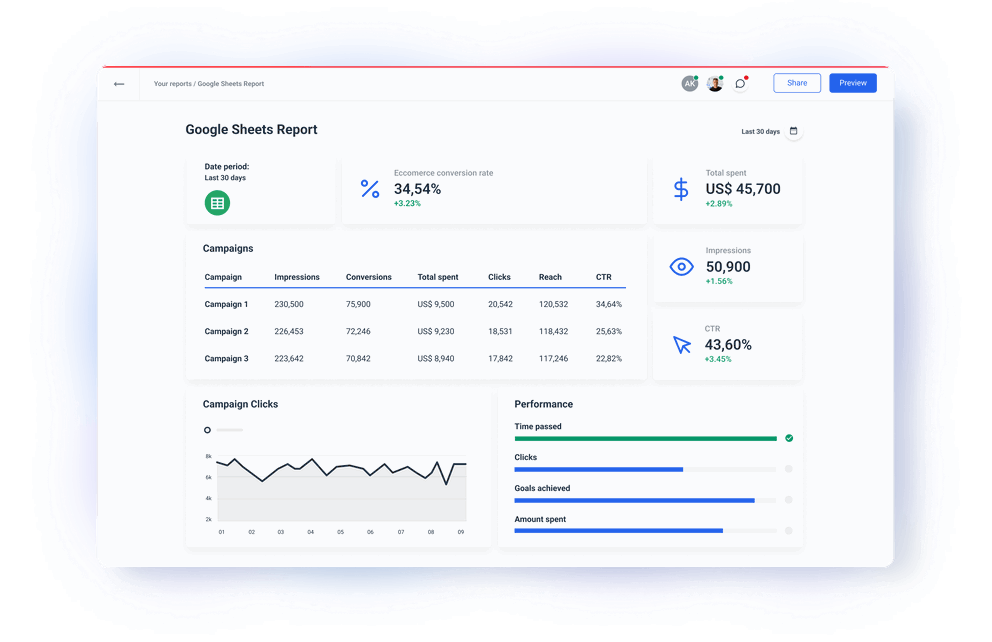
Expand your data management abilities beyond the current Whatagraph integrations. Connect, organize, visualize, and share insights from any marketing data source via a fully managed Google Sheets integration. Effortlessly connect your Google account and use Google spreadsheets as a source. Organize data from connected sheets before you visualize it in Whatagraph. Share insights from your marketing data automatically as scheduled emails or live links.

    Google Sheets Integration - No Code Connector
    2000+
    pre-made widgets
    45+
    native integrations
    58K+
    reports built monthly

    A direct no-code data connection to Google Sheets API

    Native integration
    Native integration
    Ready-made connection. No additional set up or connectors needed. Just log in and get data connected to your reports and dashboards.
    Organize
    Organize
    Manage and transform your data without code or technical knowledge. Blend, unify, aggregate, and group data points with ease.
    Visualize
    Visualize
    Create stunning visualizations of your connected and prepared cross-channel data. Quickly turning it into full reports, or standalone graphs, charts, funnels, and tables.
    Share and automate
    Share and automate
    Share a link to live report with interactive data and date range picking. Schedule report send out customizing emails and notifications to review.

    Bring your data from any source to Whatagraph via a fully managed Google Sheets connector

    Connect, organize, and visualize the essential metrics from all your sources in Whatagraph while leveraging the versatile connectivity of Google Workspace. Connect spreadsheets with data from other marketing apps you use. Create cross-channel reports and dashboards with custom formulas and multi-source tables. Whatagraph monitors changes in your Google Sheets and lets you quickly share important data with stakeholders.
    Google Sheets sample report
    Google Sheets sample report

    Everything you need to visualize and share Google insights

    Google Analytics 4 Reporting Tool icon

    Google Analytics 4 Reporting Tool

    Report on essential Google Analytics 4 metrics for a 360-degree view. Connect, organize, visualize, and share Google Analytics 4 data with your clients in a few clicks. Engaging GA4 reports only a few clicks away.
    See more
    Google Analytics Dashboard Card Icon

    Google Analytics 4 Dashboard

    Present your clients with a custom Google Analytics 4 dashboard that pulls real-time data from their GA4 accounts. Track key web analytics metrics and transform them into actionable client-ready GA4 dashboards.
    See more
    Google Ads Reporting Tool icon

    Google Ads Reporting Tool

    Powerful Google Ads reporting tool for digital marketing agencies. Design your Google Ads reports according to your clients’ needs. Get access to accurate PPC metrics like CPC, click-through rate, conversion rate, impressions, and more.
    See more
    Google My Business Reporting Tool icon

    Google My Business Reporting Tool

    Capture valuable search traffic with the Google My Business report from Whatagraph. Find out how many customers directly searched for your business, and how many total views and actions you receive monthly.
    See more
    Google Analytics 4 Reporting Tool icon

    Google Analytics Reporting Tool

    Stay on top of your website performance with our Google Analytics reporting tool. Get all your KPIs in one place and transform them into actionable insights. Create your own GA report in minutes, without complex spreadsheets and graphs.
    See more
    Google Search Ads 360 Reporting Tool icon

    Google Search Ads 360 Reporting Tool

    Whatagraph helps agencies create awesome visual Google Search Ads 360 reports in mere minutes. Drag and drop pre-made widgets to visualize Google Search Ads 360 performance across different campaigns, ad groups, keywords, and ads.
    See more
    Google Sheets Reporting Tool icon

    Google Sheets Reporting Tool

    Spreadsheets play a huge role in many agencies. Yet, it’s not an efficient tool to deal with huge volumes of data. Visualize your data with our Google Sheets reporting tool. No more manual data entry - Whatagraph does the heavy lifting!
    See more
    Google Analytics PDF Reporting Tool icon

    Google Analytics PDF Reporting Tool

    Whether you use the tool for just Google Analytics or cross-channel reporting, sometimes the most convenient way to keep the stakeholders informed is by sending a weekly or monthly PFD report they can download, print, or share.
    See more

    Explore marketing automation and custom report features

    Linked reports
    Linked reports
    Create team templates and connect as many reports as needed. Never again manually edit hundreds of similar reports one by one.
    Overview reports
    Overview reports
    Monitor your overall performance across regions or accounts and find new opportunities for growth.
    Custom branding
    Custom branding
    Implement custom color themes and logos. Remove all mentions of Whatagraph and connect your custom domain.
    Data blending
    Data blending
    Combine metrics from multiple data sources in a widget or table to track cross-channel campaigns in one place.

    Pick a template and start reporting

    View All Templates

    No credit card required

    Google Analytics 4 Report Template
    Google Analytics 4 Report Template
    Use our Google Analytics 4 Report Template to build intuitive and detailed GA4 reports for your clients. Aggregate traffic, demographics, time on site, and other conversion funnel data.
    View template
    Google My Business Report Template
    Google My Business Report Template
    An easy way for agencies to report on the success of their Google My Business campaigns to their clients and show how their business fares in Google and Google Maps searches.
    View template
    Google Ads Report Template
    Google Ads Report Template
    Keep your essential Google Ads KPIs and performance metrics in one place and get an in-depth analysis of your ads and ad campaigns.
    View template
    Google My Business Dashboard Template
    Google My Business Dashboard Template
    Google My Business dashboard template quickly aggregates all GMB insights for your listing - discovery searches, local search results, photo, and map views, and much more into one simple dashboard.
    View template
    Google Ads
    Google Ads
    Use our intuitive Google Ads dashboard to analyze your clients’ ad performance at the campaign or keyword level. Whatagraph’s Google Ads dashboard allows you to give clients quick real-time data access to key Google Ads metrics and KPIs.
    View template
    Google Search Console Dashboard Template
    Google Search Console Dashboard Template
    Create a Google Search Console dashboard with Whatagraph and find out how Google currently sees your client’s website. Get valuable real-time insights into traffic, customer behavior, and top landing pages.
    View template

    FAQs

    All your questions answered. And if you can’t find it here, chat to our friendly team.

    Is Google Sheets integration available in all pricing plans?

    Yes, Google Sheets integration is available in all pricing plans, along with other 45+ integrations.

    Are there any other ways to connect custom data to Whatagraph?

    Yes, apart from Google Sheets, you can connect data from any source via a Custom API or by moving it to Google BigQuery data warehouse and adding it as a source.

    Do I need Looker Studio to visualize Google Sheets data?

    No, you don’t need Looker Studio (Google Data Studio) or any other tool to visualize data from your Google Sheets property. Whatagraph is an all-in-one marketing data platform to connect, organize, visualize, and share all your data. This makes Whatagraph a better choice than other data platforms that only connect data so you need to use another tool to visualize and share it. 

    How to connect Google Sheets data to Whatagraph?

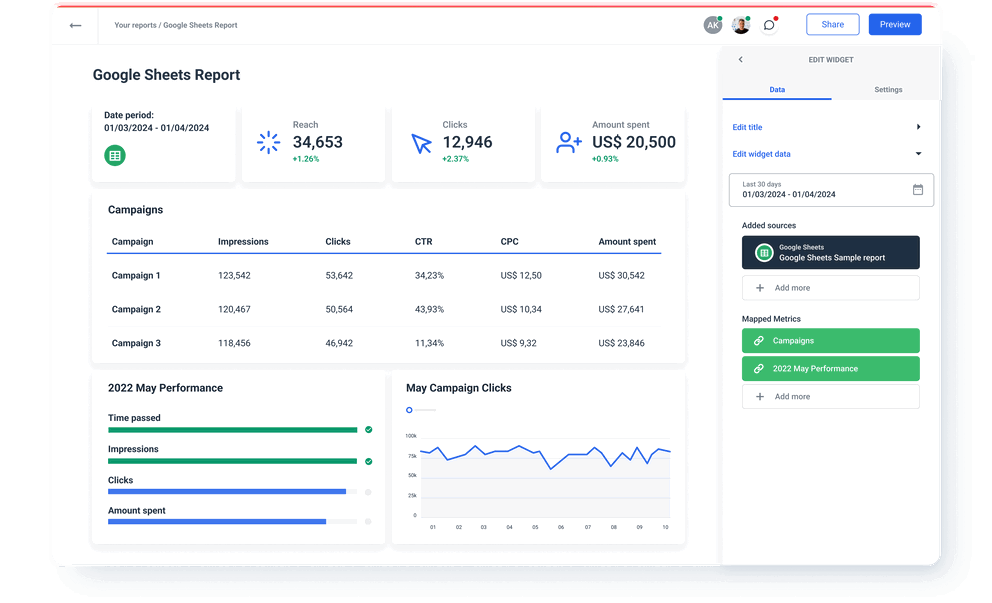
    Whatagraph has a pre-built Google Sheets connector, so you don’t have to purchase and configure third-party data connectors. Adding a new Google Sheets source is simple:


    1. Go to the Data Sources menu and locate Google Sheets among the channels.


    2. Click Connect an account.


    3. From there, you’ll be redirected to log in to your Google account.


    4. Once forwarded to Google, choose to trust Whatagraph to access your account.


    ​5. The new Google Sheets source will appear.


    You have successfully created a connection to your Google Sheets API. Create a custom report or dashboard and add your Google Sheets account as a source.


    When you connect Google Sheets data to Whatagraph, you can organize datasets to get more granular insights by device, campaign ID, date, etc. You can visualize data in various widgets and share the insights via automated email attachments or live links for near real-time access.

    Can I export data from Google Sheets reports?

    Yes, you can export report data as Excel spreadsheets or CSV files. This way, you can easily move it to Tableau, Power BI, or other data destinations for further analysis.

    What is a data range in Google Sheets?

    The data range is the set of cells you want to include in your chart. To set a data range, open a spreadsheet in Google Sheets and double-click on the chart you want to change. Click Setup on the right, and under Data Range, click Grid. Select the cells you want to include in your chart. Click OK.

    What other marketing data sources can I connect with Whatagraph?

    You can connect a range of popular marketing platforms like Google Analytics 4, social media like Facebook Page and Instagram, PPC like Google Ads, Microsoft Advertising, Amazon Ads, CRMs like Salesforce and HubSpot, as well as search engine optimization, email marketing, and e-commerce platforms.

    What is the difference between third-party Google Sheets data connectors and fully managed Google Sheets integrations?

    A Google Sheets data connector is a piece of software, typically built by a third party, to connect two different platforms.


    On the other hand, Whatagraph’s integration directly connects to Google Sheets API with no third-party software in the middle. As a result, the data flow is more stable and secure, and the connection performance doesn’t depend on the policies of third-party vendors.

    What others think about Whatagraph

    I made a switch from GDS and Sheets for reporting to Whatagraph, and I am saving literal hours each week on performance report creation. Our small firm actually managed to onboard 2 new clients as a result of all the time we saved on managing data and reporting. The customer service is also really helpful and easy to reach.

    Mindaugas S., Marketing Consultant Capterra logo for Whatagraph review

    Capterra verified review by

    Mindaugas S., Marketing Consultant

    Having active customer support to help fix any issues was a big contributor, but we also really liked the ability to save templates and connect sources to multiple charts/widgets at once without having to edit them individually. And having the grid layout is much easier to stay consistent with than the free form setup that Data Studio has.

    Nico T., Media Planner Capterra logo for Whatagraph review

    Capterra verified review by

    Nico T., Media Planner

    The system has standard templates that are easy and fast to use. Also you can build your own report with lightning speed. It is very easy to use, has a lot of integration, and let get started very fast.

    Rasmus Bernt K., External Senior Management Consultant Capterra logo for Whatagraph review

    Capterra verified review by

    Rasmus Bernt K., External Senior Management Consultant

    We love Whatagraph - we would definitely recommend and our account manager is great! I love how easy this tool is to use, everyone on the team finds it much more user-friendly than other dashboards. Integration was easy, we sent some example reports to the team who duplicated these for us. We literally had to log in and send it to our clients!

    Stephanie S., Digital Director Capterra logo for Whatagraph review

    Capterra verified review by

    Stephanie S., Digital Director

    We are showing our clients the work that we're doing for them and this is incredibly important for our clients ROI. They want to see results and having a tool like Whatagraph that can show data from virtually every source we use is hugely important.

    John S., SEO Strategist Capterra logo for Whatagraph review

    Capterra verified review by

    John S., SEO Strategist

    The tool is easy to use; you do not need to have development resources. Even my junior project managers are capable of making campaign reports in minutes. There are a lot of pre-made templates you can use as well as many pre-made widgets.

    Erman E., Marketing Specialist Capterra logo for Whatagraph review

    Capterra verified review by

    Erman E., Marketing Specialist

    Really easy to connect data sources within the tool. The library of report templates has been helpful. The customer support team has been responsive to all of our needs. Our team enjoys the simplicity of setting up the reports and how the data is presented.

    Brent N., Director of Operations Capterra logo for Whatagraph review

    Capterra verified review by

    Brent N., Director of Operations

    Easy to create really beautiful graphs and reports which can help other team members to understand the most important takeaways. I especially like the automated report function, so I don't have to check on the same thing repeatedly.

    Orsolya S., Online Marketing Manager Capterra logo for Whatagraph review

    Capterra verified review by

    Orsolya S., Online Marketing Manager