Preparing your data in Looker Studio can be a pain. Whatagraph makes it easier.
You can now connect and organize your data in Whatagraph and send it to Looker Studio in minutes.
Build custom dashboards and visualizations in Looker Studio without needing any manual imports or codes.


From any source to your Looker Studio reports in a couple of clicks
Whatagraph offers an easy-to-use solution for setting up automated data flows to Looker Studio.
Connect all the data you need using our fully managed connectors and organize it any way you want.
Pick metrics and dimensions, preview your future table, and start an automated transfer.


Create accurate Looker Studio reports in less time and trouble
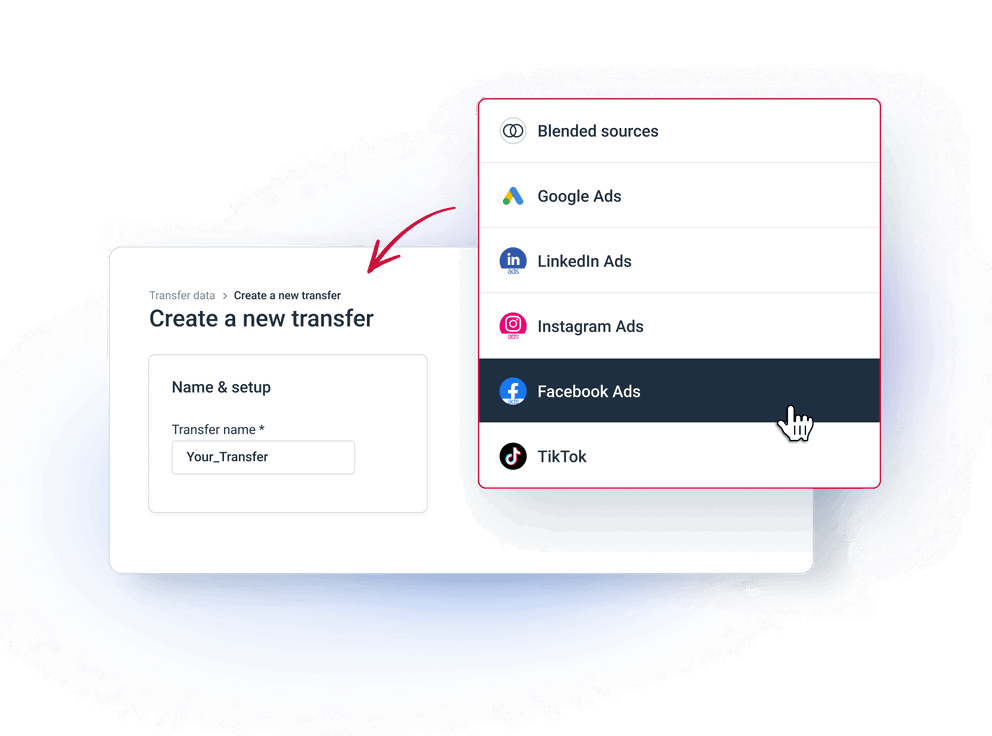
Set up transfers from all your sources in minutes
Pick any marketing channel you already use for monitoring and reporting and get the data moving.
Preview the exact data you'll see in your Looker Studio report and make adjustments on the go.

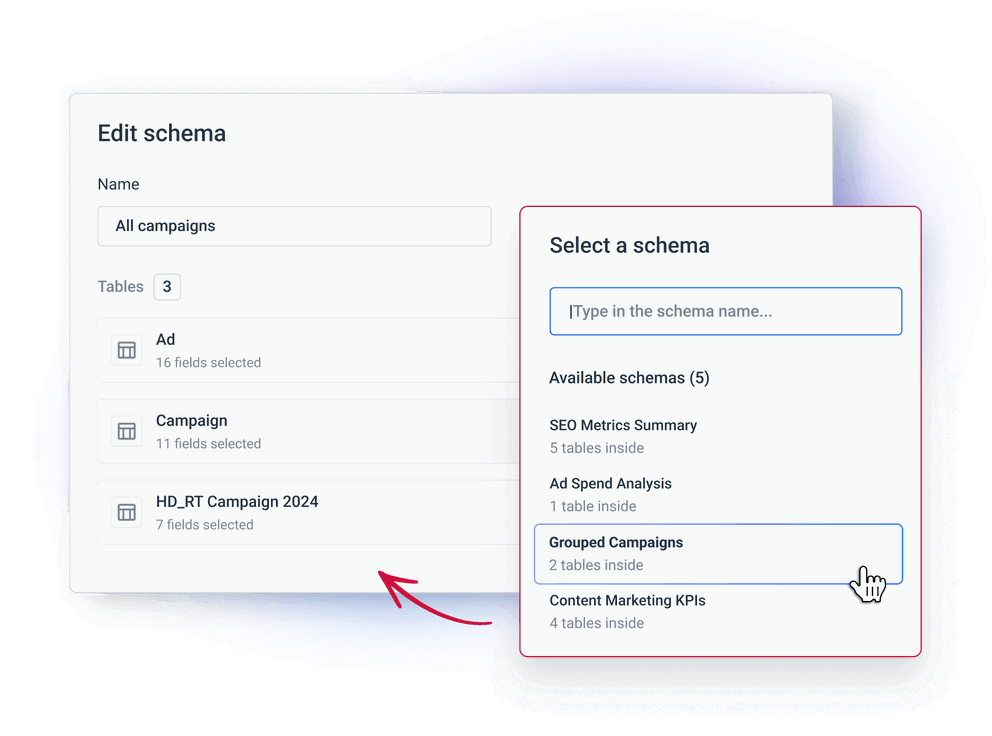
Choose any schema, including blended data
You can choose any metrics and dimensions for transfers that are available from the source.
Add grouped, unified, and aggregated data from blends you create in Whatagraph to get actionable insights faster.

Visualize in Looker Studio
Select the dimensions and metrics you need and create any visualization type available in Looker Studio.
Use the connected data to create unlimited charts and tables that auto-update every 24 hours.


