Custom Dashboard
We understand that every role in any industry has varying data points to monitor, deriving from different data sources. That’s why we’ve built the best custom dashboard report platform for you regardless of your role, industry, or what data sources you use. Whatagraph custom reports will give you an excellent overview of where your business currently stands and provide you with actionable insights to help you move forward.


Spend more time driving better results for your clients
Quick and painless custom report creation
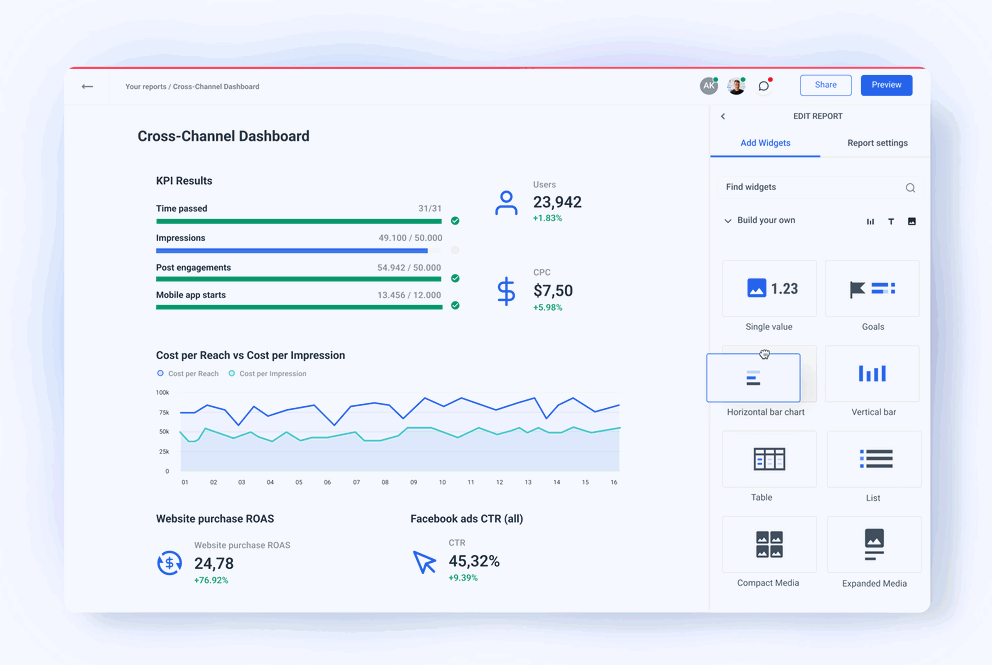
Our custom dashboard reporting tool gives you the power to conjure up detailed, visual reports quickly. Use our pre-made report templates or drag-and-drop widgets to create custom reports that adhere to your company specifications.
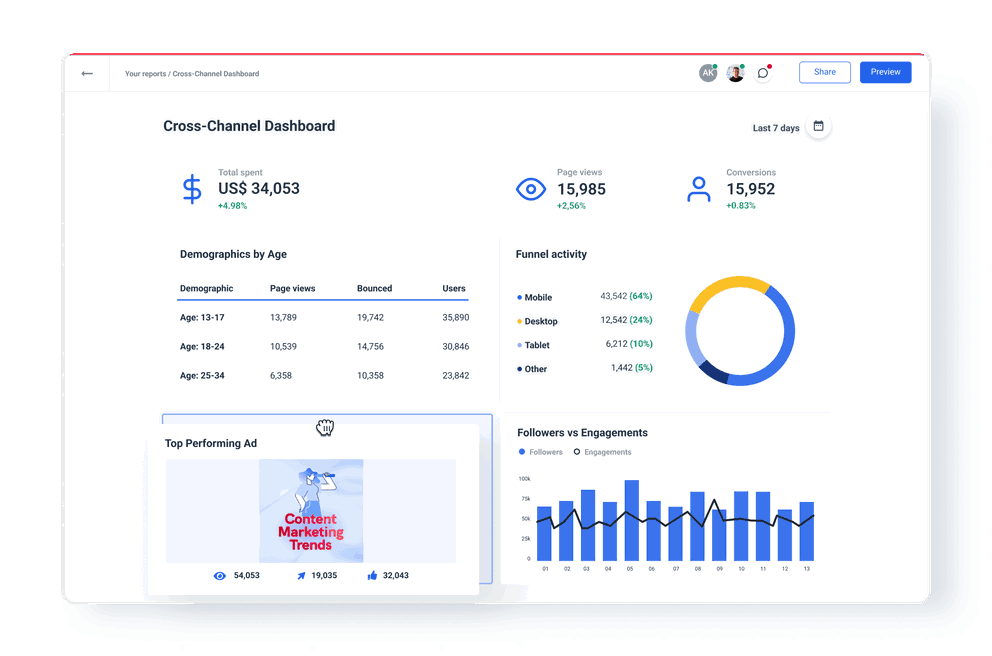
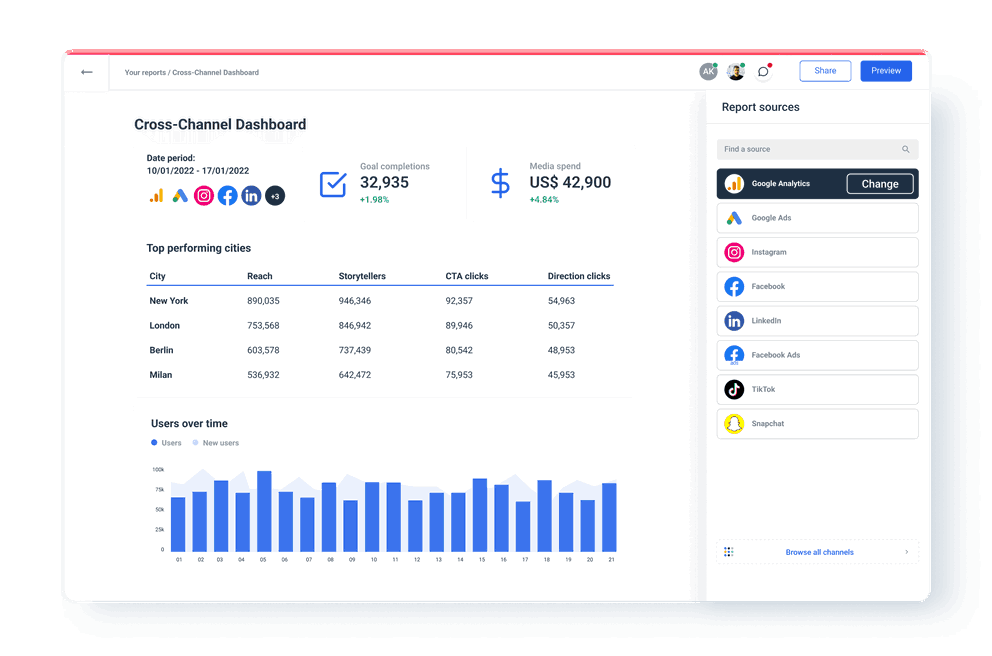
All of your critical metrics in one place
Want to track multiple sources, like marketing, sales, and financial performance data, all in one place? Integrate your platforms - even Google Sheets - and siphon off relevant metrics onto your custom dashboard report in seconds. All of your vital KPIs will be located securely in one place.
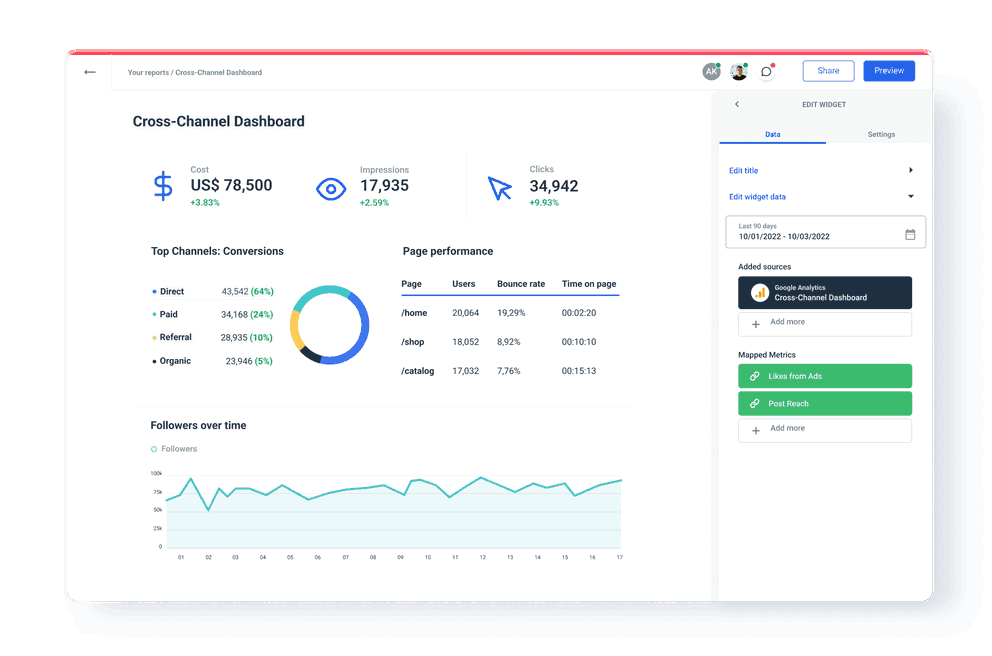
Unmatched visual customization options
Select appropriate data visualization methods – tables, line graphs, bar graphs, number blocks, gauges, and much more – for any metric. You can also pick time intervals based on daily, weekly, monthly, or yearly changes in the parameters of your choice.
All reporting features your agency needs


It’s good to be loved! Our clients are not shy about expressing it.
I made a switch from GDS and Sheets for reporting to Whatagraph, and I am saving literal hours each week on performance report creation. Our small firm actually managed to onboard 2 new clients as a result of all the time we saved on managing data and reporting. The customer service is also really helpful and easy to reach.

Capterra verified review by
Mindaugas S., Marketing Consultant
Having active customer support to help fix any issues was a big contributor, but we also really liked the ability to save templates and connect sources to multiple charts/widgets at once without having to edit them individually. And having the grid layout is much easier to stay consistent with than the free form setup that Data Studio has.

Capterra verified review by
Nico T., Media Planner
The system has standard templates that are easy and fast to use. Also you can build your own report with lightning speed. It is very easy to use, has a lot of integration, and let get started very fast.

Capterra verified review by
Rasmus Bernt K., External Senior Management Consultant
We love Whatagraph - we would definitely recommend and our account manager is great! I love how easy this tool is to use, everyone on the team finds it much more user-friendly than other dashboards. Integration was easy, we sent some example reports to the team who duplicated these for us. We literally had to log in and send it to our clients!

Capterra verified review by
Stephanie S., Digital Director
We are showing our clients the work that we're doing for them and this is incredibly important for our clients ROI. They want to see results and having a tool like Whatagraph that can show data from virtually every source we use is hugely important.

Capterra verified review by
John S., SEO Strategist
The tool is easy to use; you do not need to have development resources. Even my junior project managers are capable of making campaign reports in minutes. There are a lot of pre-made templates you can use as well as many pre-made widgets.

Capterra verified review by
Erman E., Marketing Specialist
Really easy to connect data sources within the tool. The library of report templates has been helpful. The customer support team has been responsive to all of our needs. Our team enjoys the simplicity of setting up the reports and how the data is presented.

Capterra verified review by
Brent N., Director of Operations
Easy to create really beautiful graphs and reports which can help other team members to understand the most important takeaways. I especially like the automated report function, so I don't have to check on the same thing repeatedly.

Capterra verified review by
Orsolya S., Online Marketing Manager