Financial Dashboard
Whether you work in finance or are in charge of financial assets within your organization, you probably review large amounts of data daily. Keeping track of revenue, income, working capital, assets, and more can feel overwhelming.
However, Whatagraph can make these tasks much more comfortable with a financial dashboard template.


Spend more time driving better results for your clients
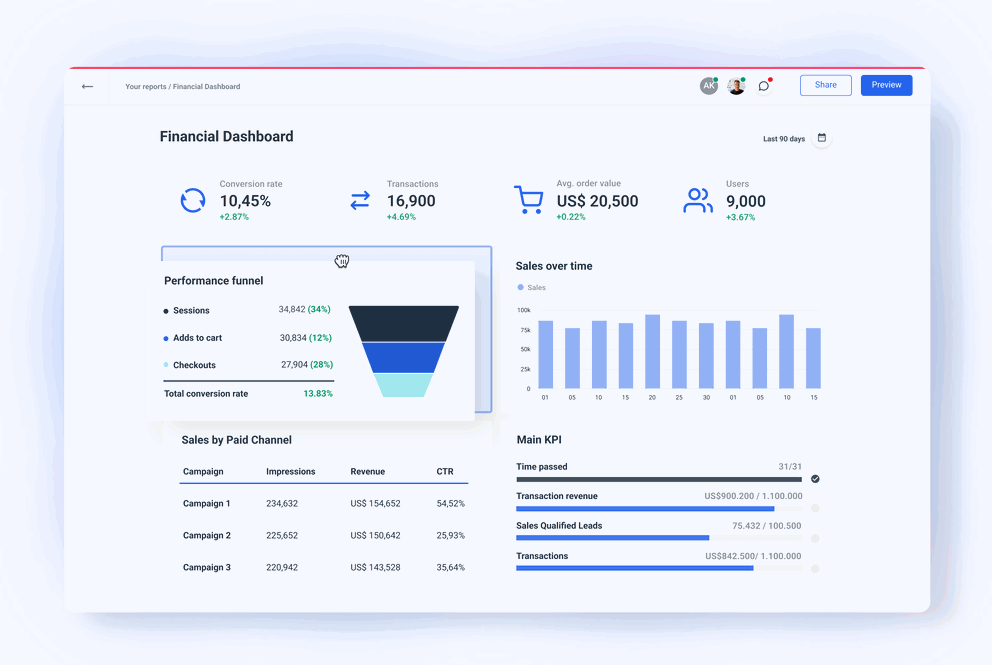
Essential metrics - visualized
Track AR, AP, cash flow, sales, and much more for your firm or your clients, all with a single dashboard report leveraging Excel and Google Sheets integrations.
Use Whatagraph financial dashboard template to create stunning visual stories, which will make financial analysis a breeze.
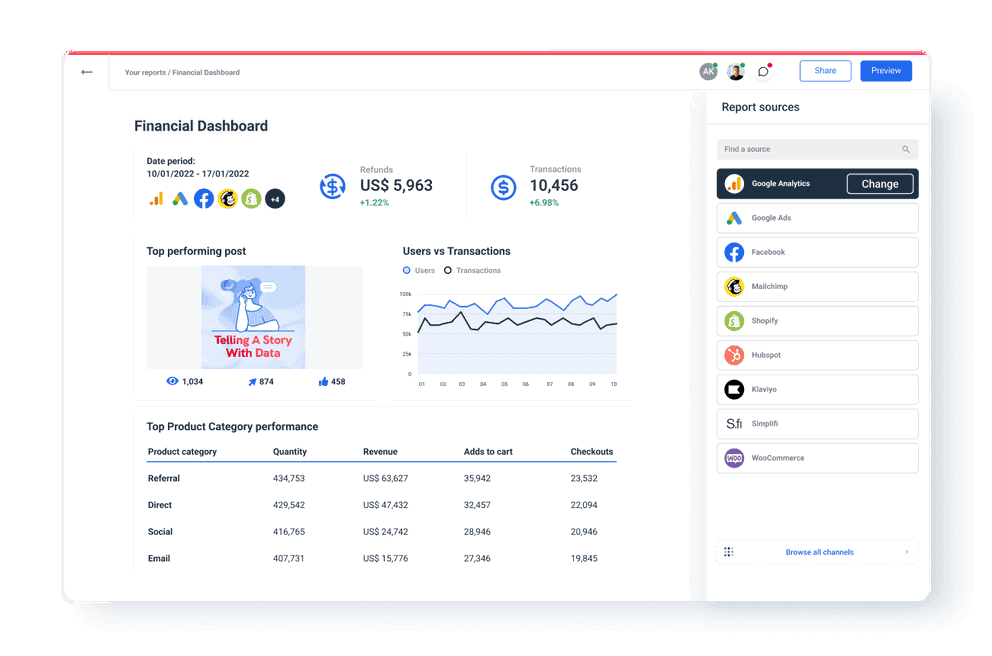
Analytics from various platforms in one location
Whatagraph is a simple yet powerful reporting platform that improves decision-making by combining information from multiple business systems into one location.
Integrate your CRM tools alongside your spreadsheets to build big-picture insights into the financial health of your organization.
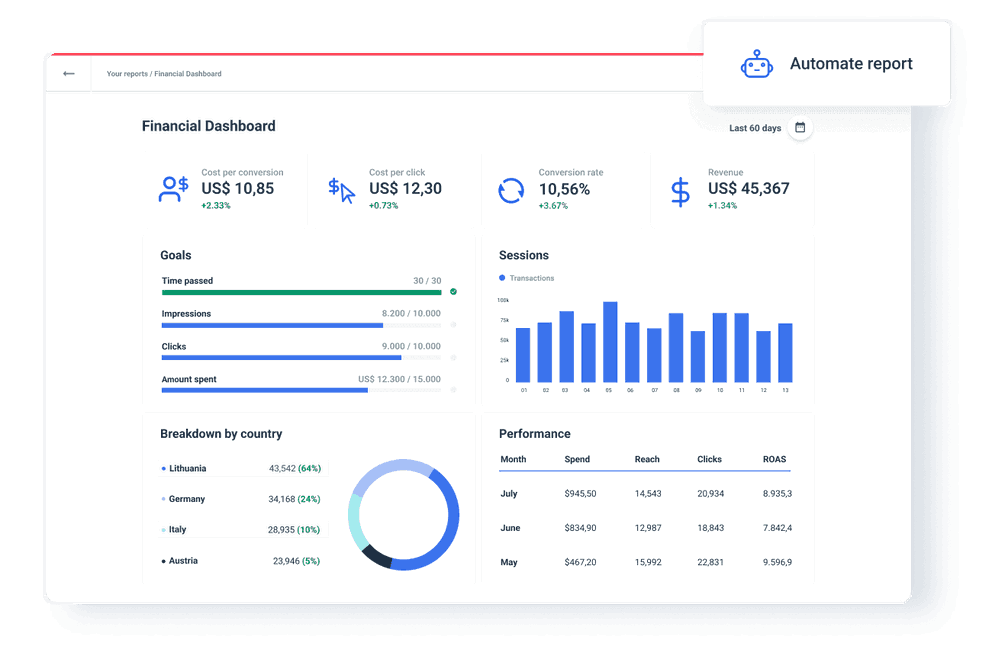
Quick report creation and automated delivery
Accurate financial data is pertinent to the success of any company, regardless of size. Here is where having a financial dashboard and report comes into play.
With the help of Whatagraph, you can create accurate reports based on the most recent data sets and deliver them to those in charge quickly - automatically!
All reporting features your agency needs


It’s good to be loved! Our clients are not shy about expressing it.
I made a switch from GDS and Sheets for reporting to Whatagraph, and I am saving literal hours each week on performance report creation. Our small firm actually managed to onboard 2 new clients as a result of all the time we saved on managing data and reporting. The customer service is also really helpful and easy to reach.

Capterra verified review by
Mindaugas S., Marketing Consultant
Having active customer support to help fix any issues was a big contributor, but we also really liked the ability to save templates and connect sources to multiple charts/widgets at once without having to edit them individually. And having the grid layout is much easier to stay consistent with than the free form setup that Data Studio has.

Capterra verified review by
Nico T., Media Planner
The system has standard templates that are easy and fast to use. Also you can build your own report with lightning speed. It is very easy to use, has a lot of integration, and let get started very fast.

Capterra verified review by
Rasmus Bernt K., External Senior Management Consultant
We love Whatagraph - we would definitely recommend and our account manager is great! I love how easy this tool is to use, everyone on the team finds it much more user-friendly than other dashboards. Integration was easy, we sent some example reports to the team who duplicated these for us. We literally had to log in and send it to our clients!

Capterra verified review by
Stephanie S., Digital Director
We are showing our clients the work that we're doing for them and this is incredibly important for our clients ROI. They want to see results and having a tool like Whatagraph that can show data from virtually every source we use is hugely important.

Capterra verified review by
John S., SEO Strategist
The tool is easy to use; you do not need to have development resources. Even my junior project managers are capable of making campaign reports in minutes. There are a lot of pre-made templates you can use as well as many pre-made widgets.

Capterra verified review by
Erman E., Marketing Specialist
Really easy to connect data sources within the tool. The library of report templates has been helpful. The customer support team has been responsive to all of our needs. Our team enjoys the simplicity of setting up the reports and how the data is presented.

Capterra verified review by
Brent N., Director of Operations
Easy to create really beautiful graphs and reports which can help other team members to understand the most important takeaways. I especially like the automated report function, so I don't have to check on the same thing repeatedly.

Capterra verified review by
Orsolya S., Online Marketing Manager