







What is a LinkedIn analytics tool?
A LinkedIn analytics tool helps you collect, organize, and present your LinkedIn performance data - from company page metrics to paid campaign results - in one place.
Instead of manually logging into each client's LinkedIn account, exporting CSVs, and copying numbers into a slide deck, you get a single, structured view of how LinkedIn is actually performing.
For B2B agencies managing LinkedIn alongside other channels, this matters more than ever. Nearly 70% of LinkedIn users interact with brand content at least once per week. That kind of engagement potential is hard to take advantage of if your LinkedIn reporting is still a manual, end-of-month scramble.
A good LinkedIn analytics tool does most of the hard work:
- Connects directly to LinkedIn company pages and LinkedIn Ads without manual exports
- Standardizes LinkedIn page analytics and paid data in one unified view
- Tracks LinkedIn follower analytics and content performance across all your clients
- Visualizes results in a way that non-technical clients can actually follow
- Let's you brand and white-label reports with your logos, colors, and the KPIs that matter most
With Whatagraph IQ, you go further than standard LinkedIn reporting tools allow. Instead of building reports from scratch every month, your team can:
- Ask AI to generate a complete LinkedIn analytics report instantly, including charts, tabs, and layouts
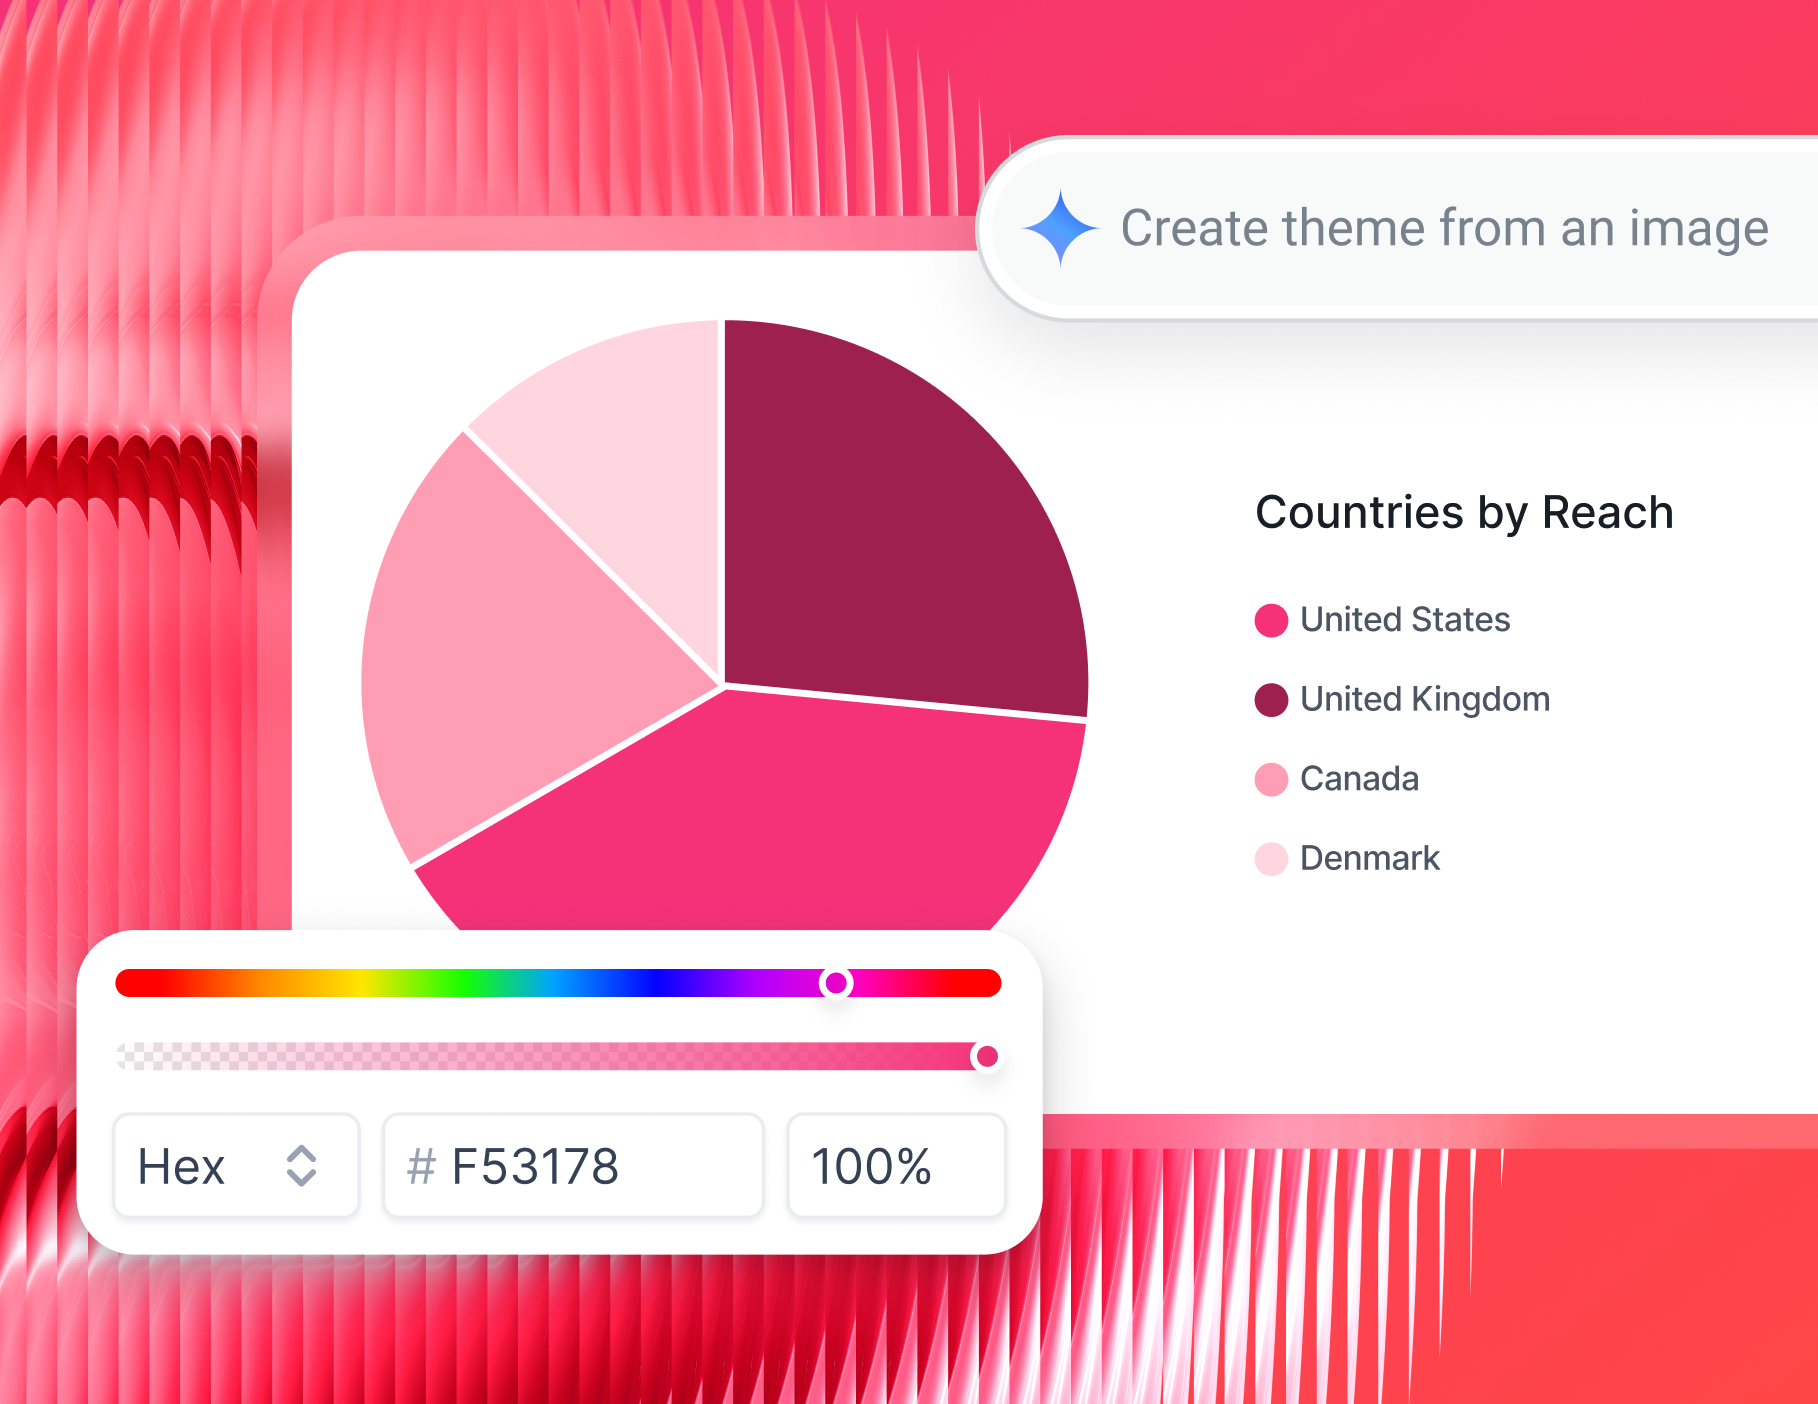
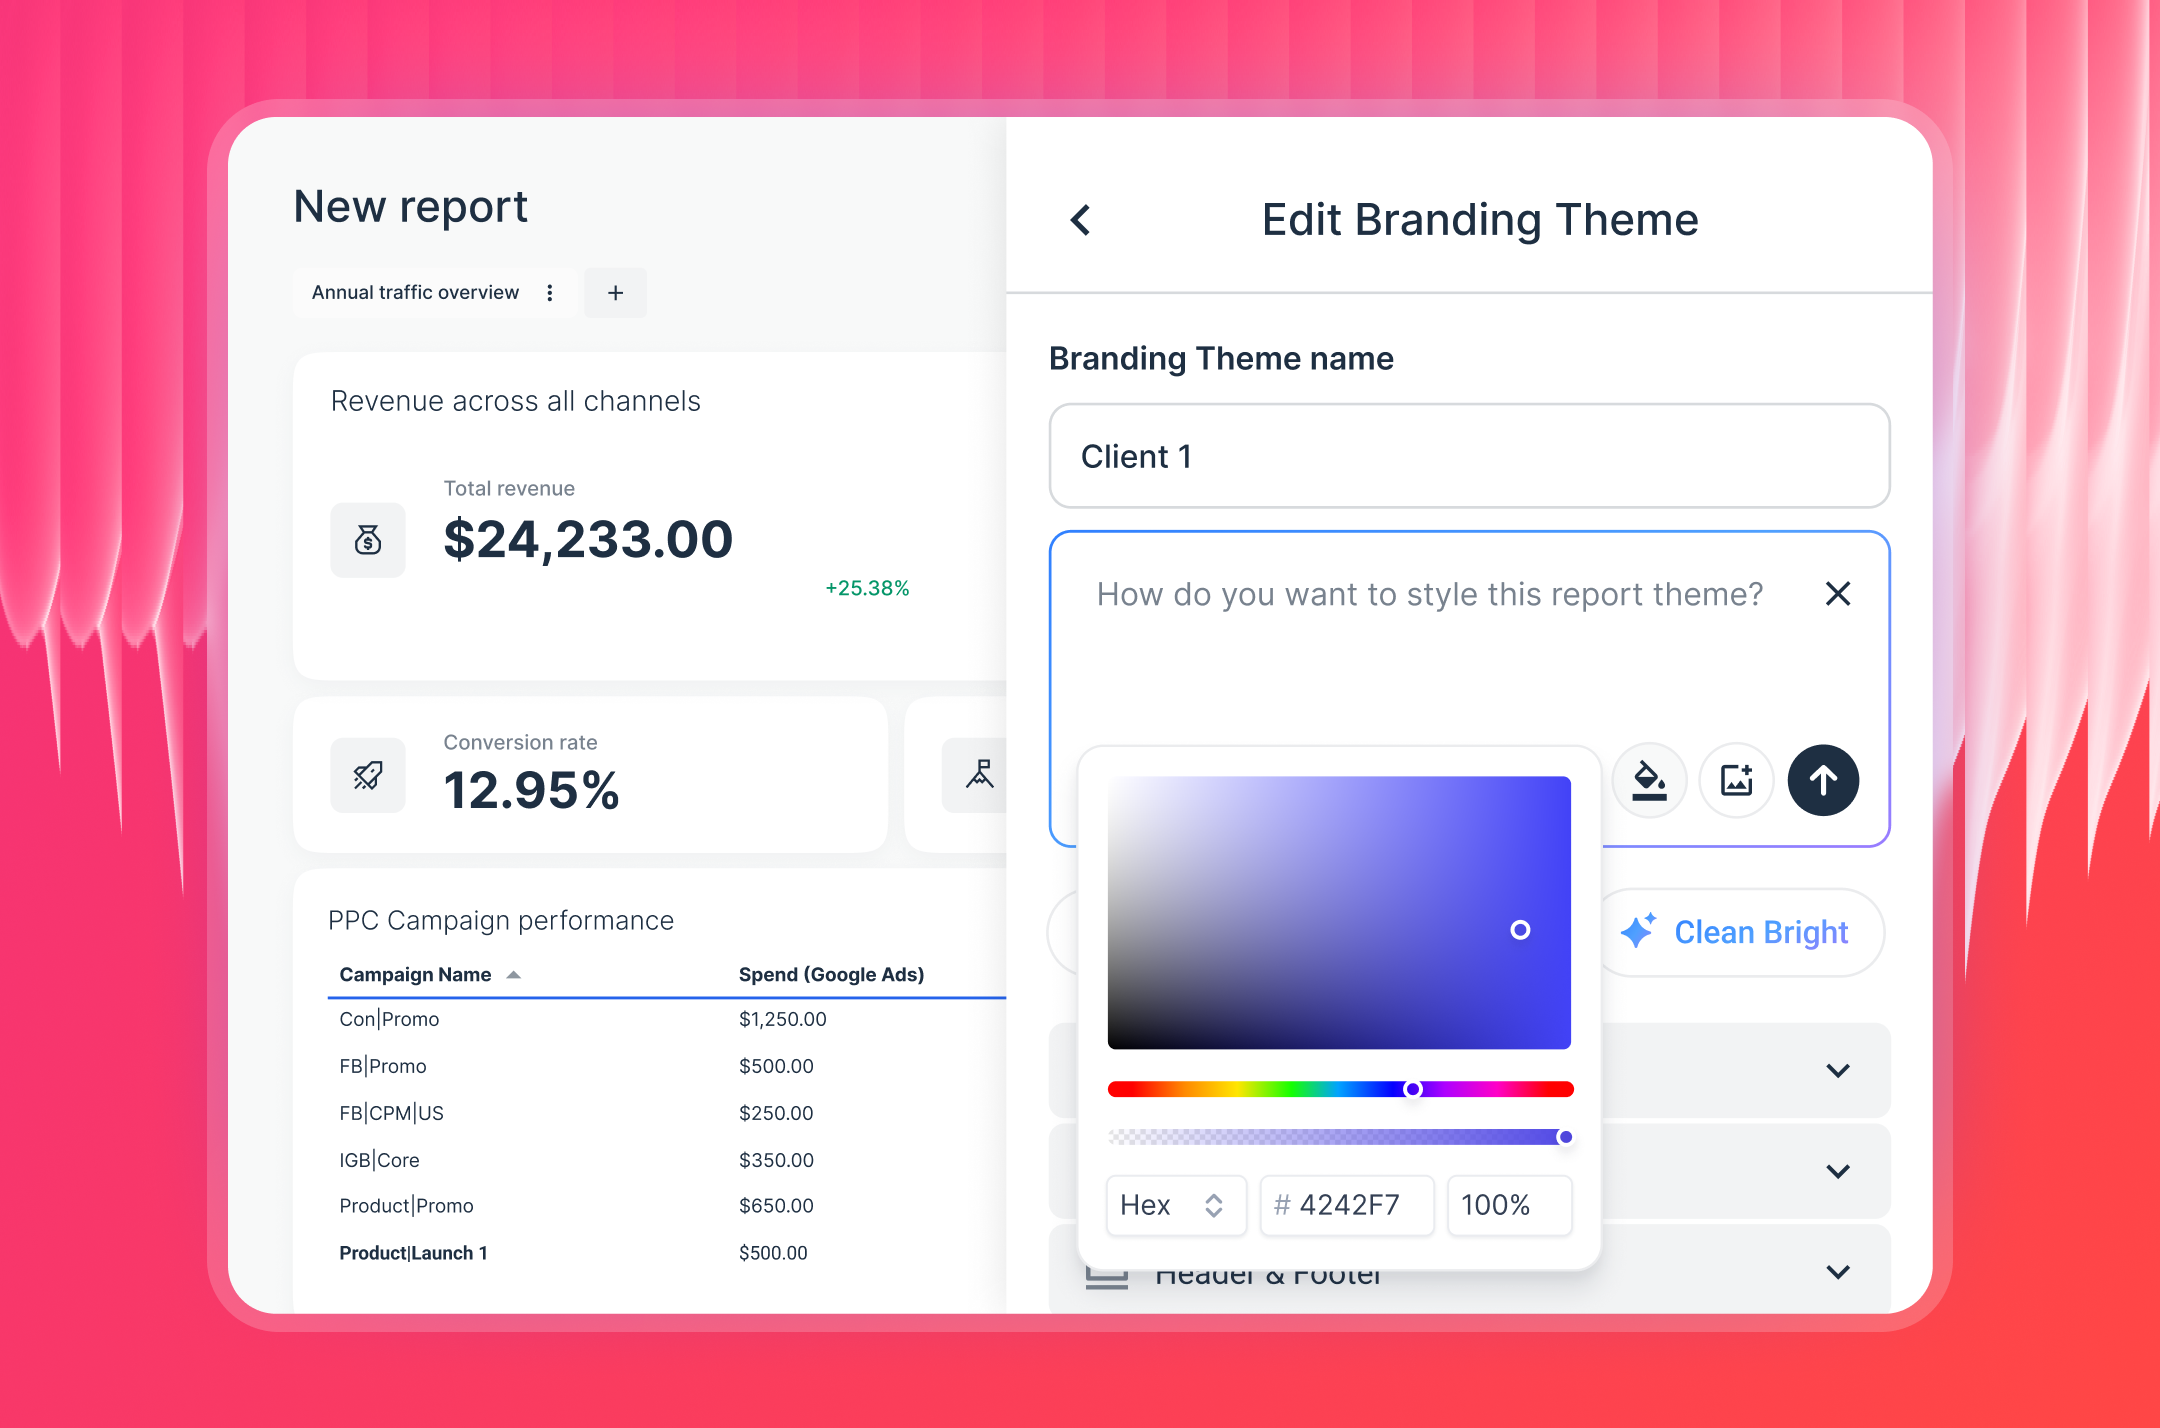
- Use IQ Themes to apply client branding automatically from a single image or prompt
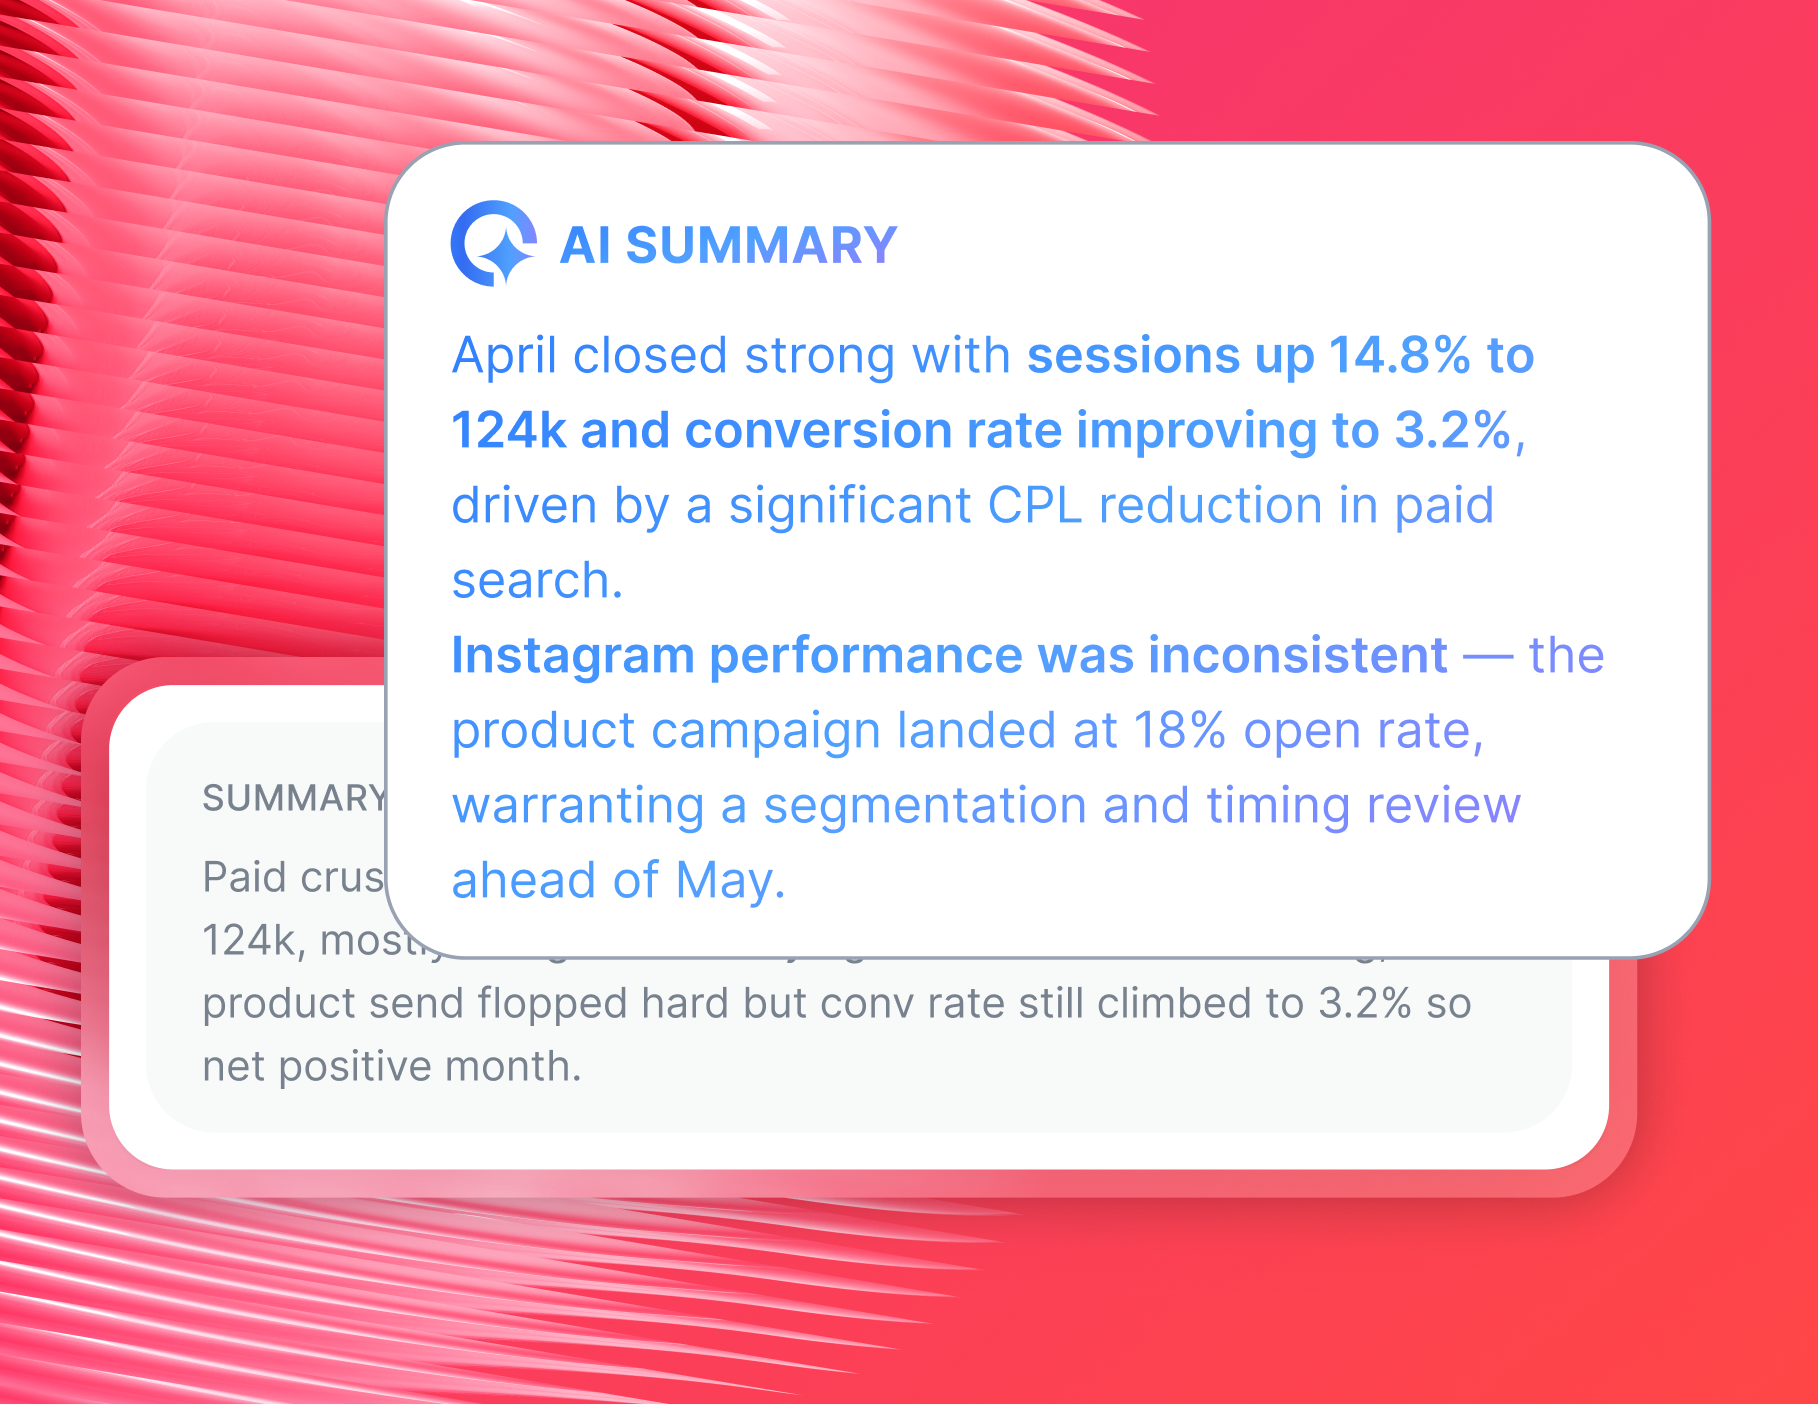
- Get AI-written performance summaries that explain what the data means - without the manual write-up
- Use IQ Chat to ask direct questions about LinkedIn performance and get plain-language answers in seconds
Whatagraph has also launched an MCP that lets you connect your data to Claude or ChatGPT and analyze your data there.
And the results speak for themselves. Peak Seven, a Florida-based advertising agency managing 25 active clients, saved 63 hours a month on reporting after switching to Whatagraph - time they now redirect toward strategy, client communication, and growth.
What is the best LinkedIn analytics tool for marketing teams?
There are plenty of LinkedIn analytics tools out there - but most weren't built with agencies or multi-client teams in mind.
If you need a tool that handles LinkedIn company page analytics, blends paid and organic data, and delivers client-ready reports without the manual grind, here are the five best options to consider:
1. Whatagraph - Best LinkedIn analytics reporting tool for agencies and teams
Whatagraph is built for marketing teams that need to report on LinkedIn at scale, without relying on developers or piecing together broken connectors.
Instead of switching between Campaign Manager and native page analytics, exporting CSVs, and manually assembling slides, you get one platform that connects, organizes, and presents all your LinkedIn data - alongside every other channel your clients run.
Here's what makes it the best LinkedIn analytics tool for agencies:
- 60+ native integrations covering LinkedIn, LinkedIn Ads, Google Analytics, Meta, TikTok, and more
- Cross-channel reporting that blends LinkedIn page analytics, paid campaigns, and other channels into one unified view
- Whatagraph IQ: a full suite of AI features to build, brand, and analyze reports in seconds
- Custom metrics and data blends: structure your LinkedIn data the way your clients think, no analyst needed
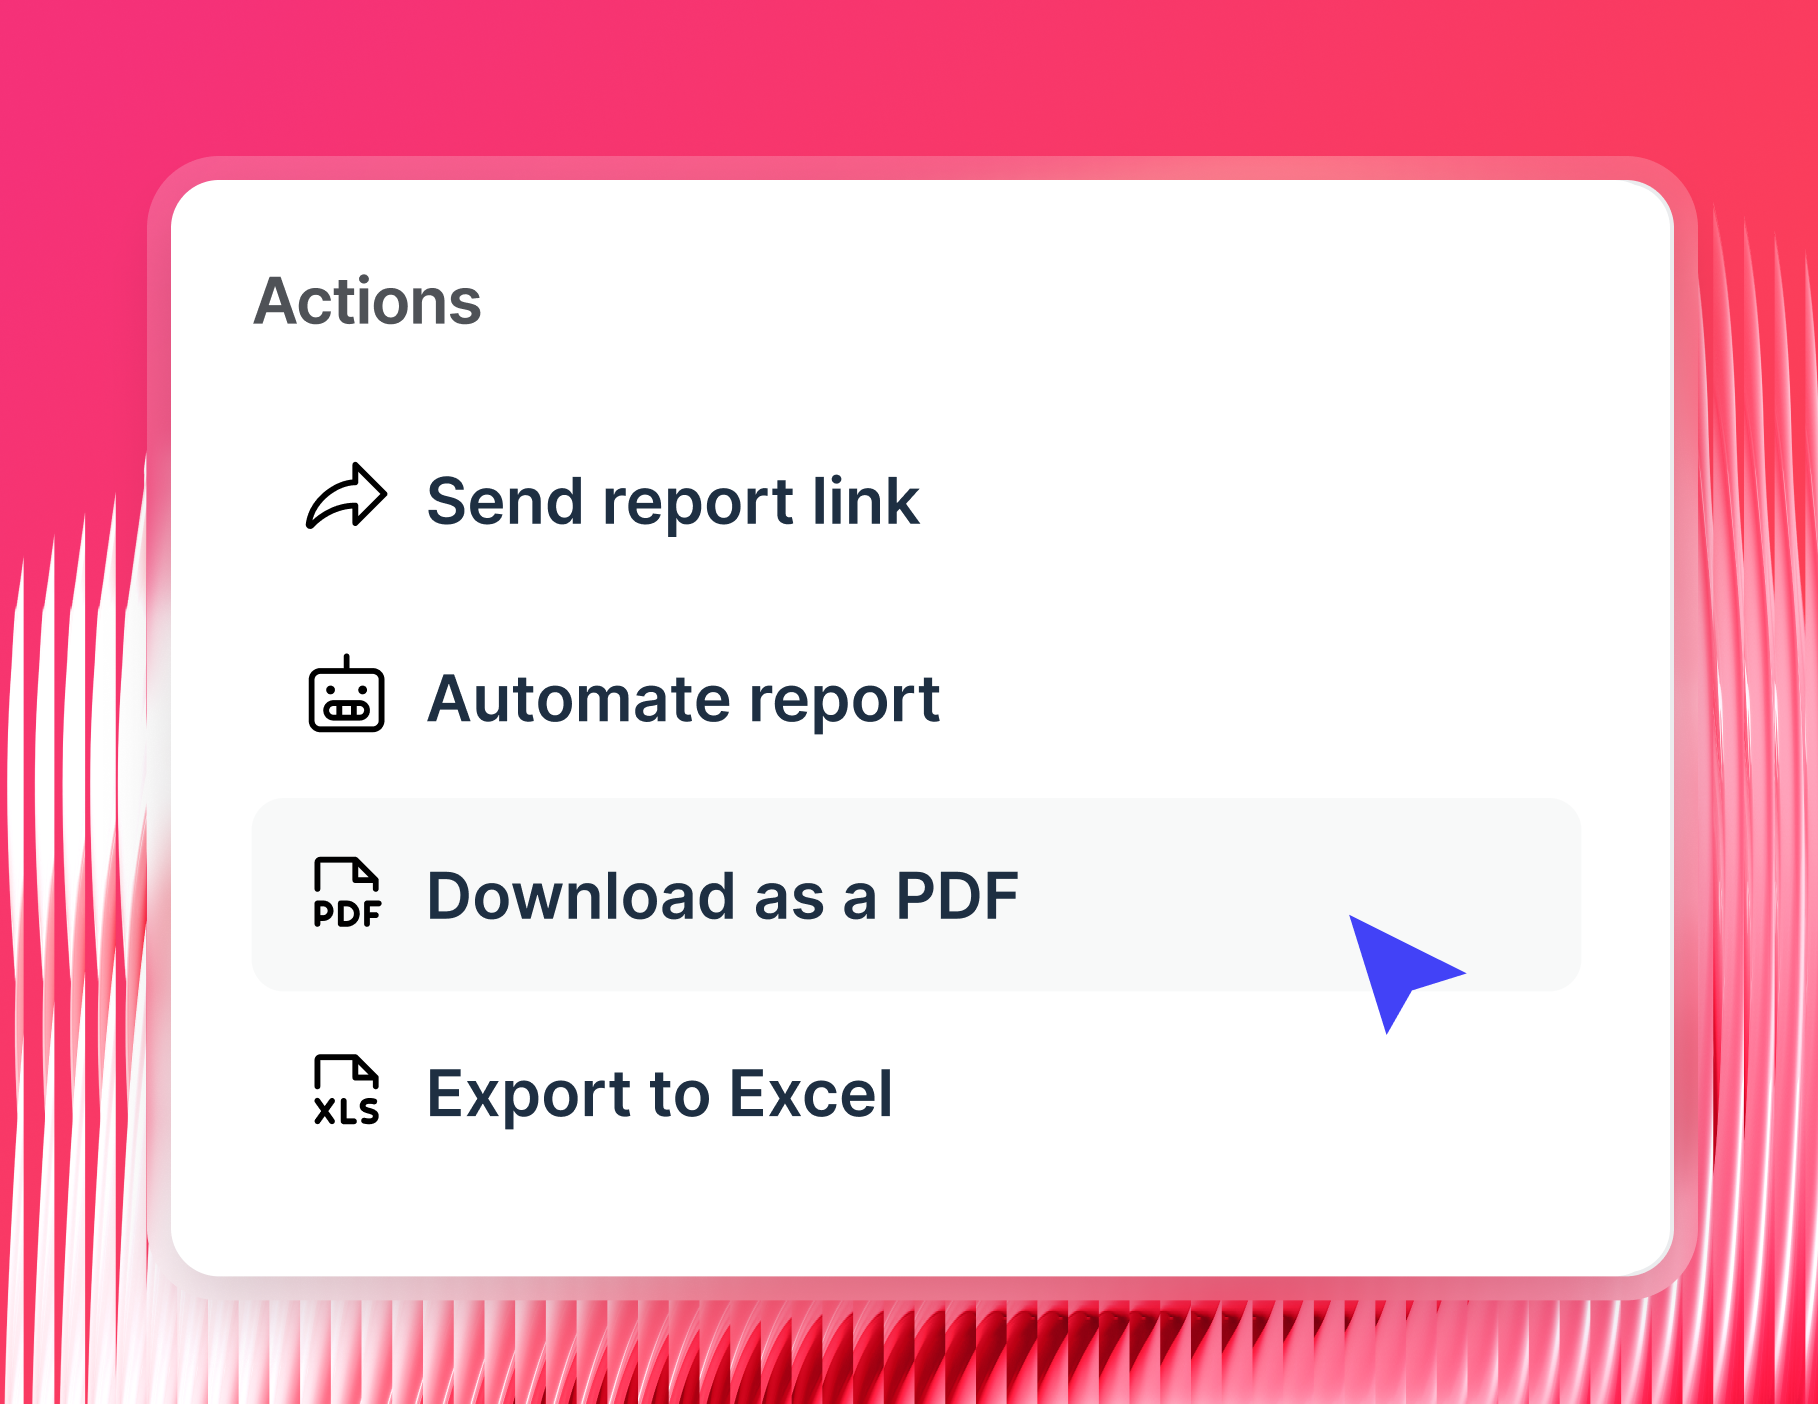
- Flexible delivery via live links, automated emails, PDF, CSV, BigQuery, or Looker Studio
With Whatagraph, you go from raw LinkedIn data to a polished, client-ready report in under 30 minutes - no dev work, no troubleshooting broken connections.
Lars Maat, Co-Founder at Maatwerk Online, saves over 100 hours a month on reporting since switching to Whatagraph. In his own words:
The hours we're saving with Whatagraph are just pure profit. We now have time to focus on more strategic things that actually help both our agency and our clients grow.
Start a free trial with Whatagraph today.
2. AgencyAnalytics - Best for SEO agencies that also need LinkedIn reporting
AgencyAnalytics is a client reporting tool designed for marketing agencies that want to automate reporting across multiple channels, including LinkedIn. It connects to 80+ data sources and comes with built-in SEO auditing tools.
With AgencyAnalytics, you can:
- Build white-labeled reports for clients with custom colors and logos
- Connect LinkedIn alongside other channels like Google Analytics and Google Ads
- Set up automated report delivery on a schedule
If you need to blend data across sources, AgencyAnalytics doesn't support that natively - so cross-channel LinkedIn reporting will require manual workarounds.
3. Cyfe - Best for boutique agencies on a tight budget
Cyfe is an all-in-one reporting platform that lets smaller agencies pull LinkedIn data alongside social, paid, and SEO sources into live dashboards. It has pre-built templates and supports PDF and CSV exports for client sharing.
With Cyfe, you can:
- Connect LinkedIn and other channels into a single real-time LinkedIn analytics dashboard
- Set email and SMS alerts when metrics hit specific thresholds
- Export reports in multiple formats, including PDF, CSV, and image files
With Cyfe, each widget requires its own source connection, which arguably makes the process of creating reports long, especially if you’re managing multiple clients.
4. Tableau - Best for large teams with a dedicated data engineer
Tableau is a business intelligence platform that gives data-savvy teams powerful visualization and analysis capabilities, including LinkedIn data when connected via custom pipelines.
With Tableau, you can:
- Build highly customized dashboards with advanced filtering and drill-down views
- Use AI-powered features to surface patterns and trends across large datasets
- Perform complex data blending and apply custom SQL queries
To build LinkedIn data flows with Tableau, Python programming skills are needed, which can arguably become a bottleneck for agencies.
5. Taplio - Best for personal LinkedIn creator analytics
Taplio is a LinkedIn-focused tool built primarily for individual creators and personal brand builders who want to grow their own LinkedIn presence.
With Taplio, you can:
- Track post performance and follower growth for a personal LinkedIn profile
- Get AI-generated content suggestions based on trending LinkedIn topics
- Monitor engagement on your own posts and schedule content in advance
That said, according to some reviews, some of the key features feel less accurate than advertised, and “pricing is not the most competitive.”
How do I automate LinkedIn analytics reports for clients?
Automating your LinkedIn analytics reporting isn't just about saving time - it's about building a process that's reliable enough to scale across every client you manage, without quality slipping.
Here's how to do it with Whatagraph:
1. Connect your LinkedIn accounts
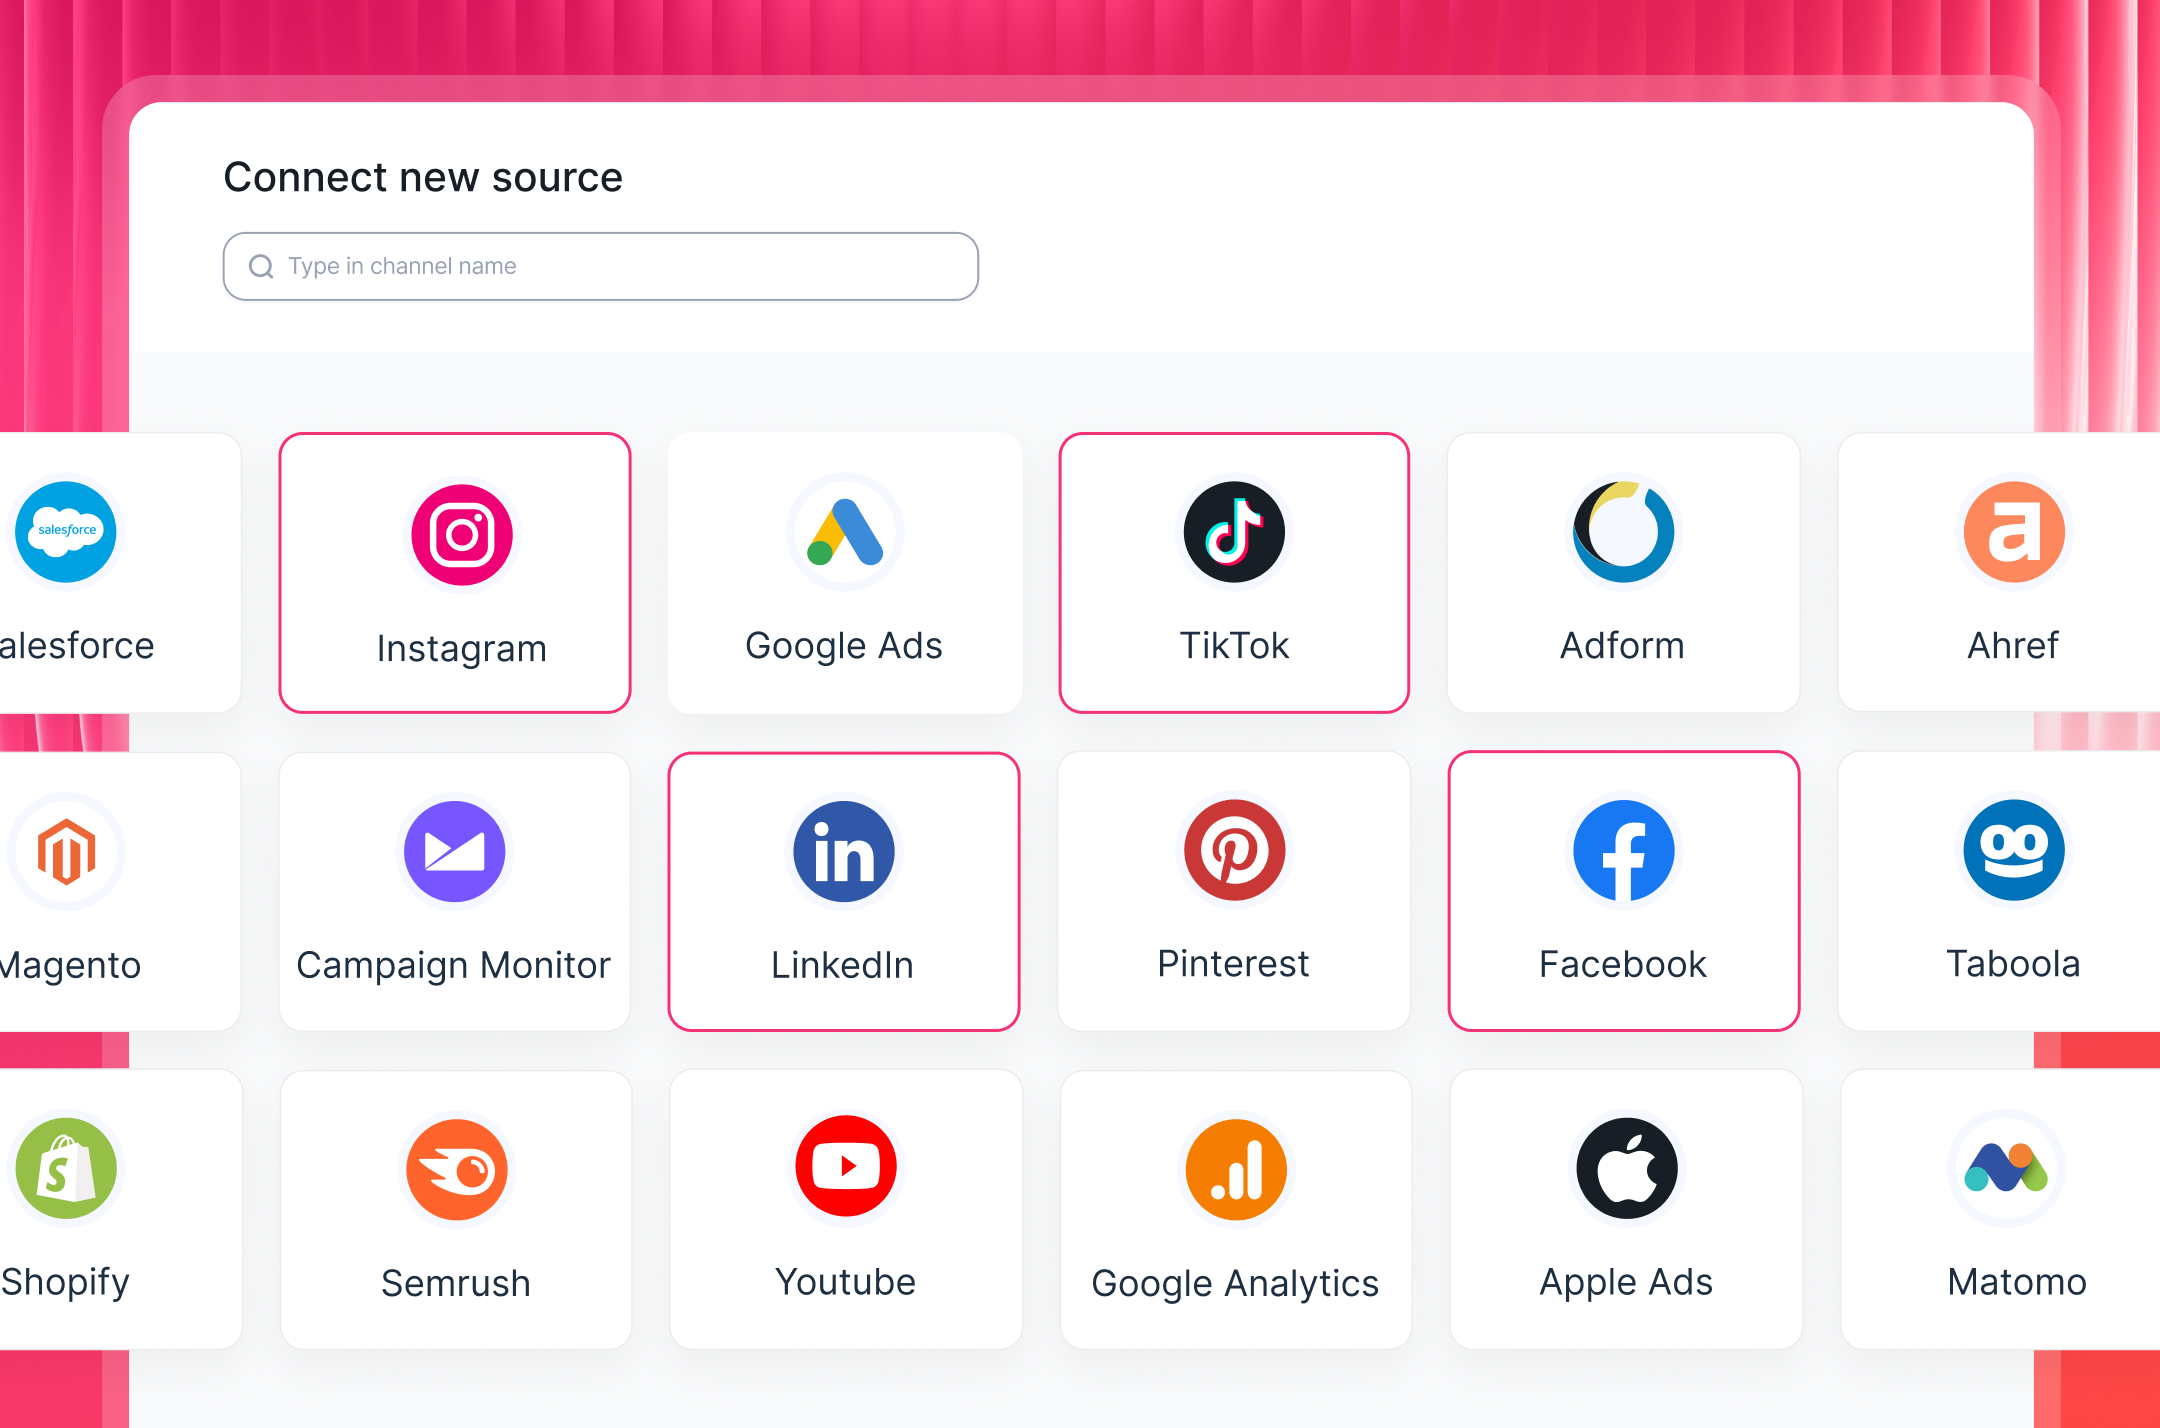
Start by connecting your clients' LinkedIn company pages and LinkedIn Ads accounts directly from your Whatagraph workspace.
Choose LinkedIn Ads (for paid ads) or LinkedIn (for organic performance) from the integrations menu. Authenticate with your login, and you're done.
No developers, no third-party connectors, no manual CSV exports.
You can also pull in data from other channels your clients run alongside LinkedIn - Google Analytics, Google Ads, Meta, TikTok, and more.
Whatagraph supports 60+ integrations in total, including:
- Social Media: LinkedIn, Instagram, Facebook, TikTok, YouTube
- Paid: LinkedIn Ads, Google Ads, Meta Ads, Pinterest Ads
- Analytics: GA4, Semrush, Ahrefs, Matomo
- Email: Mailchimp, ActiveCampaign, Constant Contact
- CRM: HubSpot & Salesforce
Whatagraph's integrations are fully managed and native - no third-party tools sitting in between your data and your reports.
The platform's uptime has also averaged 99.95% over the past six months, and if anything breaks, engineers are notified immediately.
2. Organize and clean your LinkedIn data
Once connected, standardize your data before it goes into reports.
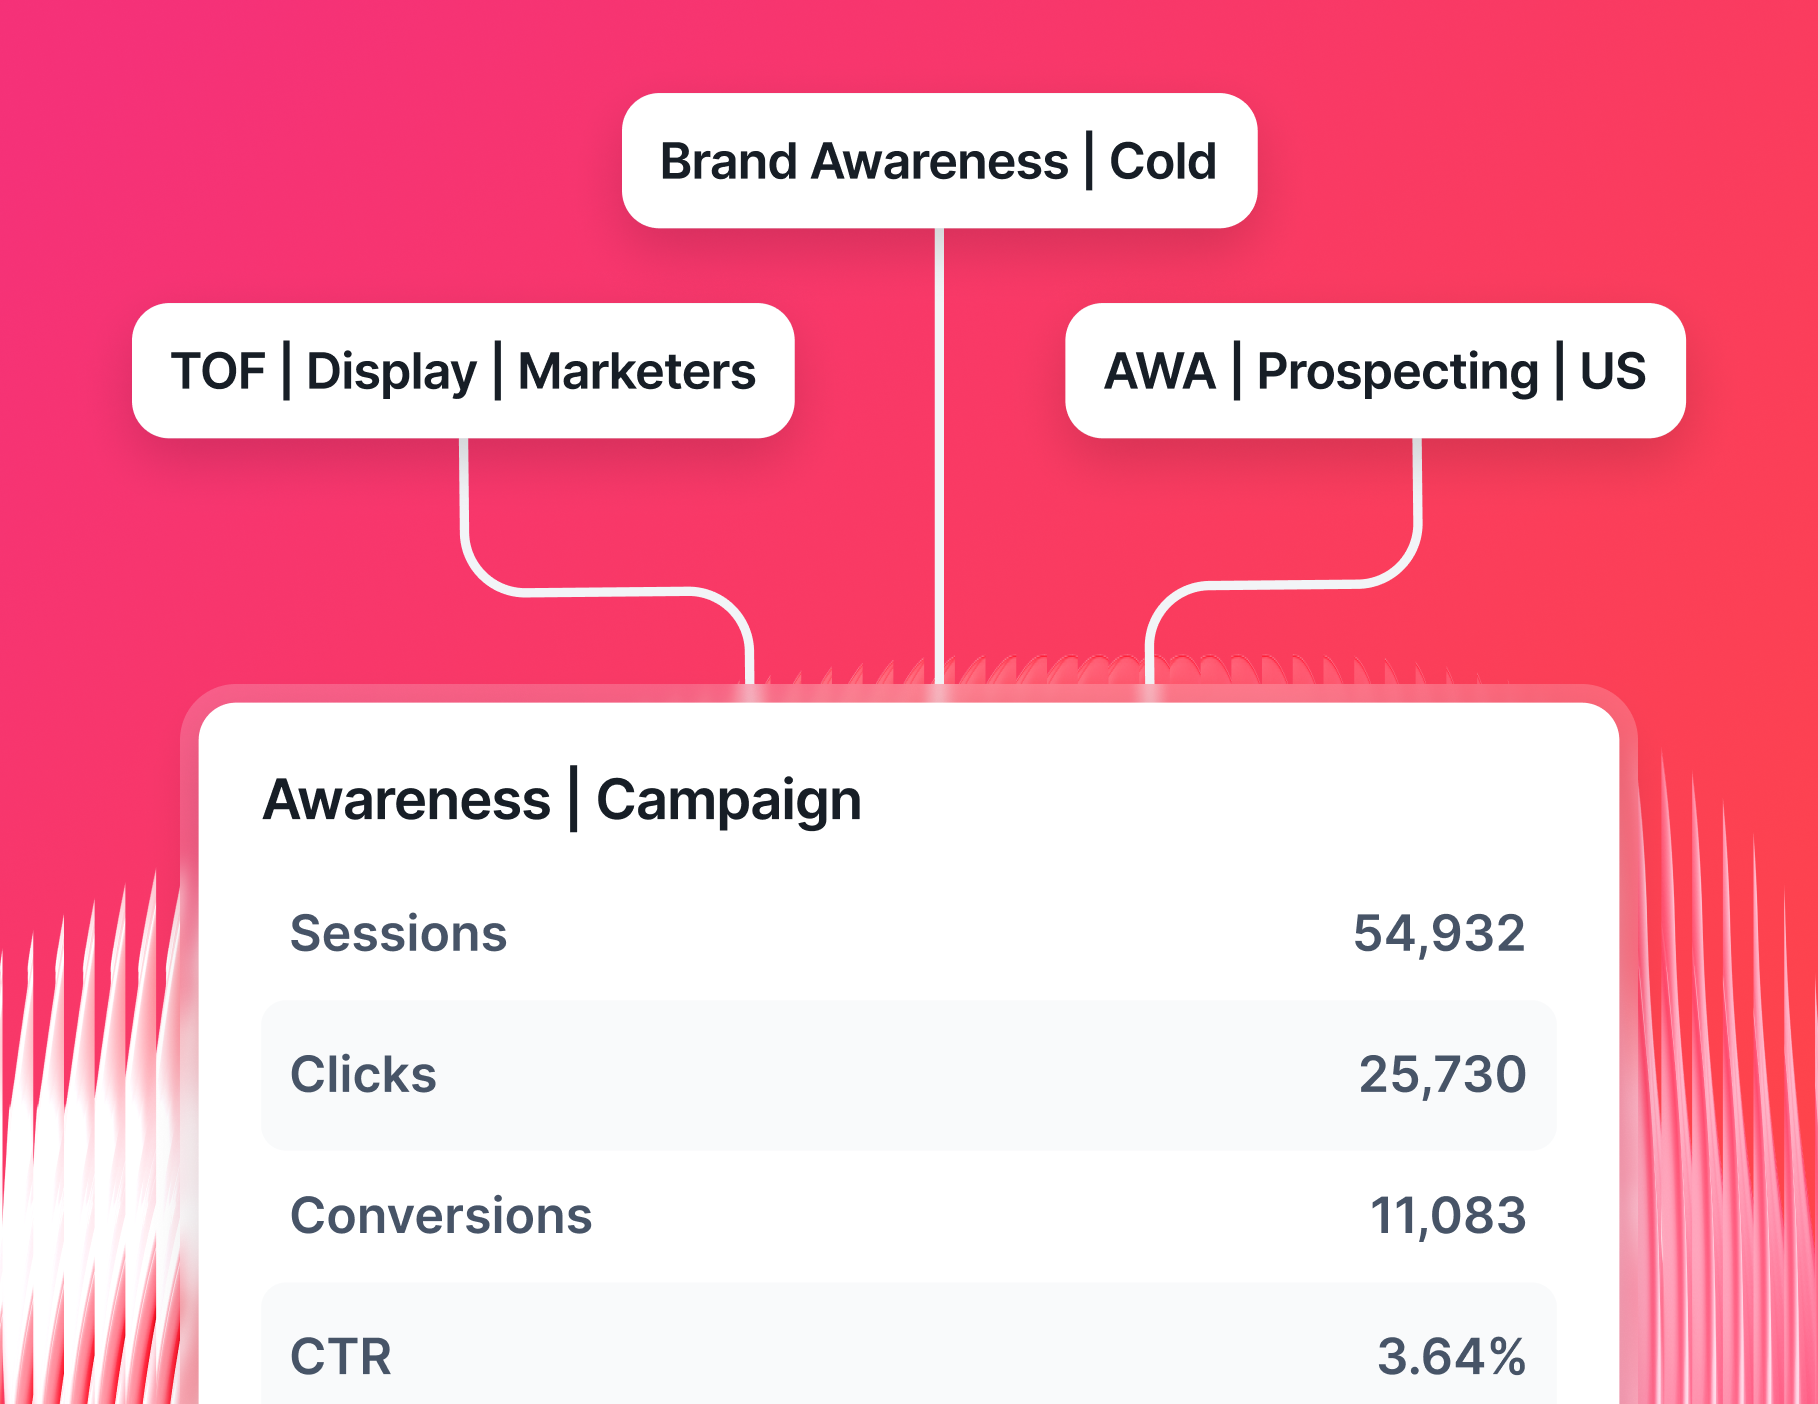
Align metric names across clients, group campaigns by type or objective, and blend LinkedIn data with other channels for a complete cross-channel view.
With Whatagraph, you can:
- Group LinkedIn company page analytics by campaign, date range, or audience segment
- Filter by device, placement, or custom dimensions
- Blend LinkedIn Ads spend with other paid channels into one unified metric
- Apply tags and folders to organize data by client, account manager, or region
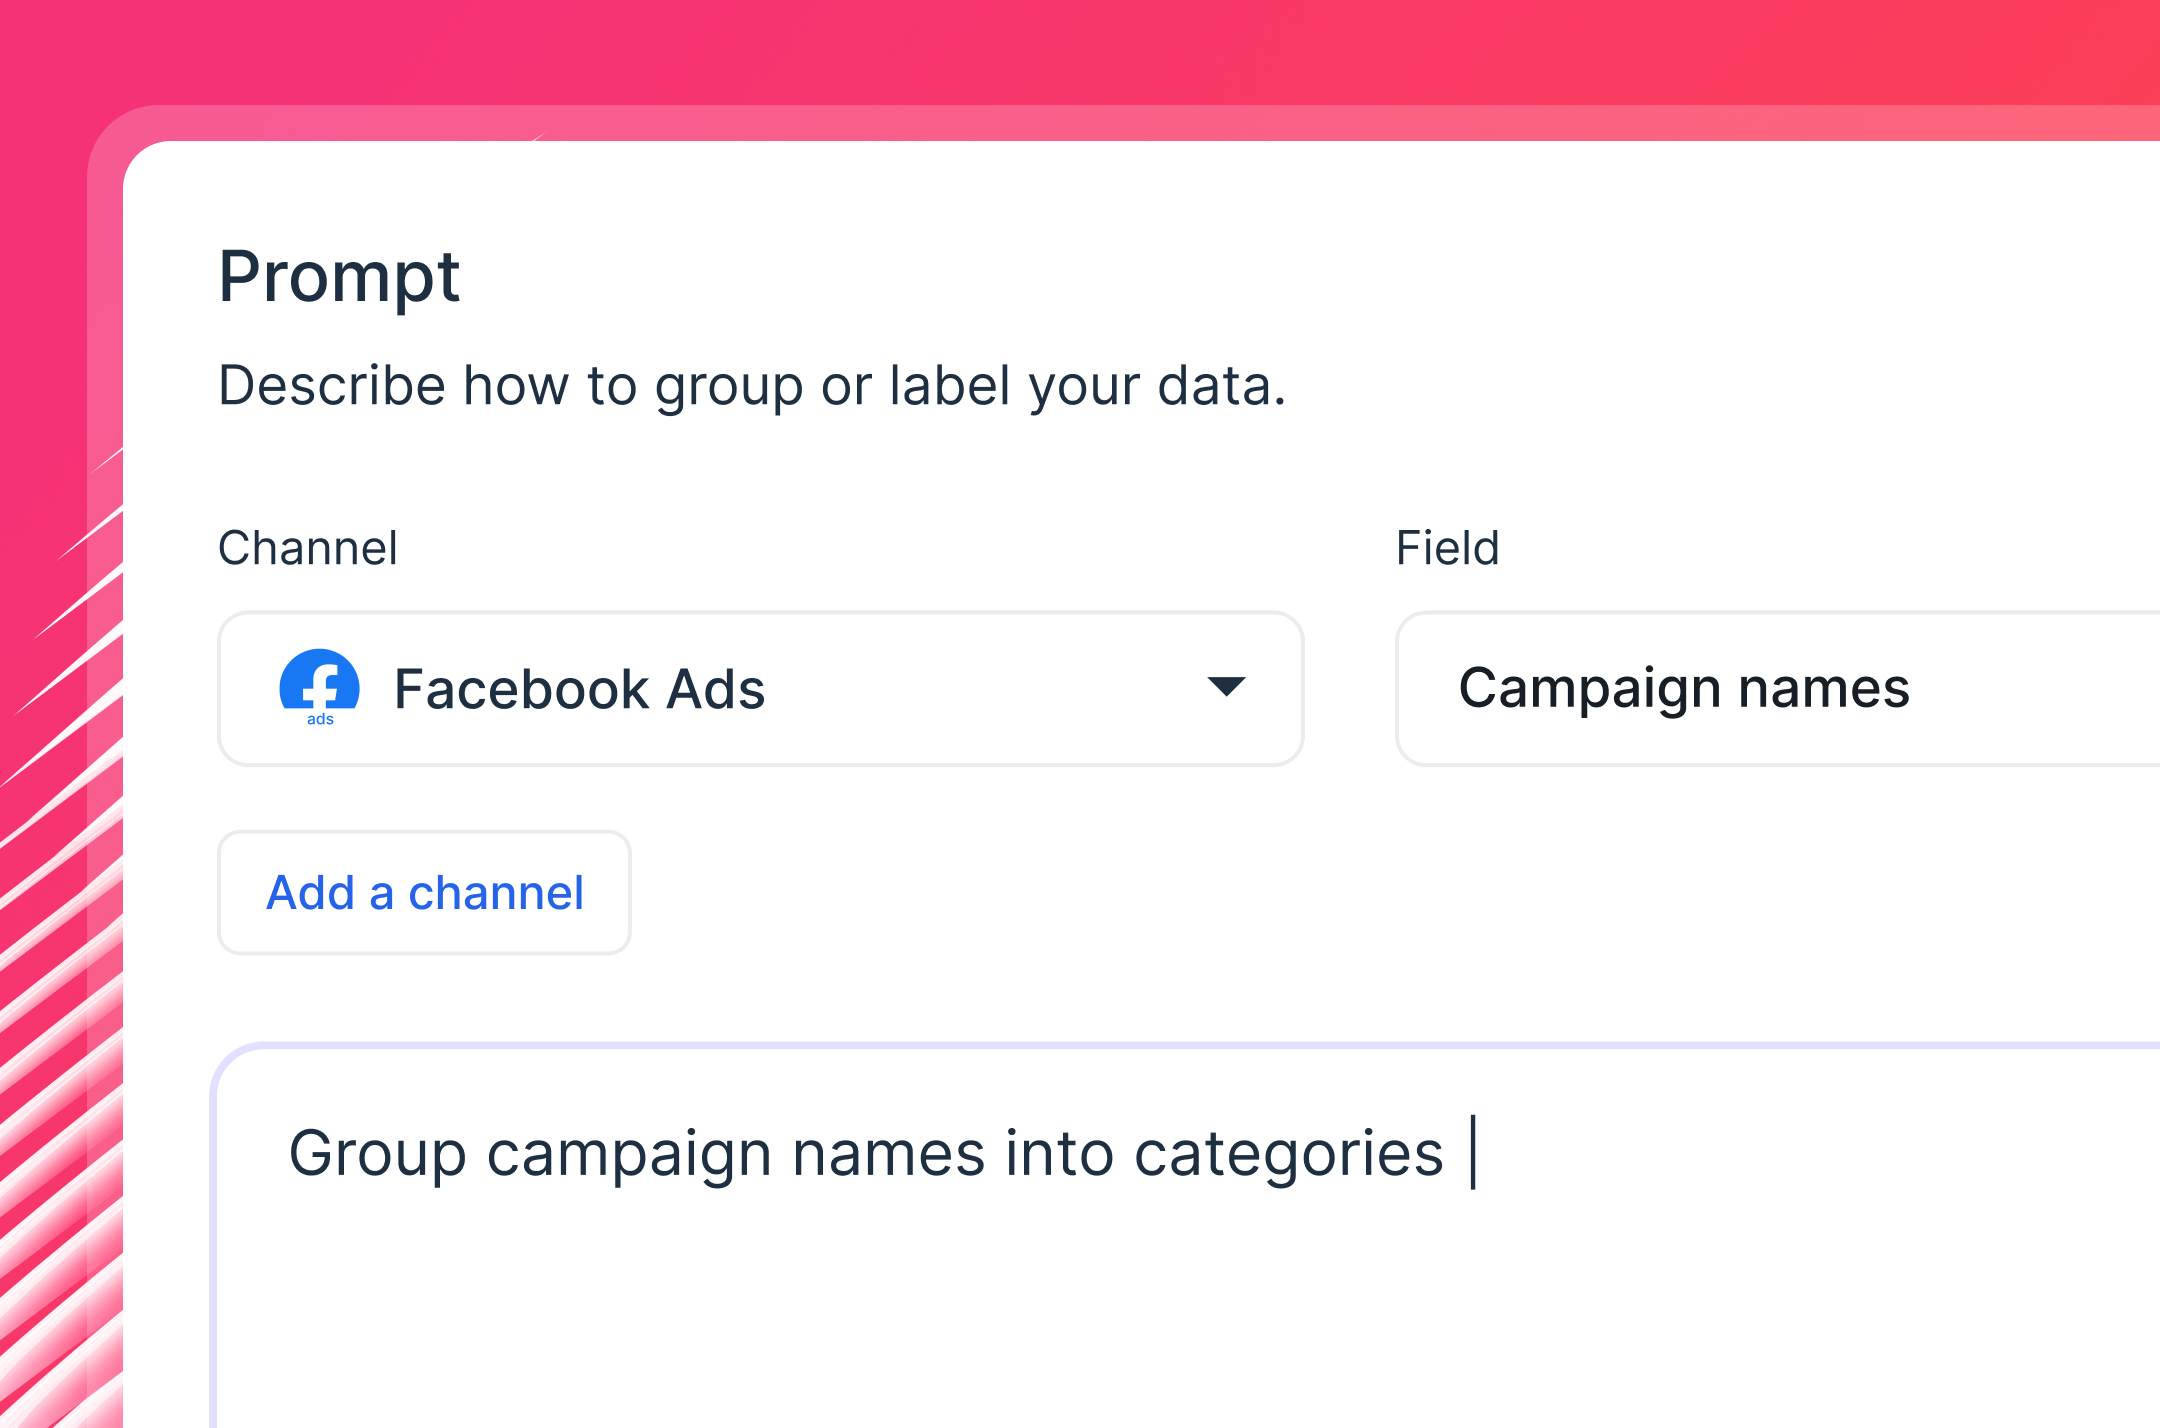
With IQ Dimensions, you don't need to build these manually.
Just describe what you need - like "group all LinkedIn campaigns by content type" - and AI creates the dimension for you, ready to reuse across every report.
3. Build your LinkedIn analytics report
Cleaning your data is only half the job. Knowing what to actually surface in your reports is the other half.
As Elizabeth Greene, Co-Founder of Junglr, puts it:
A dashboard with 27 million different metrics is often unhelpful or confusing. What we've focused on instead is identifying the few core KPIs that help us quickly spot when something is going wrong in an account - because we want to catch negative trends as early as possible.
With Whatagraph IQ, building a client-ready LinkedIn analytics report is no longer a drag-and-drop exercise.
Just describe what you need, and IQ assembles the full report - charts, KPIs, tabs, and layout included.
Want to customize it? Start from a blank canvas and build your own layout using pre-made widgets. With every widget, you can:
- Rename labels to match each client's internal terminology
- Apply custom formulas and blended metrics
- Set reporting periods, currencies, and visibility settings
- Match colors and fonts to client or agency branding
Pro tip: Save a report as a master template, then link it to every new client report you create. Edit the master once, and changes sync across all linked reports automatically - no repetitive manual editing.
4. Add AI-written performance summaries
As Alexander Mitrofanov, Senior Paid Media Specialist at Tag Worldwide, said:
- "If your report doesn't include 'what we're doing next', it's incomplete."
Clients don't want to decode a page of charts. They want a clear read on what happened and what it means for their business.
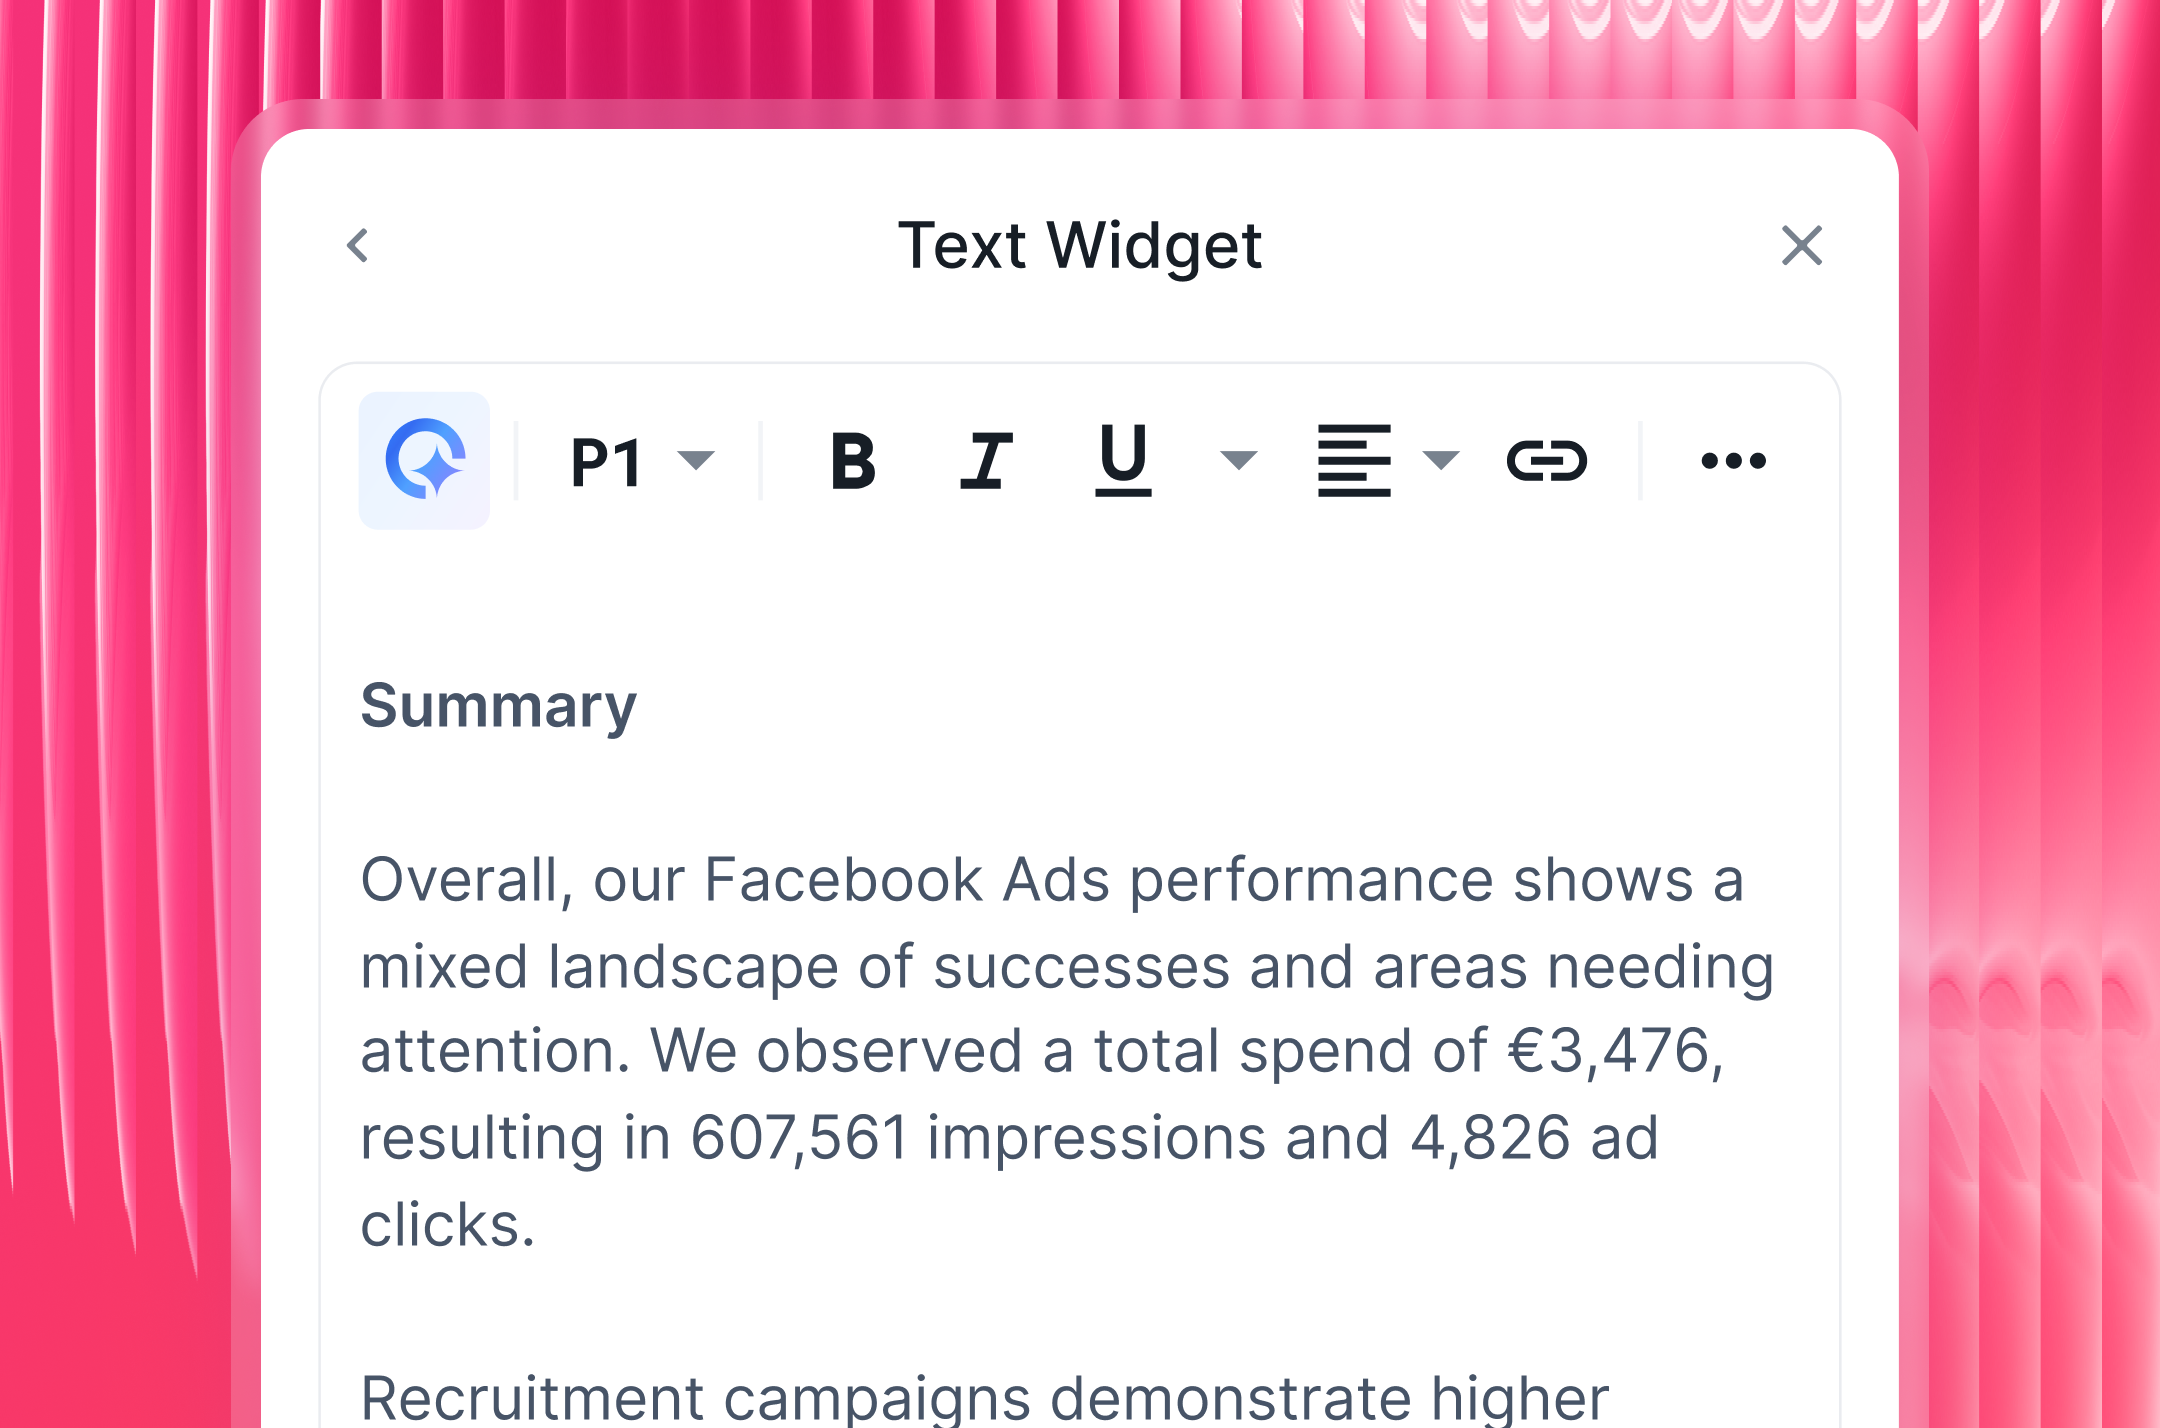
Instead of writing LinkedIn performance summaries from scratch for every client, use IQ Summaries:
- Generate a plain-language performance summary based on your actual report data - no hallucinations, no invented numbers
- Choose short or long format and tweak the tone, messaging, or any specific details to match your voice
- Add it directly to your report, ready to send to clients as-is
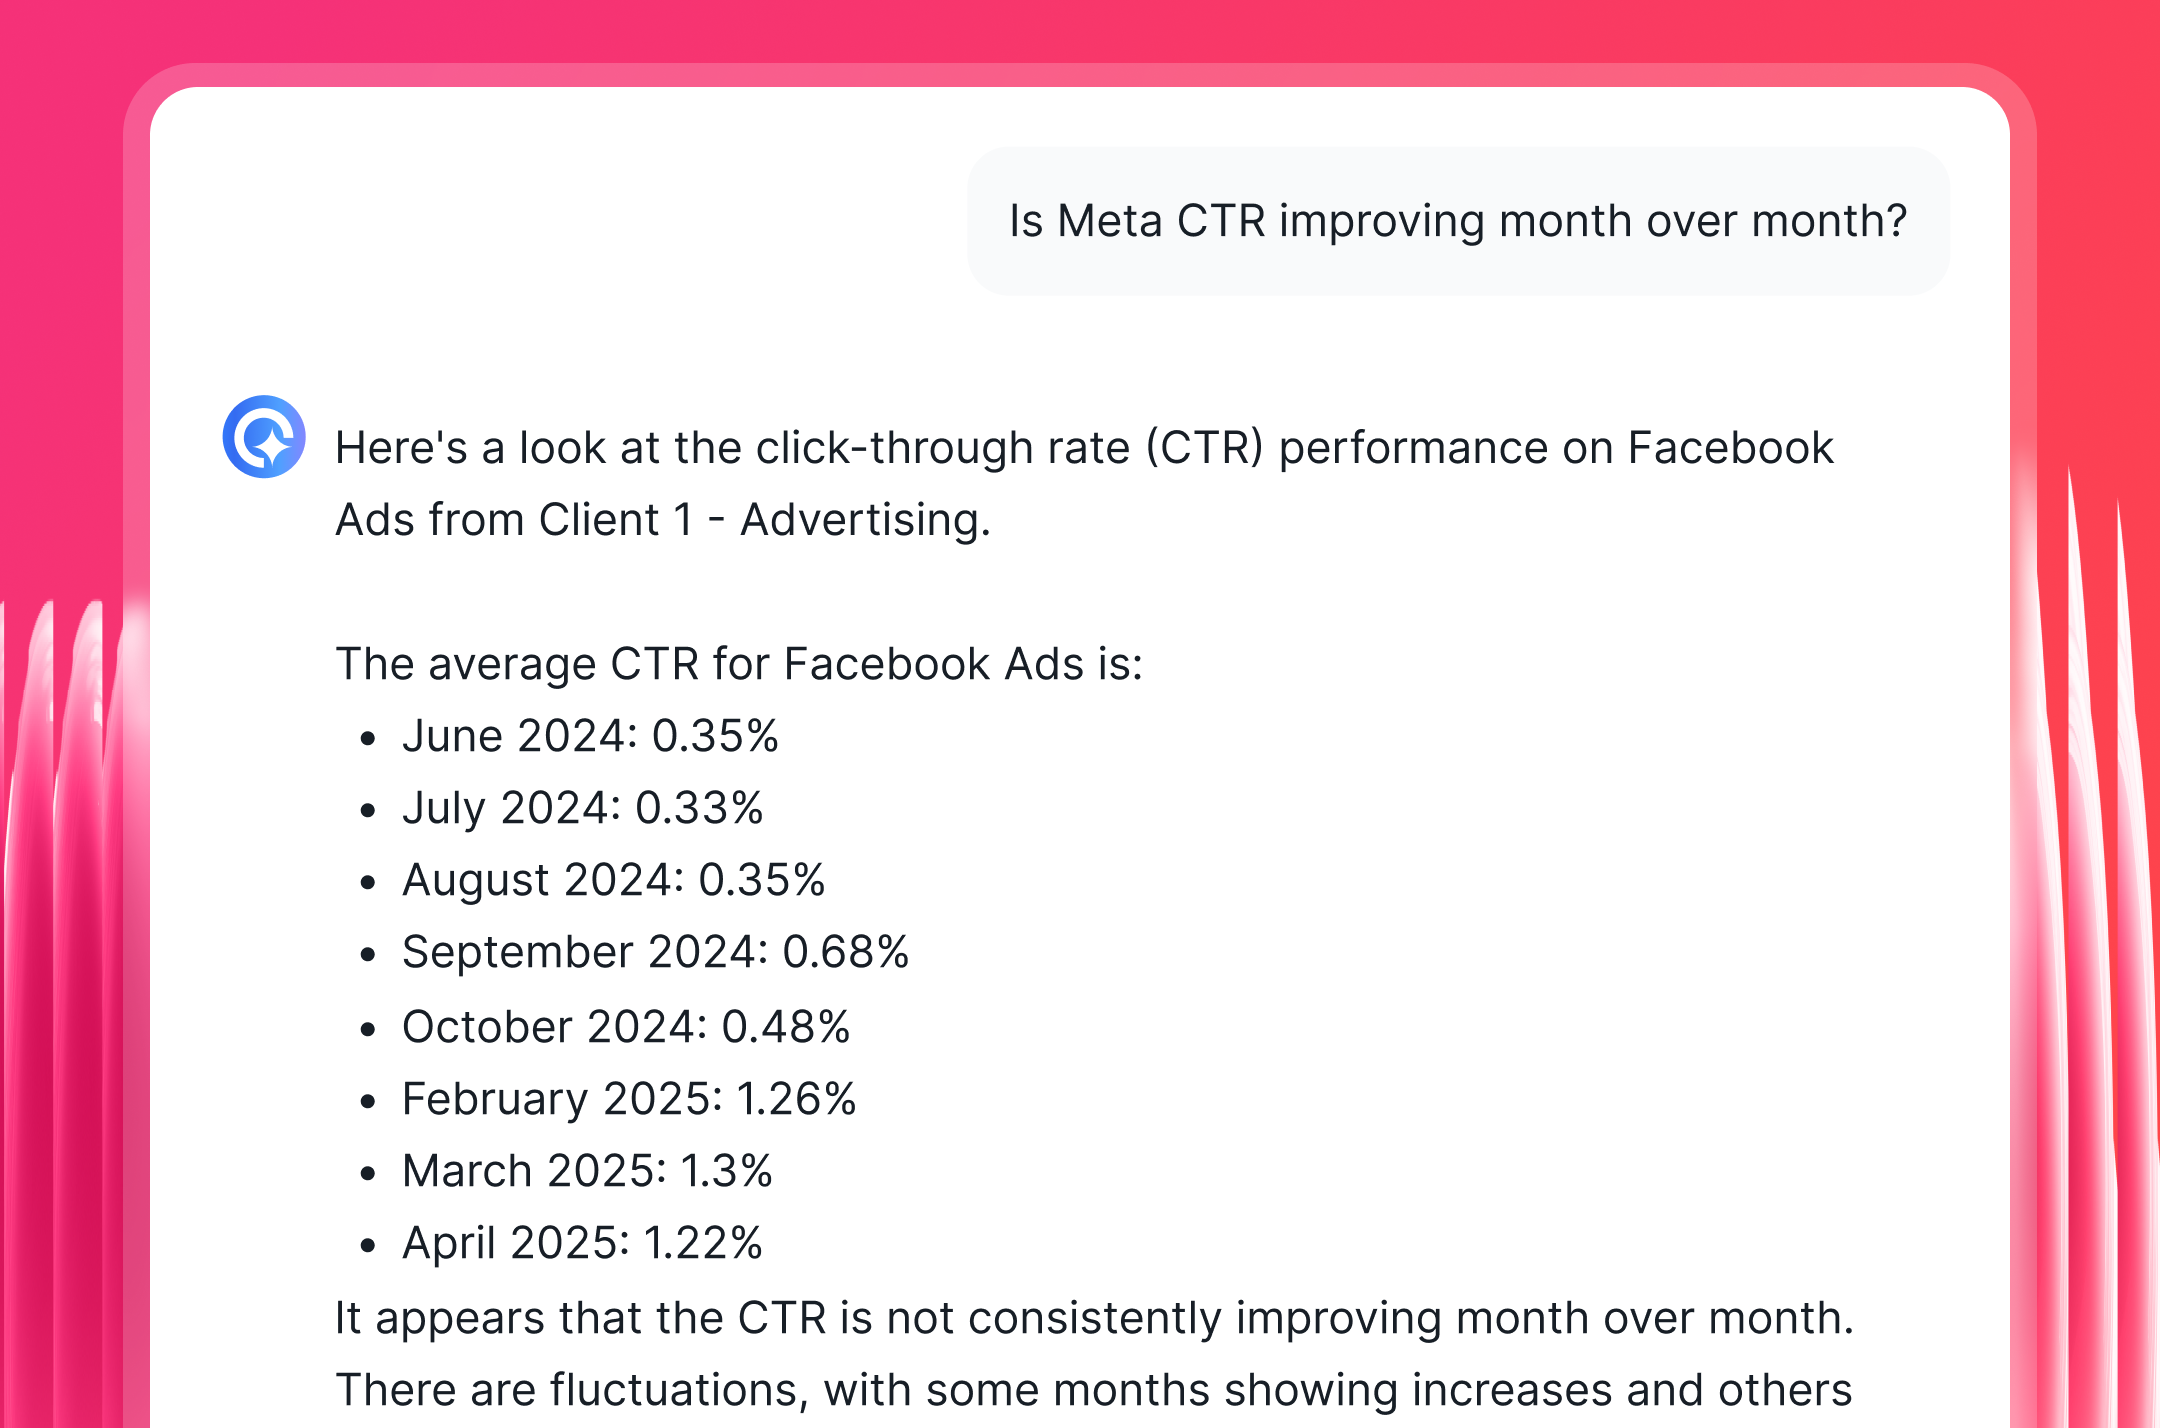
For your internal team members, IQ Chat lets anyone ask questions about LinkedIn performance - like “which posts drove the most engagement last month?"
Get a direct answer in seconds. No pivot tables, no manual cross-referencing.
5. Schedule automated delivery and share reports
Once your LinkedIn report is ready, it’s time to send it. Whatagraph gives you multiple ways to get reports to clients without manual effort:
- Automated emails: Schedule recurring delivery via email or Slack at a specific date, time, and cadence (weekly, monthly, or quarterly)
- Live links: Clients access their data in real time, no login needed, anytime they want to check in
- PDF or CSV exports: For archives, offline reviews, or internal stakeholders who prefer static files
- BigQuery or Looker Studio: Send raw LinkedIn data to a warehouse for long-term storage or further analysis
You can also enable IQ Chat on shared report links, so clients can ask their own questions about the data directly - without needing to chase your team for answers.
Which LinkedIn metrics matter most for a company page report?
A strong LinkedIn analytics report template gives your clients a complete picture of their company page performance.
1. Performance summary
Open your report with a high-level snapshot of LinkedIn performance for the reporting period.
Include:
- A goal widget tracking progress against key KPIs such as total followers, impressions, clicks, and engagement rate
- A LinkedIn Performance Goals table showing metrics like new followers, reactions, comments, shares, clicks, and total shares for the period
- A LinkedIn Performance Summary panel covering total impressions, new followers, clicks, total comments, and total shares at a glance
- Text widgets for AI-written summaries, recommendations, and next steps
With Whatagraph IQ, you don't need to write these summaries by hand. Ask IQ to generate a plain-language performance overview based on the actual data in your report - in 18 different languages if needed.
You could prompt it with something like "Summarize follower growth trends and recommend content optimizations for next month."
IQ pulls directly from your LinkedIn data to generate insights, so there are no hallucinations or invented numbers. You can edit the text to match your tone, and because everything stays inside Whatagraph, there's no risk of sharing client data with third-party tools.
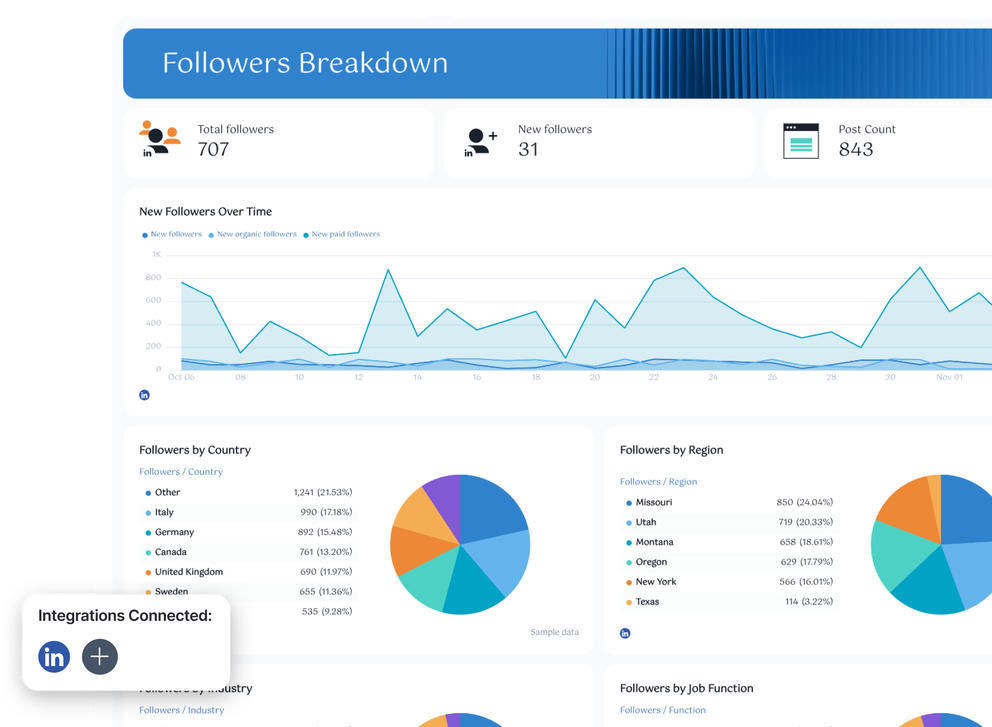
2. Followers breakdown
This section covers your LinkedIn follower analytics in detail - showing not just how many followers a page has, but who they are and where they're coming from.
Include:
- Total followers, new followers, and total lost followers as single-value scorecards
- A "New Followers Over Time" trend chart to track target audience growth momentum
- Followers by country and followers by region, displayed as tables and pie charts
- Followers by industry and followers by job function, giving a clear picture of the professional profile of the audience
The job function and industry breakdowns are particularly valuable for B2B clients.
They show whether the content is reaching the right decision-makers - not just generating follower volume.
3. Impressions & Clicks breakdown
This section covers LinkedIn post analytics and page visibility - how often content is being seen and whether it's driving action.
Include:
- Total unique impressions, total clicks, and total all-page profile views as top-line scorecards
- Impressions over time and impressions vs. clicks over time as trend charts, so clients can spot content performance patterns
- Views over time broken down by page section (overview, careers, about, jobs, people, insights)
- Top industry by page views table, showing which visitor segments are engaging most with the page
- Top job function by page views table, connecting visibility data back to the target demographic
This section helps clients understand not just reach, but relevance - are the right people finding and engaging with the page?
4. Engagement breakdown
Round out the LinkedIn analytics report with a detailed view of how the audience is interacting with content.
Include:
- Total engagement and engagement rate as top-line scorecards
- Total likes, comments, and shares displayed individually
- Social engagement over time as a trend chart
- Total reactions broken down by type
- Reactions over time as a trend chart to track engagement
Finish this section with a top-performing LinkedIn posts carousel showing thumbnails alongside key metrics like impressions, clicks, reactions, comments, shares, and engagement rate per post
The post-level carousel is one of the most valuable additions to any LinkedIn company page report.
As Maryna Barysheva, CEO of LKI Consulting, puts it:
Creative performance is often the biggest driver of results, but most reports focus heavily on campaign-level metrics instead of analyzing which messaging or creatives are actually working.