Meet Whatagraph 3.0It’s about time
It’s about time
your reporting tool
got an upgrade
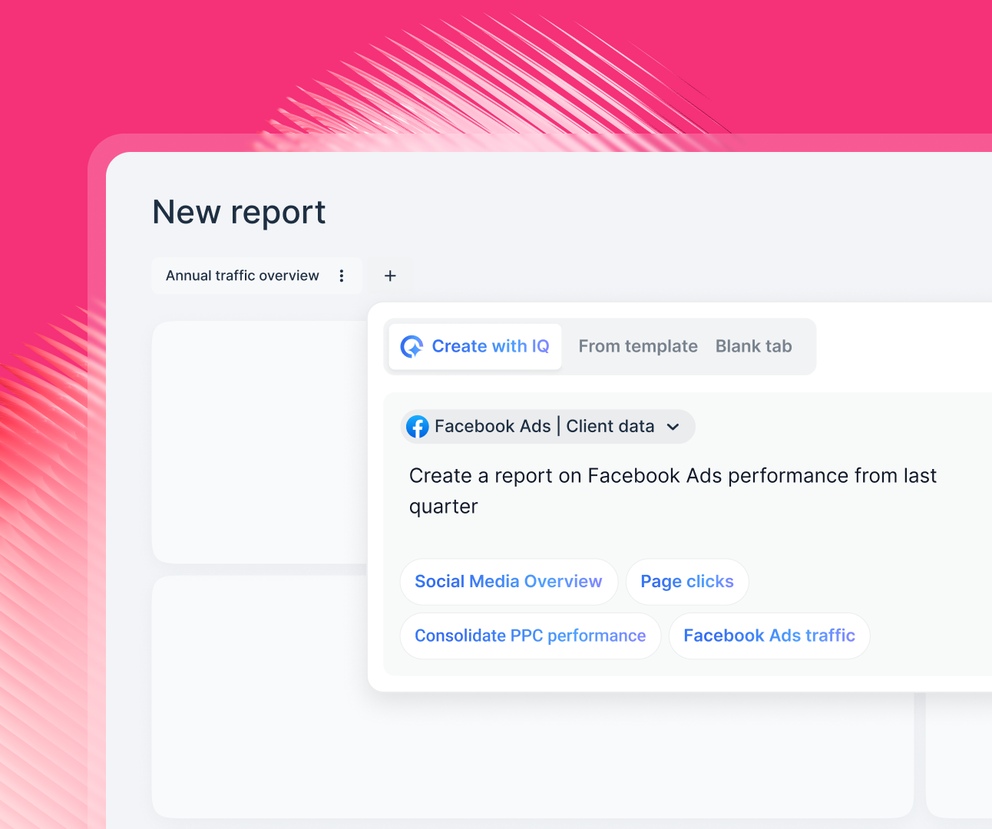
Build, style, and analyze marketing reports in seconds
from simple AI prompts. Sign up and try it free.
from simple AI prompts. Sign up and try it free.
Reporting shouldn't slow
your team down
Wasting time on complex repetitive workflows
Juggling too many disconnected tools just to get answers
Dealing with data cleanup, workarounds, and errors
Not your average reporting tool.
It’s a new era of instant intelligence.
We've come a long way to get here.
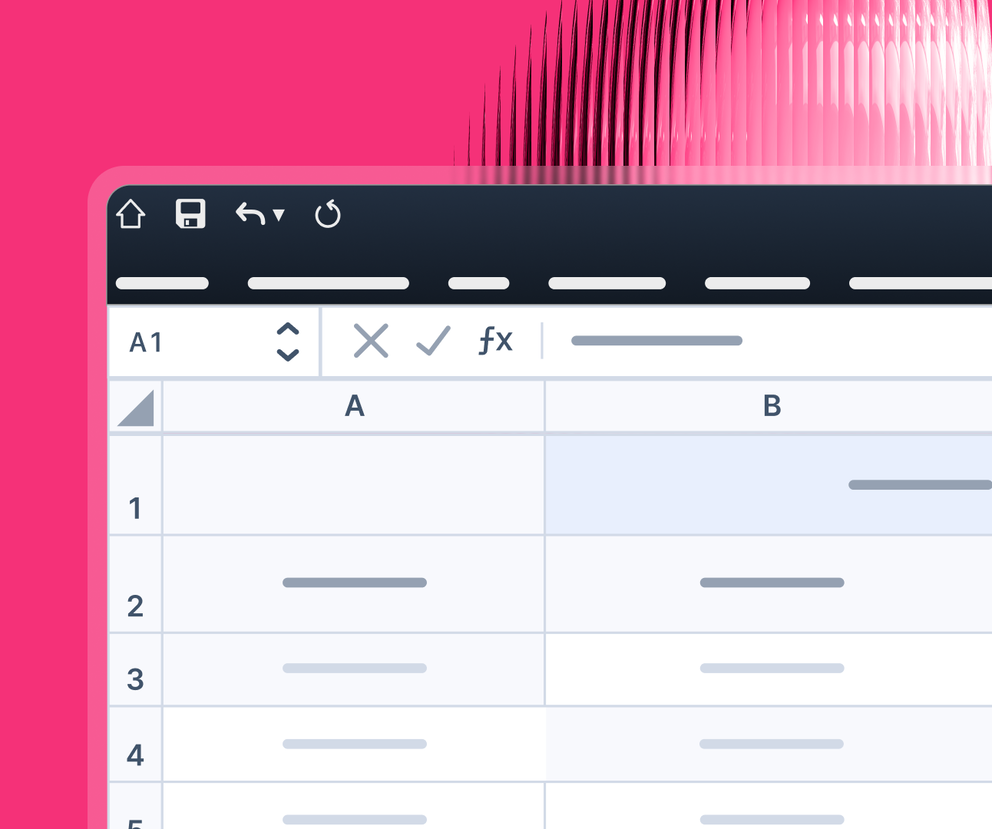
2010: The Excel Era
Manual data collection and spreadsheet chaos
• Manual data pulls that break every other day.
• Hours wasted wrangling CSVs.
• “Reporting Tuesdays” full of errors and last-minute fixes.
• Hours wasted wrangling CSVs.
• “Reporting Tuesdays” full of errors and last-minute fixes.
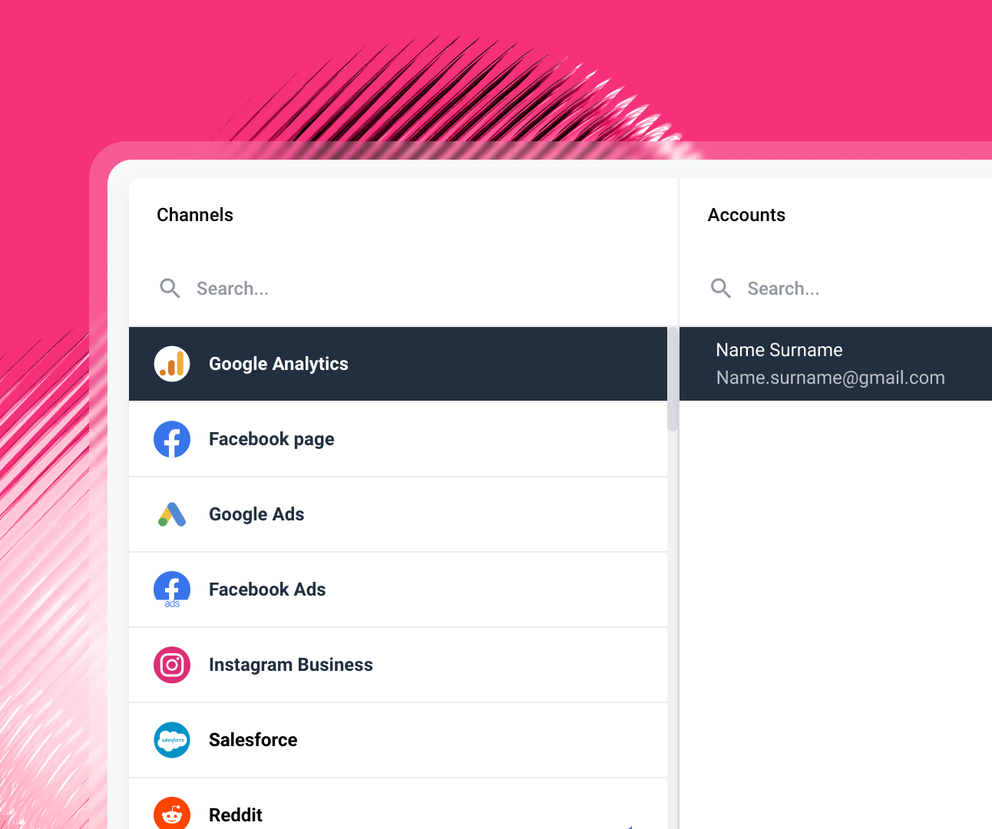
2015: The Connector Era
ETL tools bring scale, but not simplicity
• ETL (Extract, Transform, Load) tools still need manual setup and maintenance.
• Marketers have to learn technical schemas and tagging rules.
• Business Intelligence dashboards? Still require analysis and interpretation.
• Marketers have to learn technical schemas and tagging rules.
• Business Intelligence dashboards? Still require analysis and interpretation.
2019: The Drag & Drop Era
Self-serve BI for marketers – but still too technical
• Drag-and-drop? Sure. Until the report gets complicated.
• Then it’s back to the analysts.
• And back to explaining metrics instead of executing campaigns.
• Then it’s back to the analysts.
• And back to explaining metrics instead of executing campaigns.
Today: The Instant Intelligence EraPrompt, don’t build.
Prompt, don’t build.
Ask, don’t query.
• Say goodbye to manual dashboards and messy data.
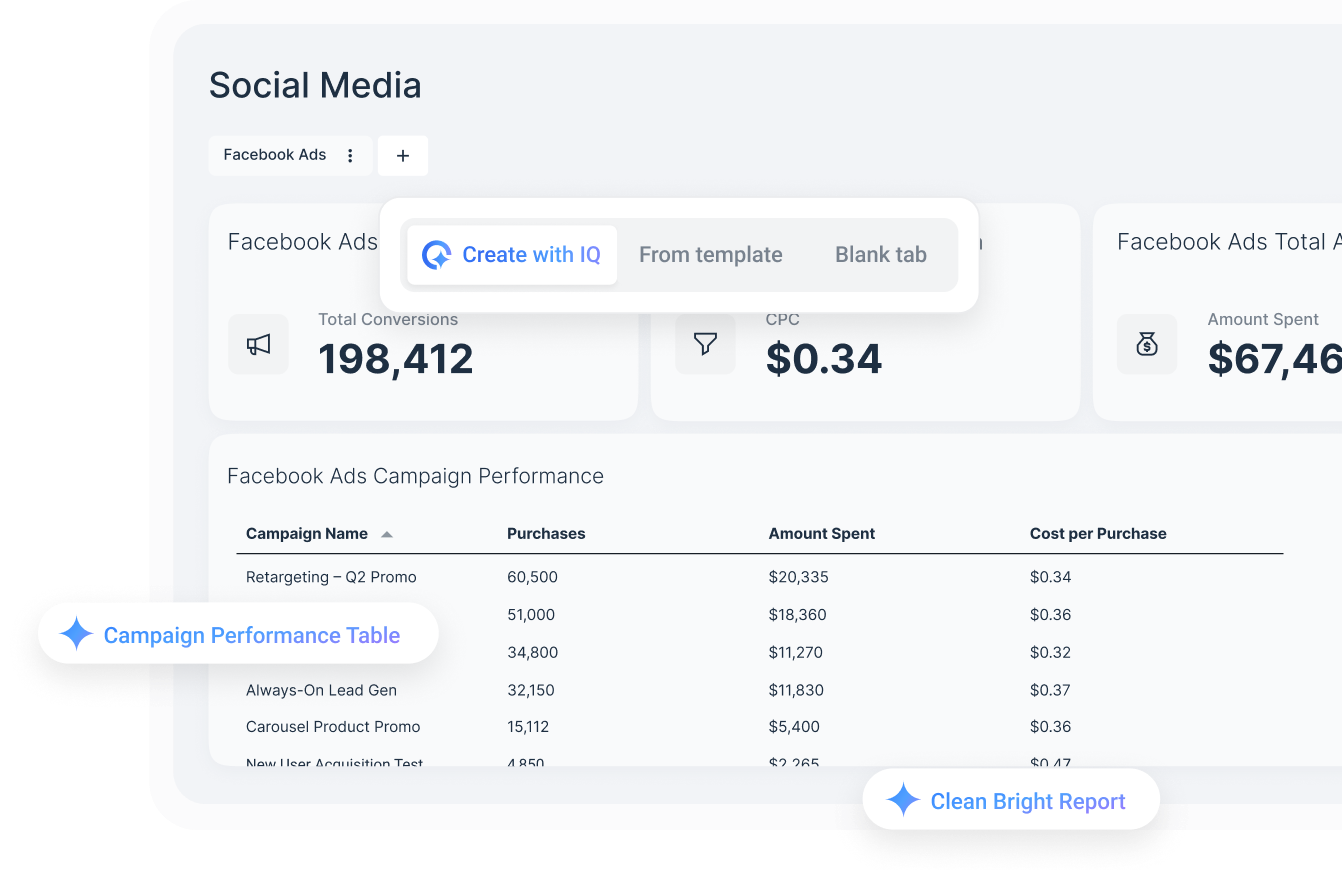
• Just ask Whatagraph to build you a report, create custom dimensions and metrics, and extract insights in seconds.
• Whatagraph 3.0 leads the shift from passive reporting to instant decision making.
• Just ask Whatagraph to build you a report, create custom dimensions and metrics, and extract insights in seconds.
• Whatagraph 3.0 leads the shift from passive reporting to instant decision making.