The Ultimate Shopify Dashboard to Monitor Your eCommerce Key Metrics
Connect Whatagraph with your Shopify account and get a visual quick overview of the performance of your client’s eCommerce website. Increase your sales by analyzing your top products and finding out where you need to make changes. Highlight real-time live data and track all your eCommerce KPIs in one place with Whatagraph.


Cross-Channel Dashboard With Google Analytics and 40+ Data Sources
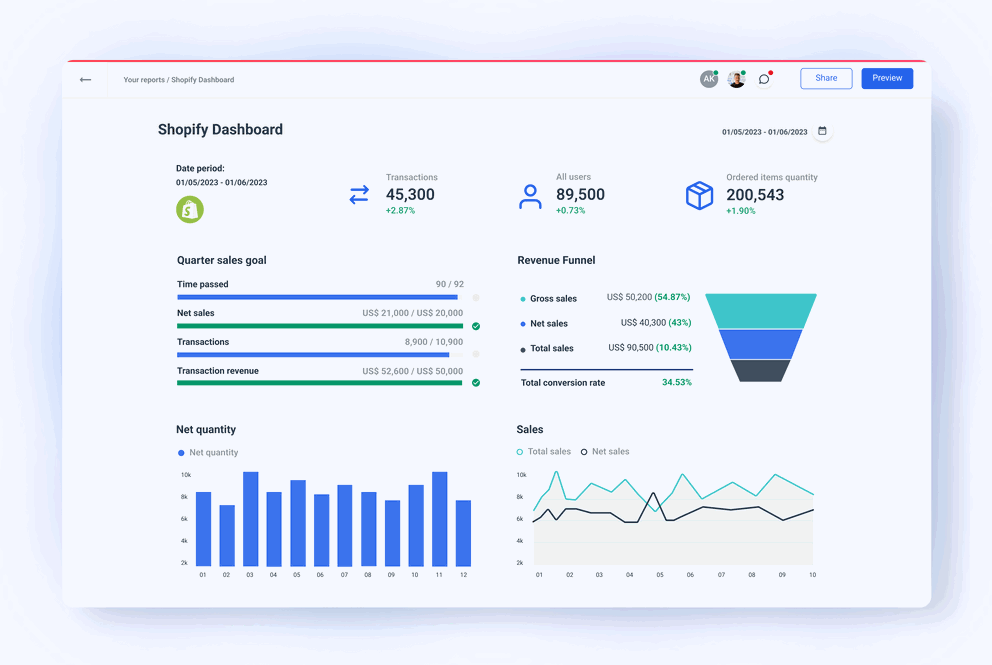
One Place to Monitor Your Shopify Store Performance
Develop the perfect Shopify dashboard and learn about the number of orders your eCommerce store receives on regular basis. Find out what’s the revenue of your online store and break it down into actionable insights. Dig deeper into your sales data and monitor your efforts to market your business. Use our drag-and-drop data visualization widgets to highlight the
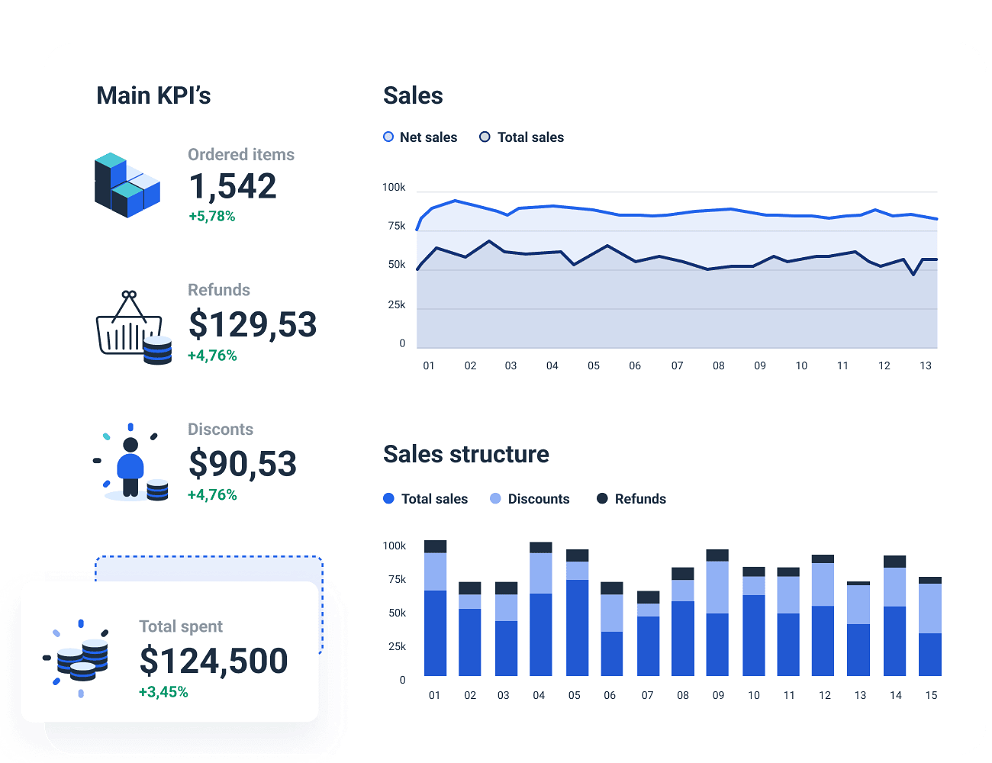
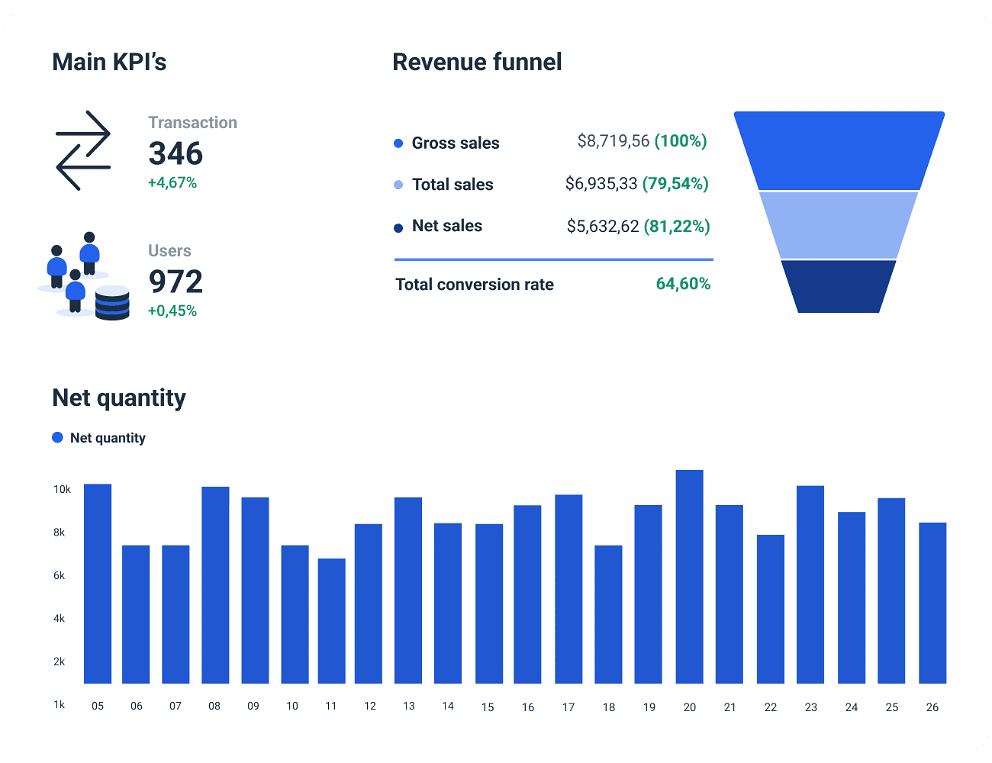
All Your Shopify KPIs in Real-Time
Track your average purchases, average order value, total sales and refunds, conversion rate, net sales, gross sales… and many other KPIs in real-time with Whatagraph. The Shopify dashboard in Whatagraph offers high-level insights and is easy to understand. Our real-time overview dashboard automatically updates itself whenever a change occurs. Generate a live Shopify dashboard link for your company stakeholders with the most current and up-to-date Shopify data.
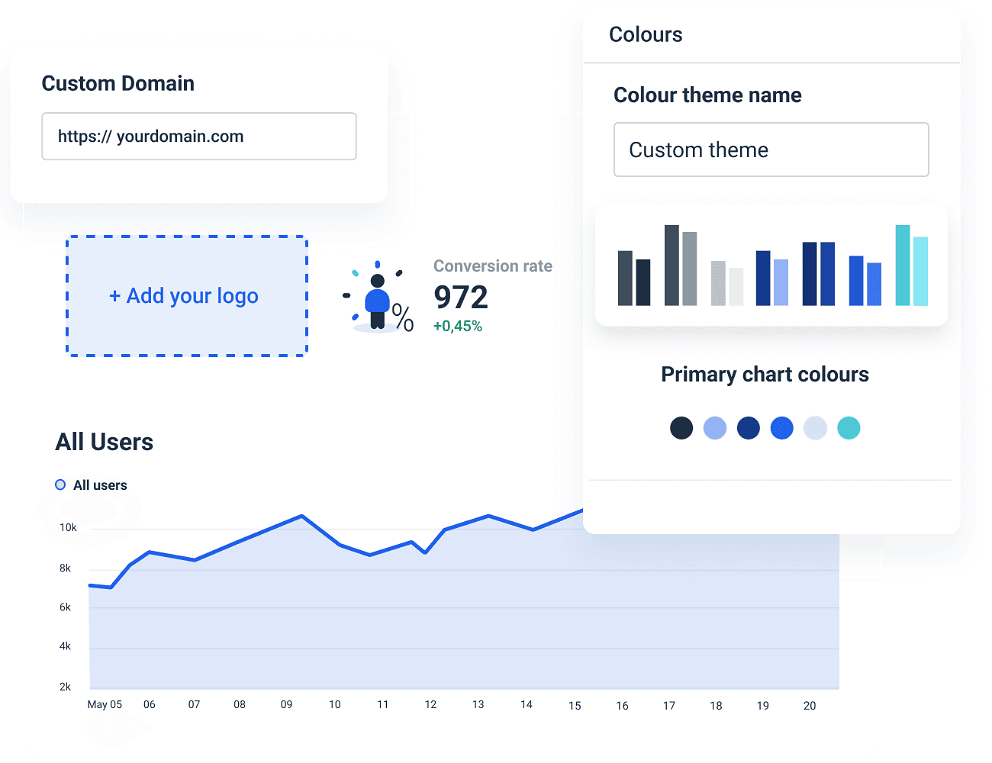
Customize Your Shopify Dashboard According to Your Agency Needs
Customize and personalize your client's Shopify dashboard. Remove our Whatagraph branding and implement characteristics of your client’s eCommerce business branding. Change colours, logos, domains, headings and widgets. Add new formulas. Don’t be limited to the pre-made Shopify dashboard template. Adjust and alter every part of the report to meet your and your client’s needs.
All reporting features your agency needs


Frequently Asked Questions
How Do I Create a Shopify Dashboard in Whatagraph?
In less than 5 minutes by taking three simple steps!
1. Create your Whatagraph account.
You’ll need an email address and a password - no credit card required.
2. Choose how you want to create a report.
- Start from a blank page and use our drag & drop widgets to develop a Shopify dashboard;
- Select the pre-built Shopify dashboard template to get an overview of your marketing performance to increase Shopify sales - you can create a benchmark report in under five minutes.
3. Connect your Shopify account and you’re good to go.
What Other Tools Does Whatagraph Integrate With?
- WooCommerce;
- BigCommerce;
- Amazon Advertising;
- Google My Business.
How Many Shopify Accounts Can I Add to My Dashboard?
It’s good to be loved! Our clients are not shy about expressing it.
I made a switch from GDS and Sheets for reporting to Whatagraph, and I am saving literal hours each week on performance report creation. Our small firm actually managed to onboard 2 new clients as a result of all the time we saved on managing data and reporting. The customer service is also really helpful and easy to reach.

Capterra verified review by
Mindaugas S., Marketing Consultant
Having active customer support to help fix any issues was a big contributor, but we also really liked the ability to save templates and connect sources to multiple charts/widgets at once without having to edit them individually. And having the grid layout is much easier to stay consistent with than the free form setup that Data Studio has.

Capterra verified review by
Nico T., Media Planner
The system has standard templates that are easy and fast to use. Also you can build your own report with lightning speed. It is very easy to use, has a lot of integration, and let get started very fast.

Capterra verified review by
Rasmus Bernt K., External Senior Management Consultant
We love Whatagraph - we would definitely recommend and our account manager is great! I love how easy this tool is to use, everyone on the team finds it much more user-friendly than other dashboards. Integration was easy, we sent some example reports to the team who duplicated these for us. We literally had to log in and send it to our clients!

Capterra verified review by
Stephanie S., Digital Director
We are showing our clients the work that we're doing for them and this is incredibly important for our clients ROI. They want to see results and having a tool like Whatagraph that can show data from virtually every source we use is hugely important.

Capterra verified review by
John S., SEO Strategist
The tool is easy to use; you do not need to have development resources. Even my junior project managers are capable of making campaign reports in minutes. There are a lot of pre-made templates you can use as well as many pre-made widgets.

Capterra verified review by
Erman E., Marketing Specialist
Really easy to connect data sources within the tool. The library of report templates has been helpful. The customer support team has been responsive to all of our needs. Our team enjoys the simplicity of setting up the reports and how the data is presented.

Capterra verified review by
Brent N., Director of Operations
Easy to create really beautiful graphs and reports which can help other team members to understand the most important takeaways. I especially like the automated report function, so I don't have to check on the same thing repeatedly.

Capterra verified review by
Orsolya S., Online Marketing Manager