
How to Structure Your Looker Studio Facebook Ads Report Template on Whatagraph
A good Facebook Ads report doesn’t just list numbers — it tells a story your clients (or execs) can actually follow.Here’s how to structure your Looker Studio Facebook Ads report template inside Whatagraph for a clean, data-driven, and automated workflow.
Each section below mirrors the layout of the actual report template you’ll be able to use — built by marketers, not developers.
1. Performance Summary
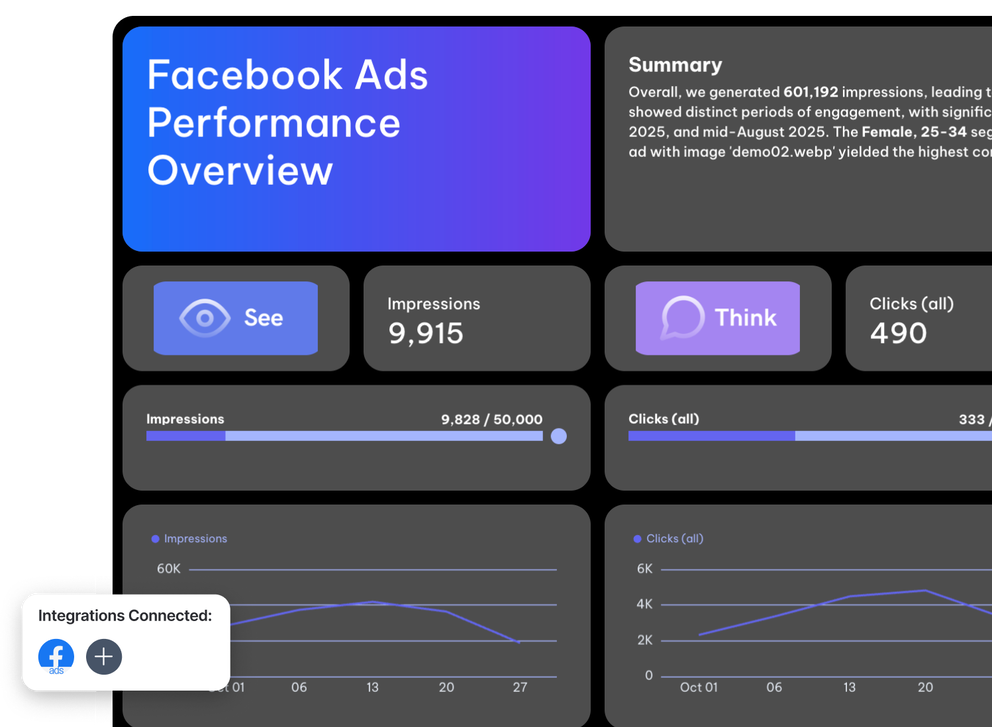
Start your report with a concise snapshot that answers one question: How did our Facebook Ads perform this period?
In Whatagraph, the Performance Summary section includes:
- A text box summarizing your campaign’s performance for the selected time range (e.g., monthly or quarterly).
- A goal widget showing how close your campaigns are to hitting targets like CTR, conversions, or ROAS.
- A performance summary list outlining KPIs such as impressions, clicks, ad spend, cost per click (CPC), and conversion rate.
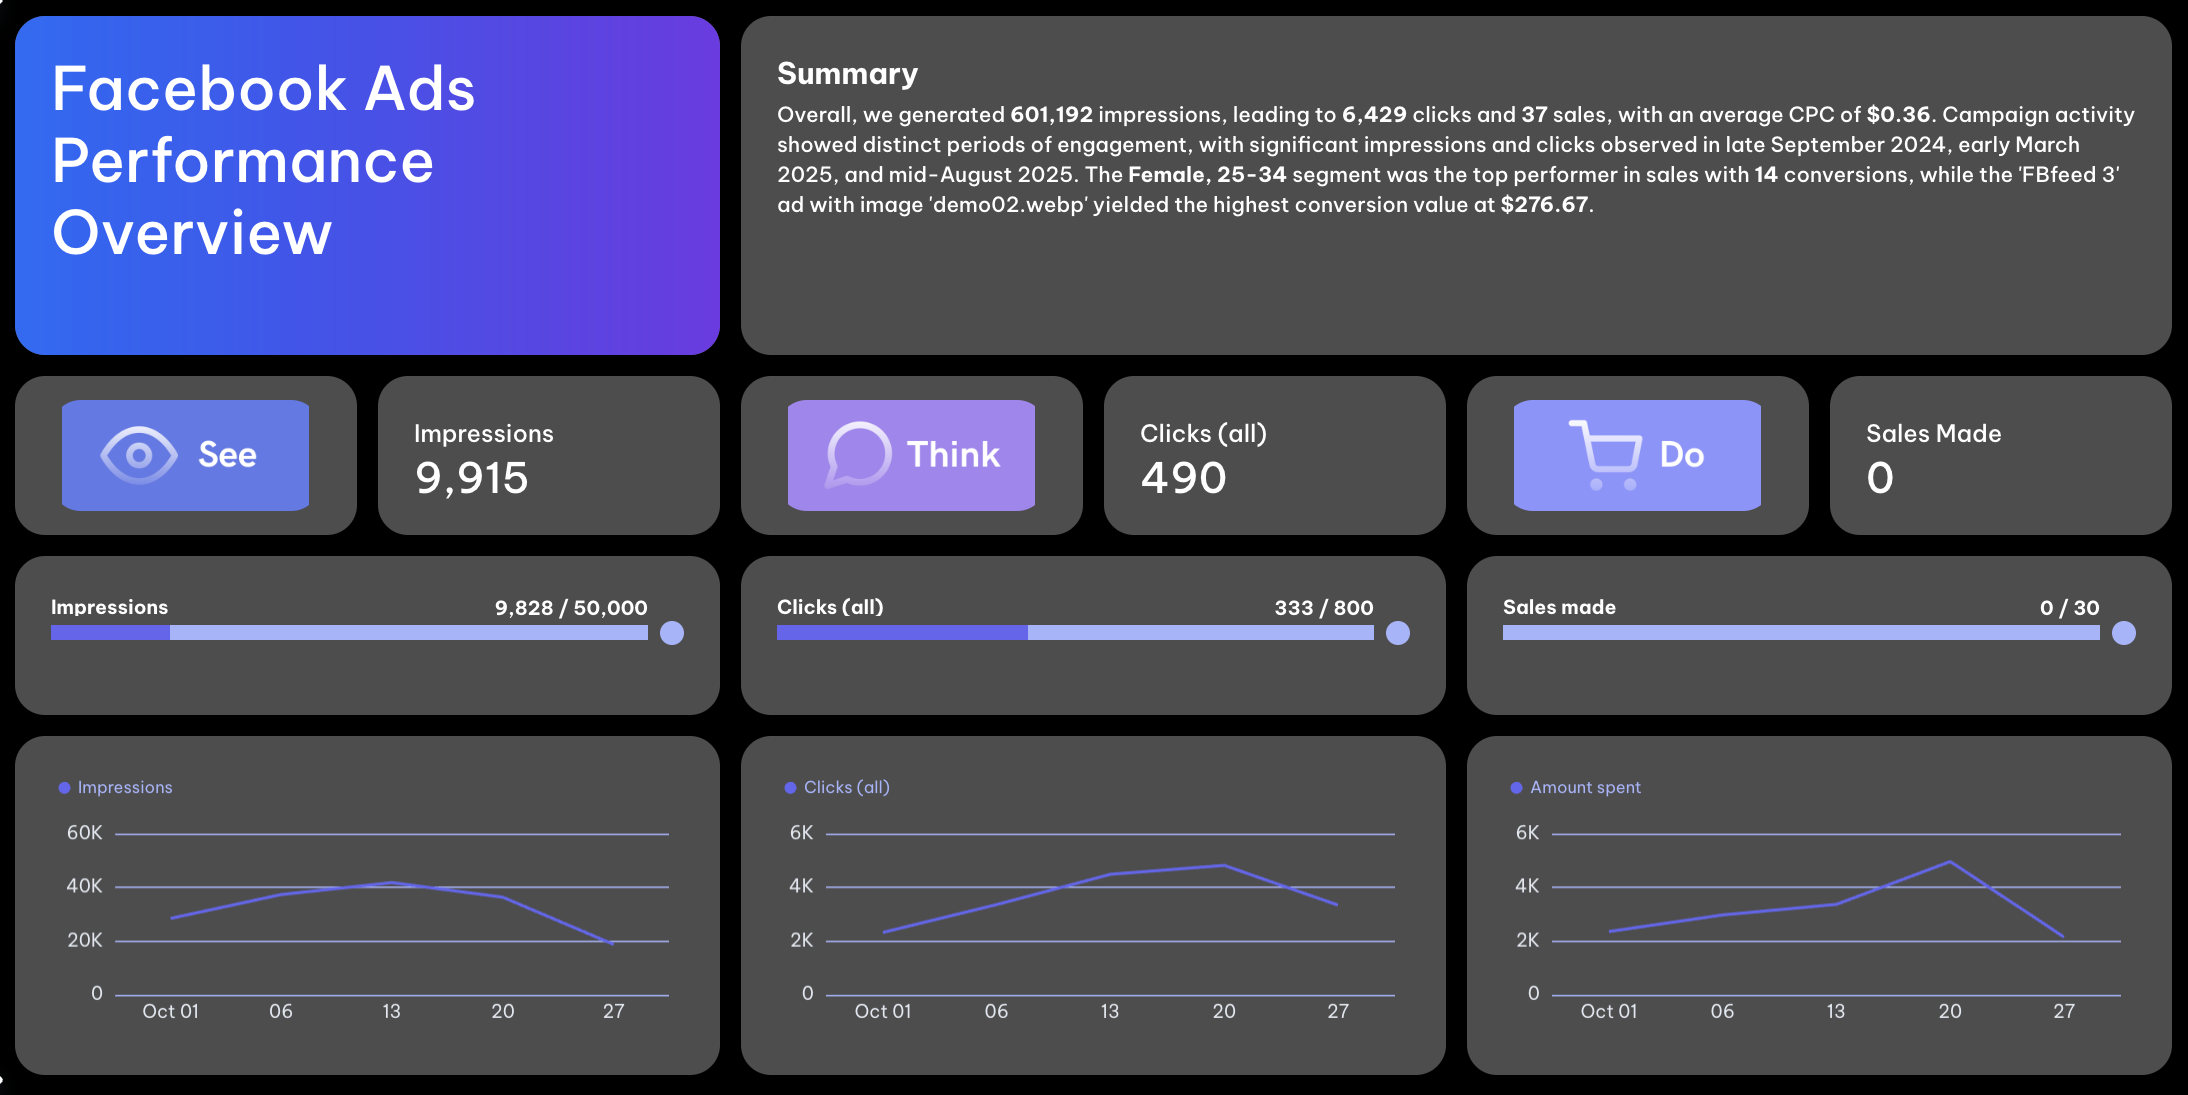
2. Overview of KPIs
This is where your key metrics (KPIs) come to life.
In Whatagraph, you can showcase the metrics you and your client (or internal stakeholder) agreed matter most, for example, CTR, CPM, ROAS, conversions, engagement rate, and ad spend.
Compare results with the previous period (for instance, this month vs. last month) to highlight trends. Line charts and bar graphs automatically visualize growth, declines, or stability in campaign performance.
While a Looker Studio report might require separate widgets and formulas to achieve this, Whatagraph’s dashboard template does it for you — with visualizations and comparisons pre-built into the free report template.
3. Campaign Performance
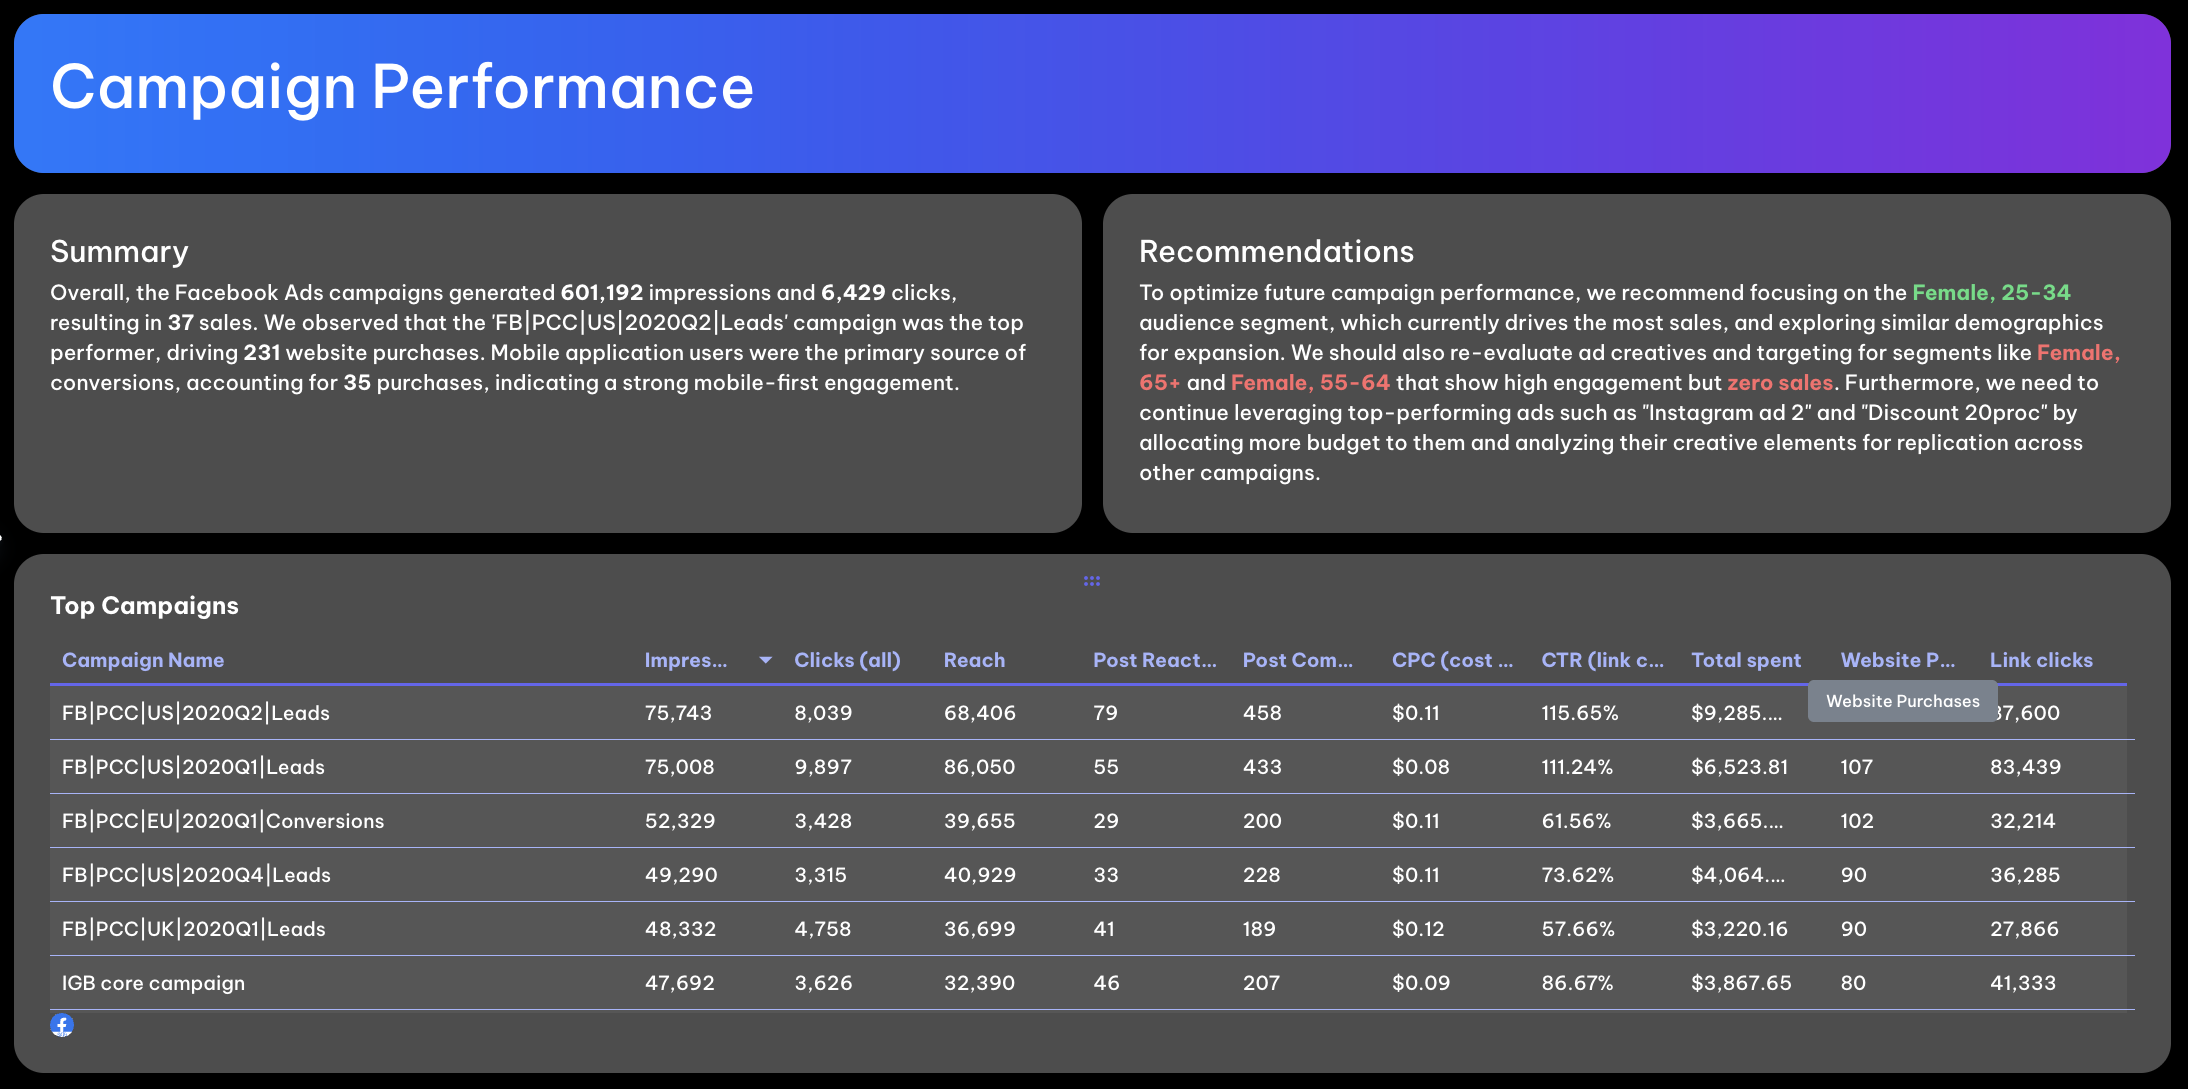
The campaign section breaks down how each Facebook Ads campaign performed during your reporting period.
It includes:
- A summary text box that highlights which campaigns drove the most conversions or engagement.
- A recommendations text box for your own expert analysis — for instance, reallocating ad budget from low-CTR campaigns to high-performing ones.
Underneath, you’ll see a campaign performance table displaying KPIs per campaign: ad spend, impressions, CTR, CPC, ROAS, and conversion rate.
This section gives clients and teams a transparent view of how each campaign contributed to overall goals, without having to dig through Looker Studio filters or complex data sources.
4. Ads Performance
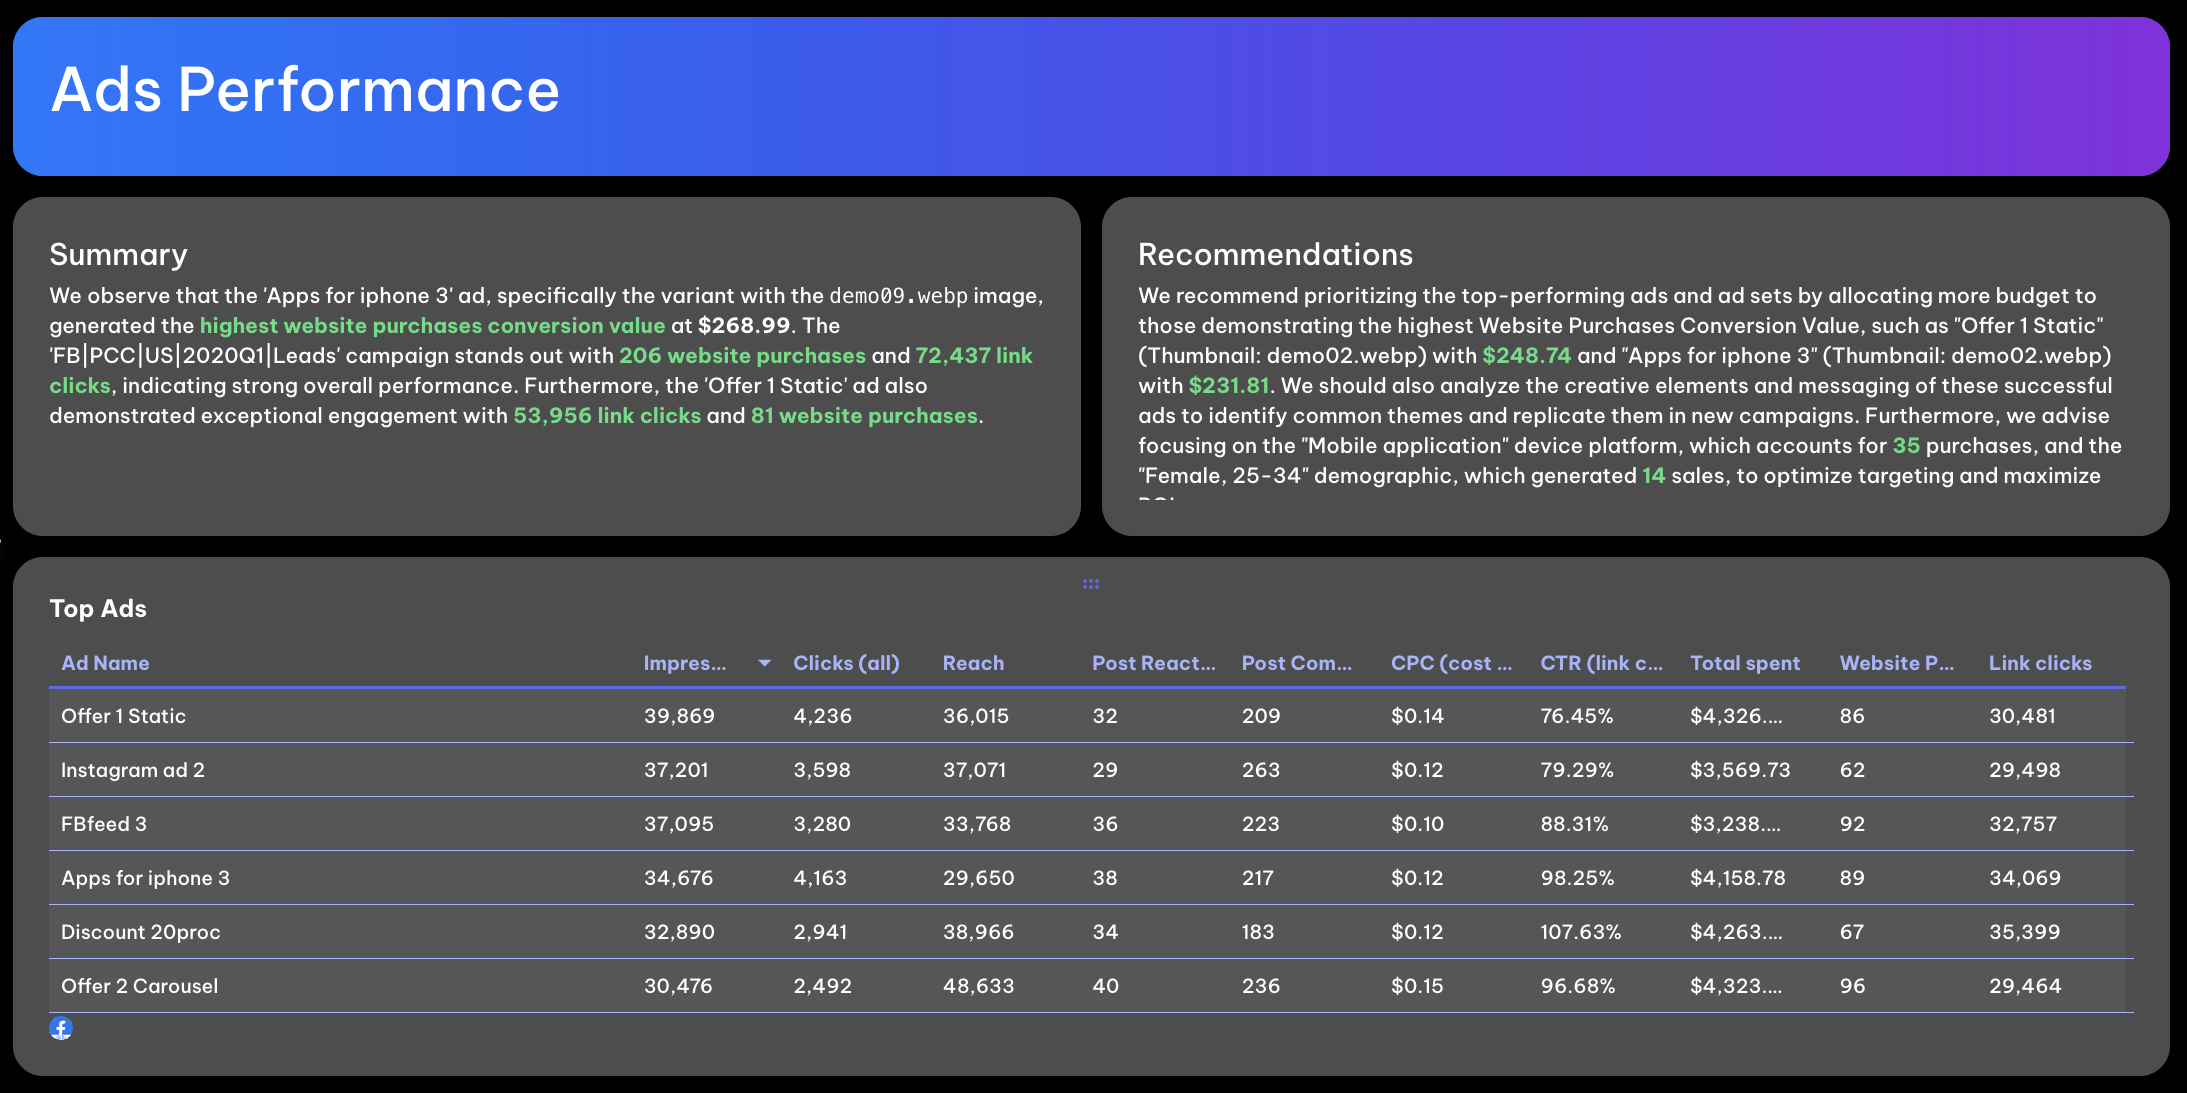
Here’s where you get granular.
The Ads Performance section showcases your top-performing ad creatives — perfect for analyzing which visuals, messages, or formats are converting best.
It features:
- KPIs per ad (CTR, CPC, conversions, and engagement rate).
- A carousel widget displaying each ad’s creative for easy visual reference.
- A summary text box highlighting standout ads and why they performed well.
- A recommendations box suggesting what to replicate or pause next month.
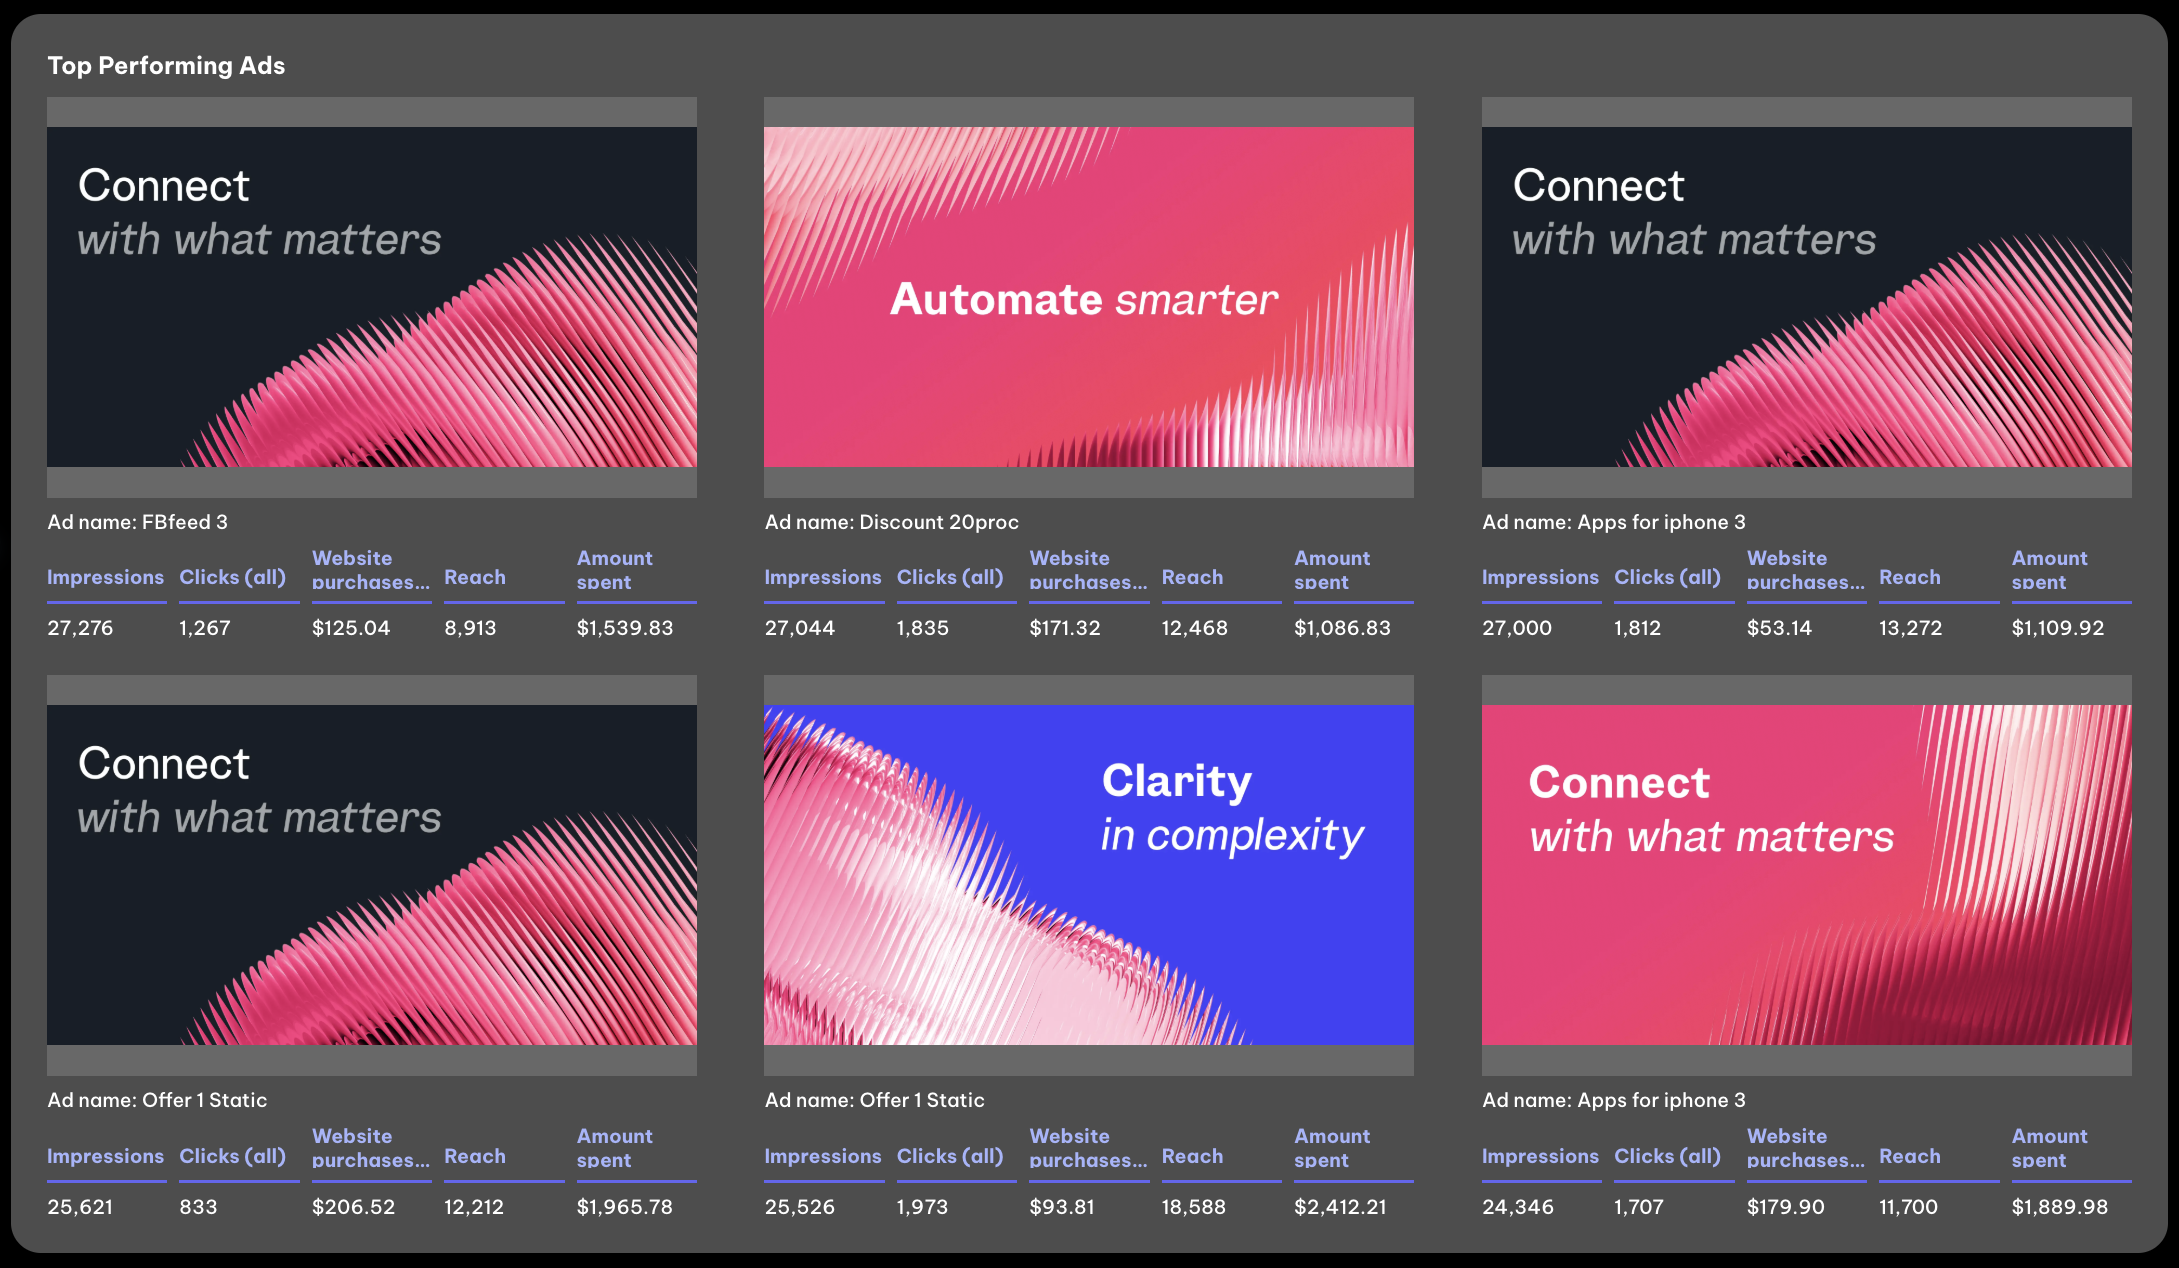
In Looker Studio, setting this up would require multiple data blends and custom connectors.
In Whatagraph, your ad-level performance dashboard updates automatically, so you can focus on optimizing creative strategy instead of rebuilding reports.
5. Audience and Device Performance
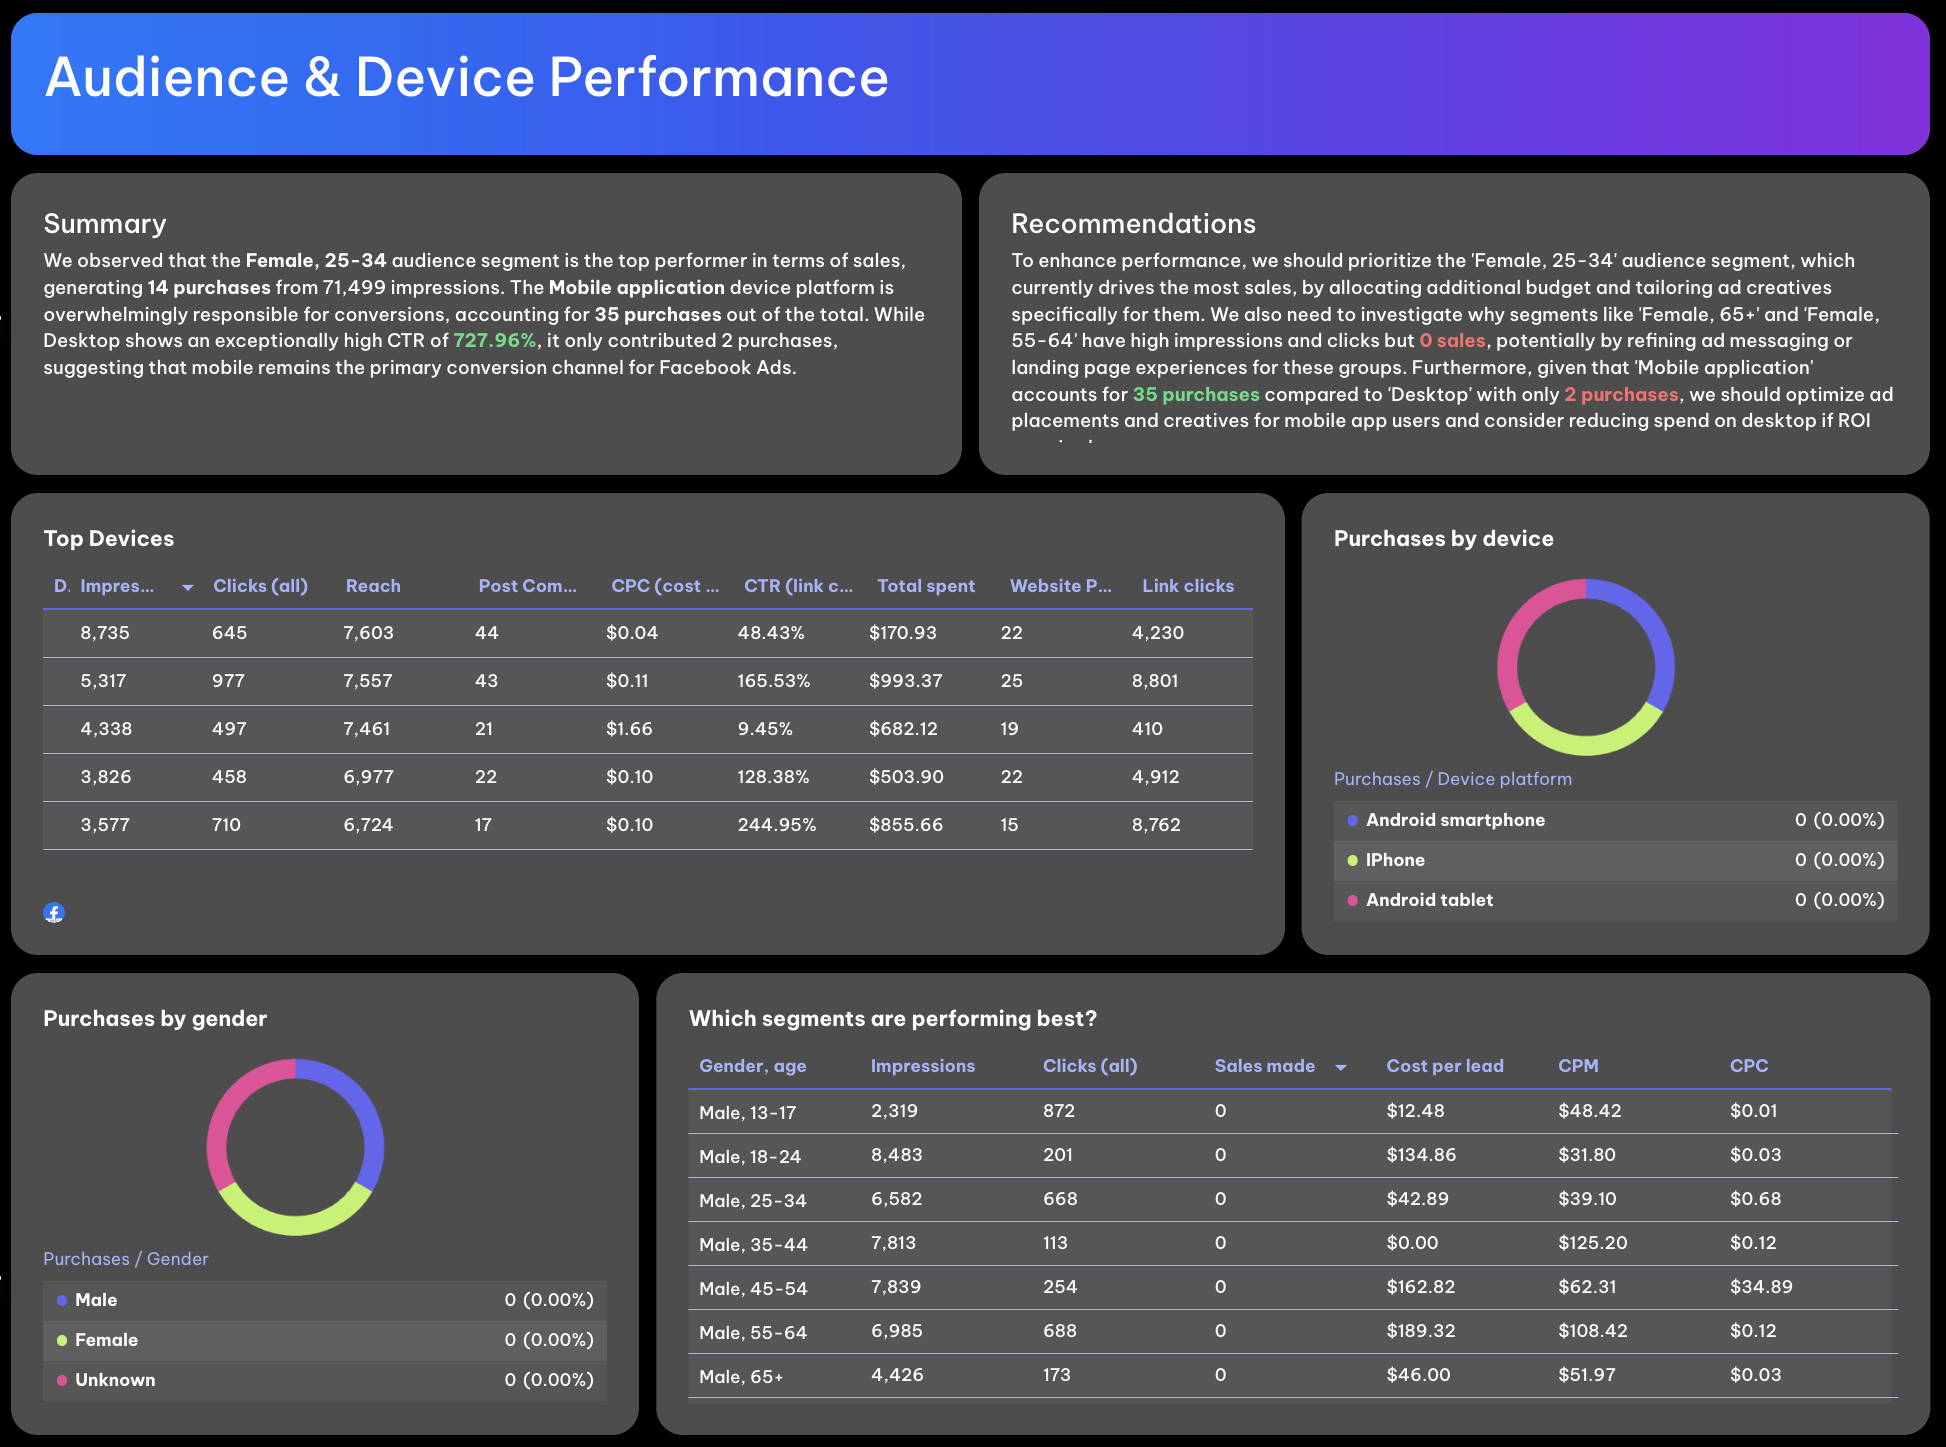
To round out your report, analyze how your ads performed across audience segments and devices.
This part of the Looker Studio Facebook Ads report template includes:
- Top devices: Which device types (desktop, mobile, tablet) deliver the best results and conversion rates.
- Purchases by device or gender: Clear breakdowns that highlight user behavior and buying trends.
- Audience demographics: See which age groups and genders drive the highest engagement and lowest CPC.
This section is where you turn marketing data into actionable insights, helping optimize audience targeting and ad placements for future campaigns.
Pro tip:
While Looker Studio requires you to manage connectors, data sources, and refresh schedules manually, Whatagraph automates all of it.
Your Meta Ads, Instagram Ads, and even Google Ads data stream into one unified, real-time dashboard. This gives you more time to optimize campaigns and less time building dashboards.
Which Metrics Should You Include in Your Looker Studio Facebook Ads Report Template?
Before diving into the data, it’s essential to align on the KPIs and metrics you’ll track and report right off the bat.
For agencies, this happens during client onboarding: when you define what success looks like, For in-house marketing teams, it’s when you launch a new Facebook Ads campaign or project, making sure everyone agrees on the key metrics tied to business goals.
Once aligned, here’s what your Looker Studio Facebook Ads report template in Whatagraph should include (and why each metric matters):
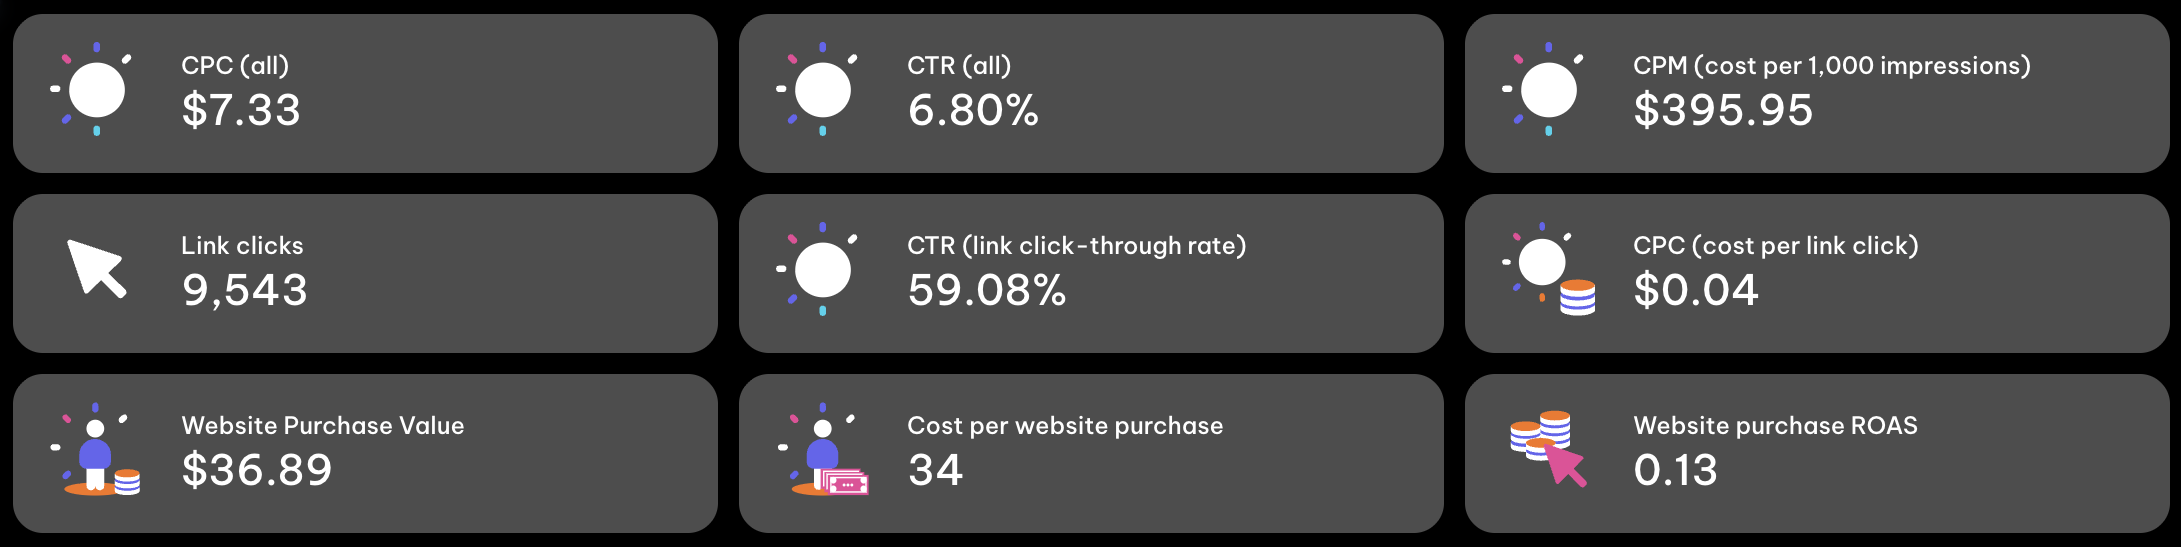
1. Impressions
What it is: The total number of times your ads were shown.
Why it matters: Impressions help gauge overall reach and ad visibility. Tracking them over time shows whether your campaigns are scaling effectively or need optimization in ad budget or targeting.
2. Reach
What it is: The unique number of people who saw your ads.
Why it matters: Reach ensures you’re not just paying for repetitive views. A healthy ratio of reach to impressions signals strong distribution across audiences, especially valuable when analyzing multi-channel or e-commerce campaigns.
3. Clicks (All)
What it is: The number of total clicks your ad received, across all interactions.
Why it matters: Clicks represent engagement. Combined with CTR (click-through rate) and CPC (cost per click), they help evaluate whether your ad creatives and campaign objectives resonate with your audience.
4. Click-Through Rate (CTR)
What it is: The percentage of people who clicked on your ad after seeing it.
Why it matters: A core engagement indicator. A high CTR means your visuals and messaging align well with your audience; a low one might signal creative fatigue or weak relevance.
5. Cost Per Click (CPC)
What it is: The average amount paid for each click.
Why it matters: CPC reflects the efficiency of your ad spend. Monitoring this metric ensures you’re not overpaying for engagement, and it can expose opportunities for better budget allocation or targeting refinement.
6. Cost Per 1,000 Impressions (CPM)
What it is: The cost to show your ads a thousand times.
Why it matters: CPM is critical for comparing campaign efficiency — especially when analyzing different ad placements or platforms like Instagram Ads or LinkedIn Ads alongside Facebook Ads data.
7. Conversions (Website Purchases / Leads)
What it is: The total number of completed actions driven by your ads — purchases, form fills, or downloads.
Why it matters: This metric ties performance to outcomes. It’s the bridge between ad performance and actual revenue or lead generation results.
8. Conversion Rate
What it is: The percentage of users who took the desired action after clicking your ad.
Why it matters: Your conversion rate helps gauge landing page effectiveness and the overall customer journey: a key indicator for decision-making and campaign optimization.
9. Return on Ad Spend (ROAS)
What it is: The revenue generated per dollar spent.
Why it matters: ROAS is one of the most important Facebook Ads performance metrics. It tells you whether your campaigns are truly profitable, helping agencies justify ad budgets and brands prove ROI.
10. Website Purchase Value
What it is: The total value generated from conversions.
Why it matters: This metric connects marketing impact to business outcomes. In Whatagraph, it’s tracked automatically, unlike in Looker Studio, where you’d have to manually blend data sources.
11. Device & Demographic Breakdown
What it is: Performance segmented by device type, age, and gender.
Why it matters: Your audience demographics reveal where conversions happen and who’s buying. For instance, the report shows that Female, 25–34 users generated the most purchases, a key insight for optimizing creative and targeting strategy.
12. Campaign & Ad Performance Metrics
What it is: Campaign-level and ad-level KPIs like impressions, reach, CTR, CPC, conversions, and ROAS, with summaries and recommendations.
Why it matters: These granular views help identify your top-performing ads, campaigns, and data sources, while pinpointing where optimization will have the biggest impact.


