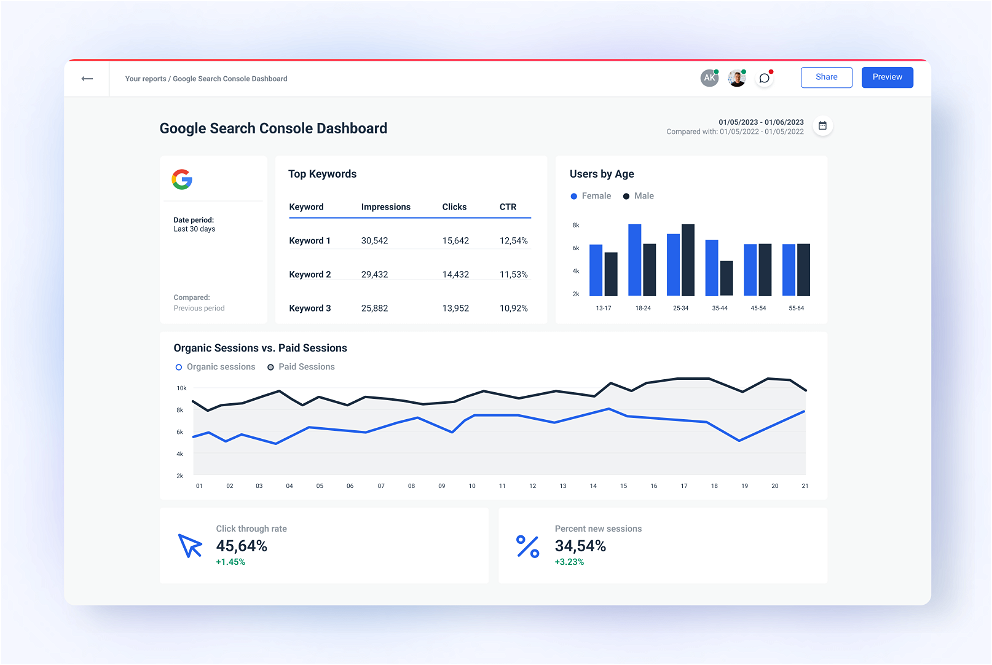
Google Search Console Dashboard Template
Create a Google Search Console dashboard with Whatagraph and find out how Google currently sees your client’s website. Get valuable real-time insights into traffic, customer behavior, and top landing pages. Generate more traffic by tracking the search queries. Highlight the pages that receive the most clicks from the SERP. Impress your clients with personalized, accurate and professional dashboards.


Create a Dashboard From a Template Within Minutes and Have It Updated in Real-Time
Create a Dashboard From a Template Within Minutes and Have It Updated in Real-Time
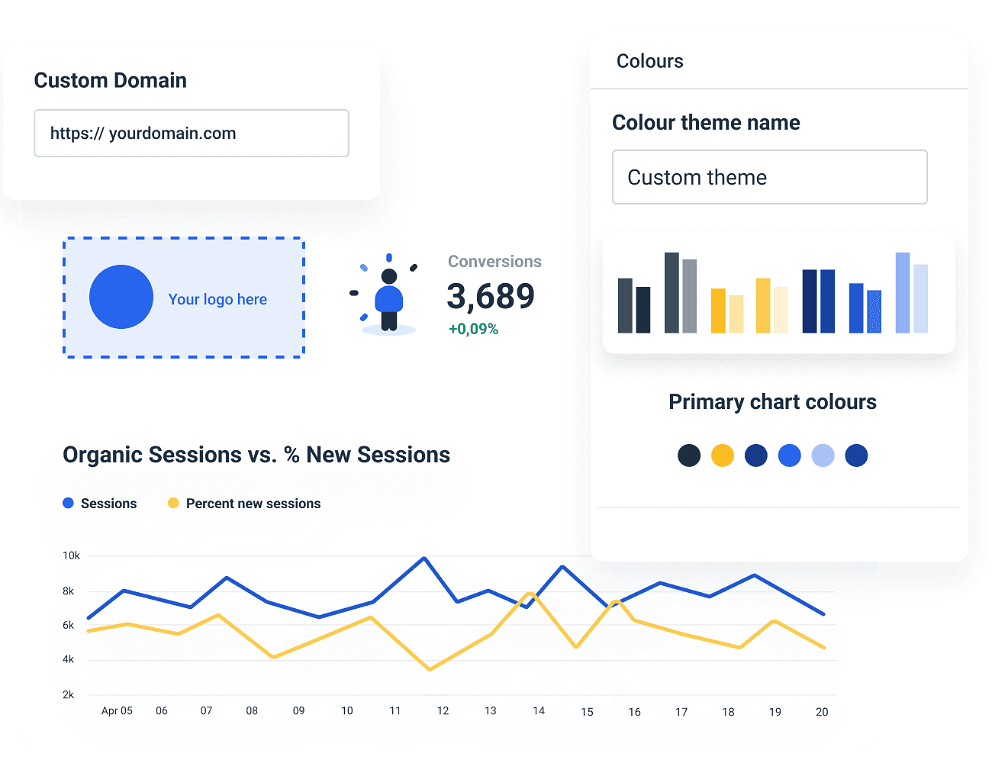
Customize Your Google Search Dashboard to Match Your Agency and Client Branding
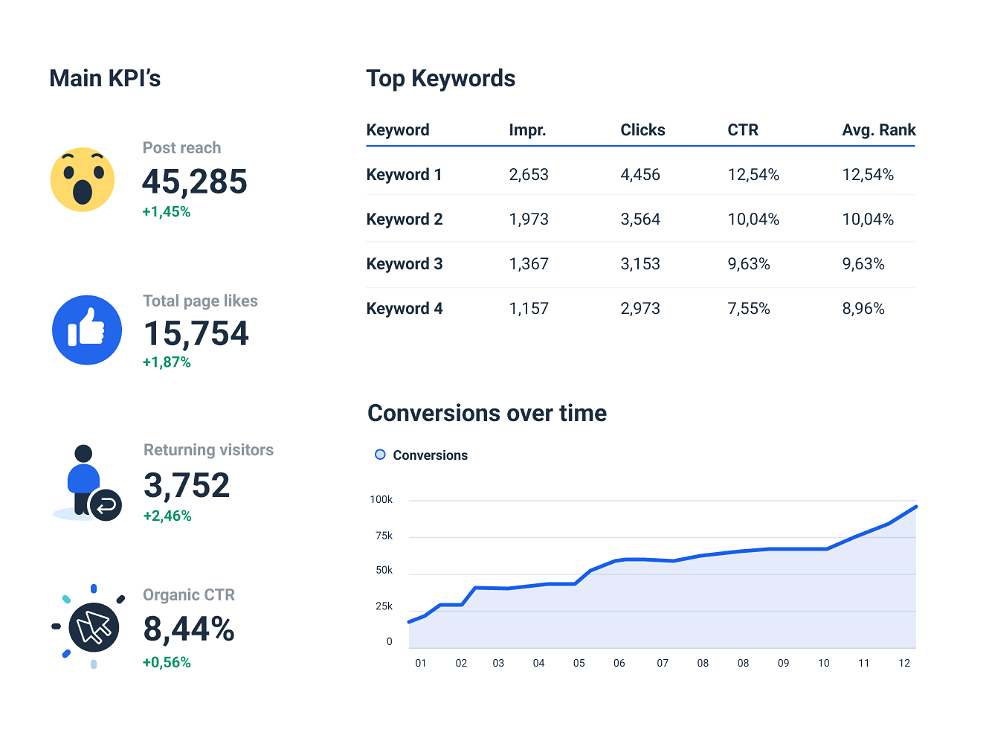
Real-Time Reporting on Your Most Important SEO Metrics
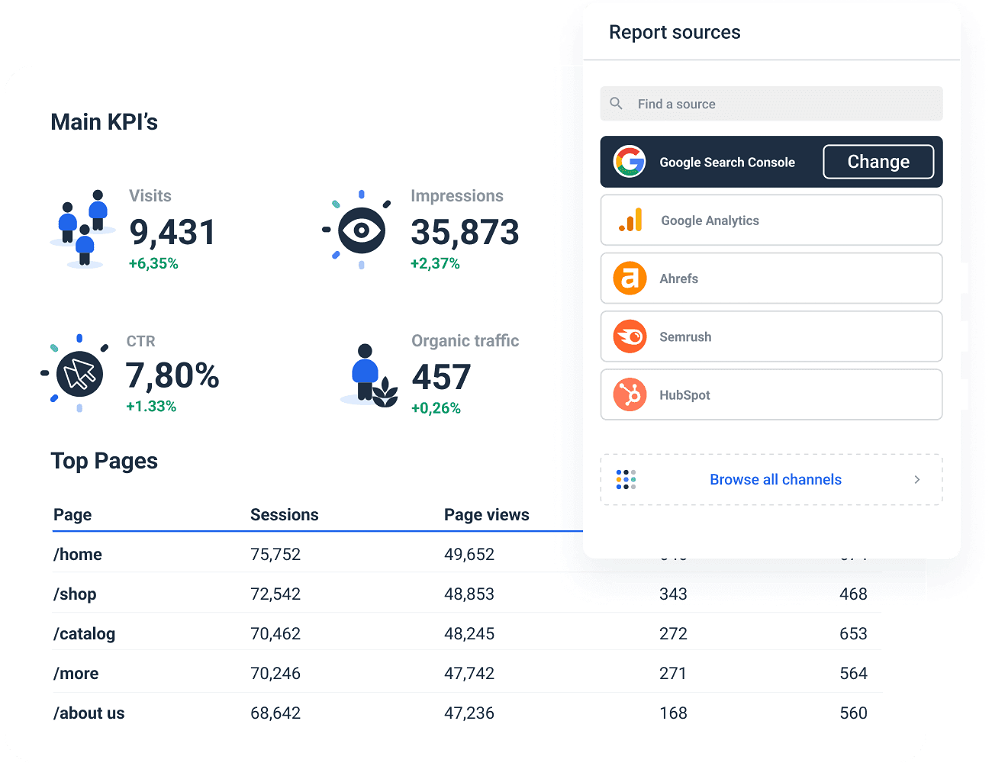
Track the current status of your CTR, search positions, impressions, SERP, traffic, average positions, top pages, most used devices, top queries… and many other Google Search Console metrics. Connect Google Analytics, Ahrefs, SEMRush, HubSpot, or any other marketing platform from the 40+ data sources in Whatagraph. Get actionable insights and optimize for better traffic and click-through rates and Google Search results.
Frequently Asked Questions
What Metrics Should I Use in a Google Search Console Dashboard?
- Total impressions;
- Average position;
- CTR;
- Search traffic;
- Mobile usability;
- AMP;
- Conversions;
- Organic search;
- Organic traffic;
- Website traffic.
What Other Tools Should I Use for a Cross-Channel SEO Performance Report?
All reporting features your agency needs


It’s good to be loved! Our clients are not shy about expressing it.
I made a switch from GDS and Sheets for reporting to Whatagraph, and I am saving literal hours each week on performance report creation. Our small firm actually managed to onboard 2 new clients as a result of all the time we saved on managing data and reporting. The customer service is also really helpful and easy to reach.

Capterra verified review by
Mindaugas S., Marketing Consultant
Having active customer support to help fix any issues was a big contributor, but we also really liked the ability to save templates and connect sources to multiple charts/widgets at once without having to edit them individually. And having the grid layout is much easier to stay consistent with than the free form setup that Data Studio has.

Capterra verified review by
Nico T., Media Planner
The system has standard templates that are easy and fast to use. Also you can build your own report with lightning speed. It is very easy to use, has a lot of integration, and let get started very fast.

Capterra verified review by
Rasmus Bernt K., External Senior Management Consultant
We love Whatagraph - we would definitely recommend and our account manager is great! I love how easy this tool is to use, everyone on the team finds it much more user-friendly than other dashboards. Integration was easy, we sent some example reports to the team who duplicated these for us. We literally had to log in and send it to our clients!

Capterra verified review by
Stephanie S., Digital Director
We are showing our clients the work that we're doing for them and this is incredibly important for our clients ROI. They want to see results and having a tool like Whatagraph that can show data from virtually every source we use is hugely important.

Capterra verified review by
John S., SEO Strategist
The tool is easy to use; you do not need to have development resources. Even my junior project managers are capable of making campaign reports in minutes. There are a lot of pre-made templates you can use as well as many pre-made widgets.

Capterra verified review by
Erman E., Marketing Specialist
Really easy to connect data sources within the tool. The library of report templates has been helpful. The customer support team has been responsive to all of our needs. Our team enjoys the simplicity of setting up the reports and how the data is presented.

Capterra verified review by
Brent N., Director of Operations
Easy to create really beautiful graphs and reports which can help other team members to understand the most important takeaways. I especially like the automated report function, so I don't have to check on the same thing repeatedly.

Capterra verified review by
Orsolya S., Online Marketing Manager