
What Are the Key Components of an Instagram Analytics Report?
A great Instagram analytics report example shows how to organize your data clearly, tell a story with your metrics, and help your marketing team make quick, data-driven decisions.
Let’s break down the core sections you’ll find in Whatagraph’s Instagram analytics report example.
1. Performance Summary
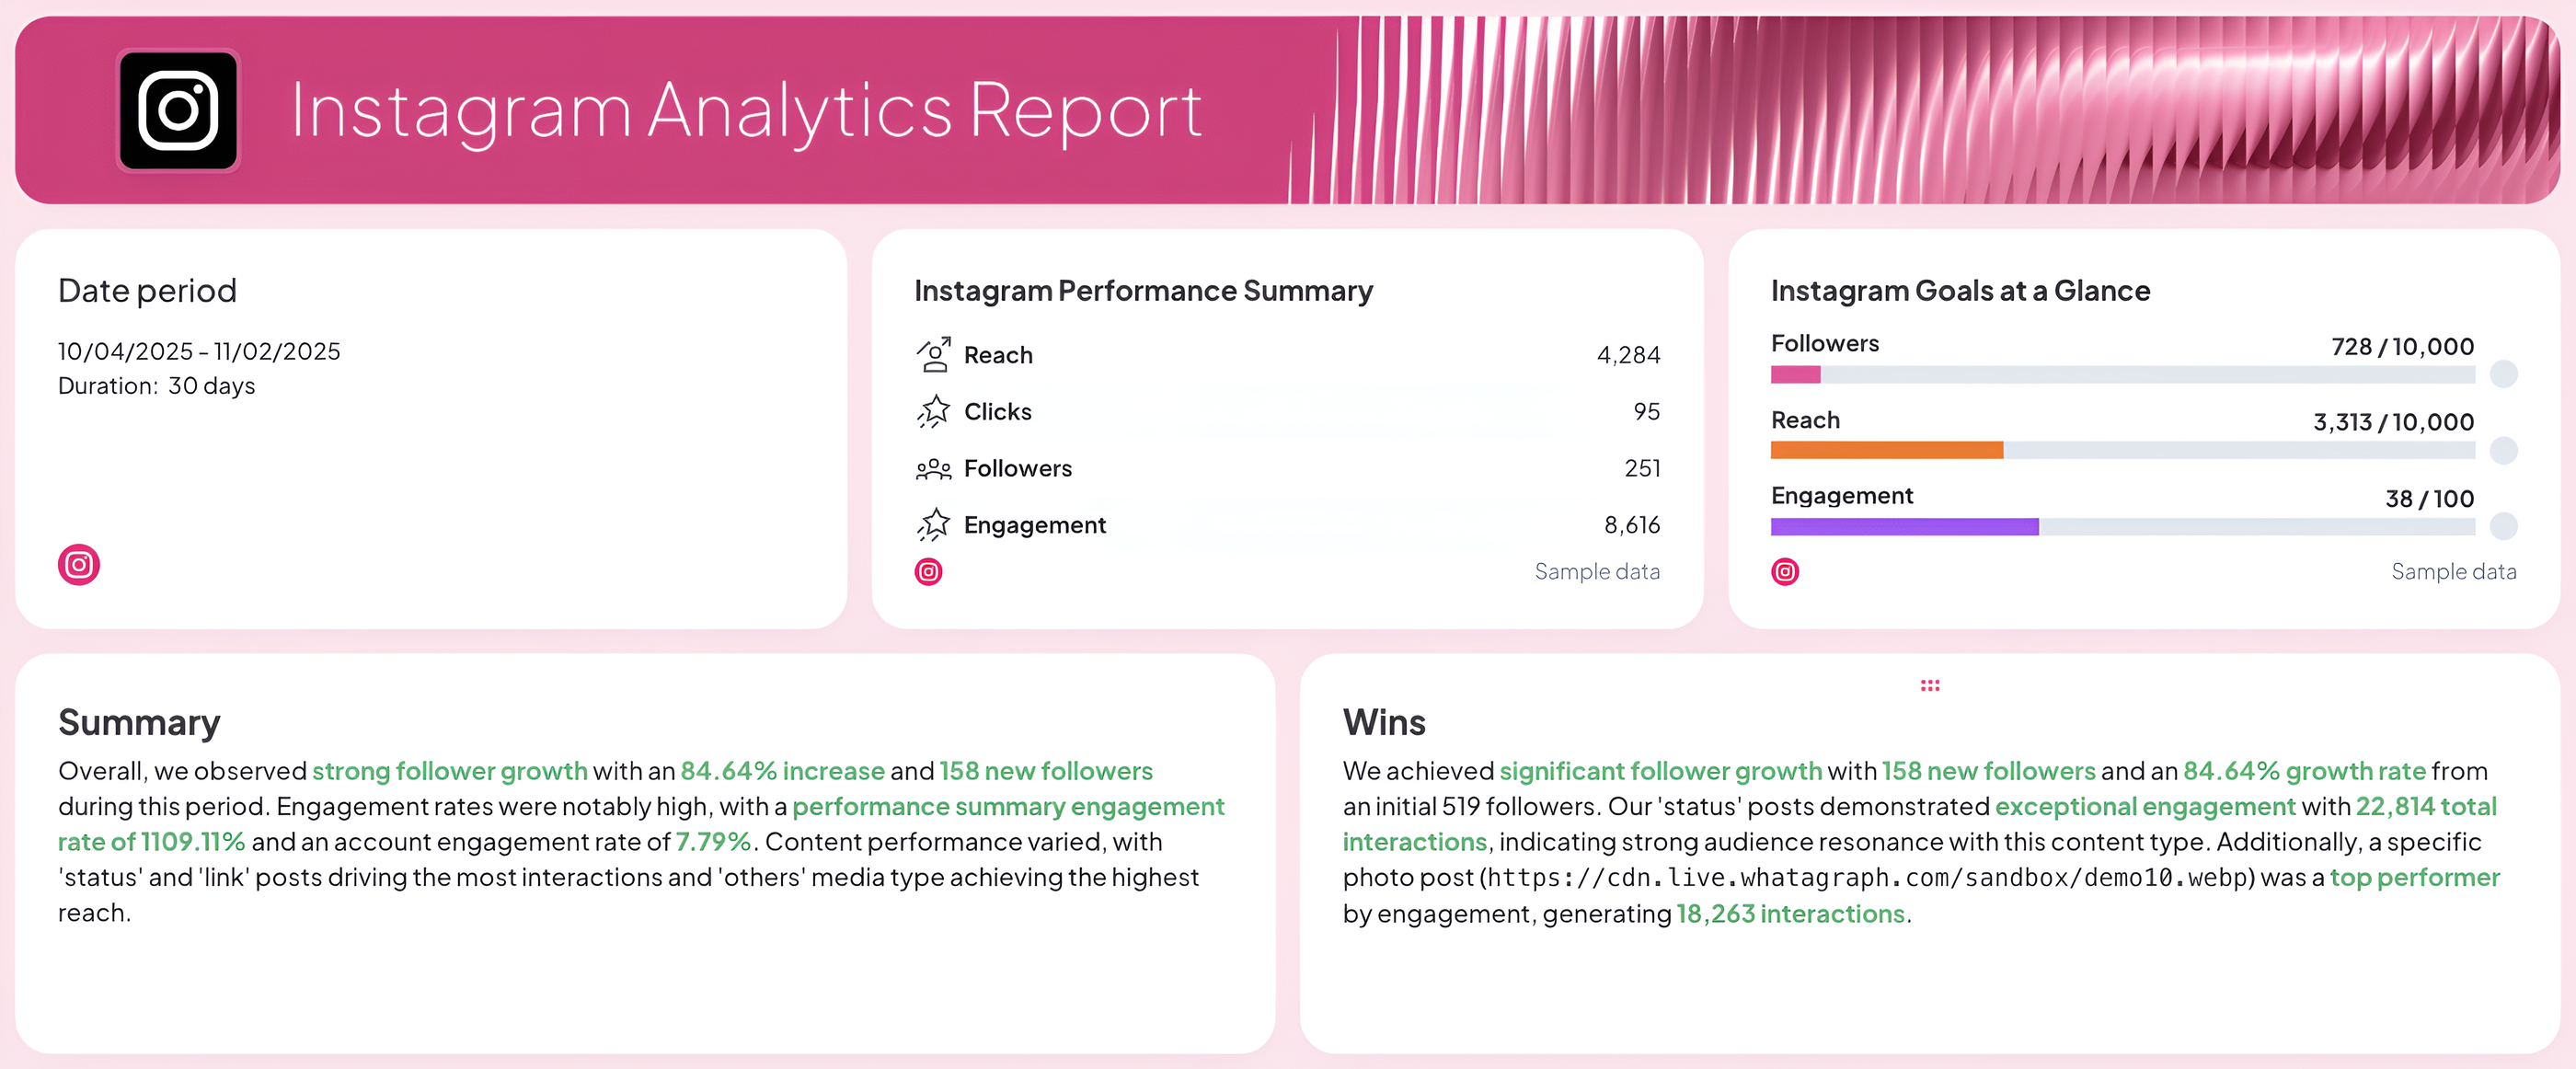 Right off the bat, you’ll see a clean overview that highlights your main KPIs, goals, and the reporting period.
In this example, the report includes:
- The date period to define when the data was collected.
- Goals that visualize how close you are to reaching your targets.
- An Instagram performance summary listing key metrics like reach, clicks, engagement, and follower count.
- Two text widgets, Summary and Wins, that explain the story behind the numbers.
In Whatagraph, these sections can be written automatically using Whatagraph IQ. You can choose from content types like Summary, Wins, Issues, or Recommendations, or type in your own prompt.
It analyzes your actual Instagram data (not generic info from other analytics tools) and writes insights in your language. Everything stays secure on one platform: no external uploads, no data risks.
2. Audience Breakdown
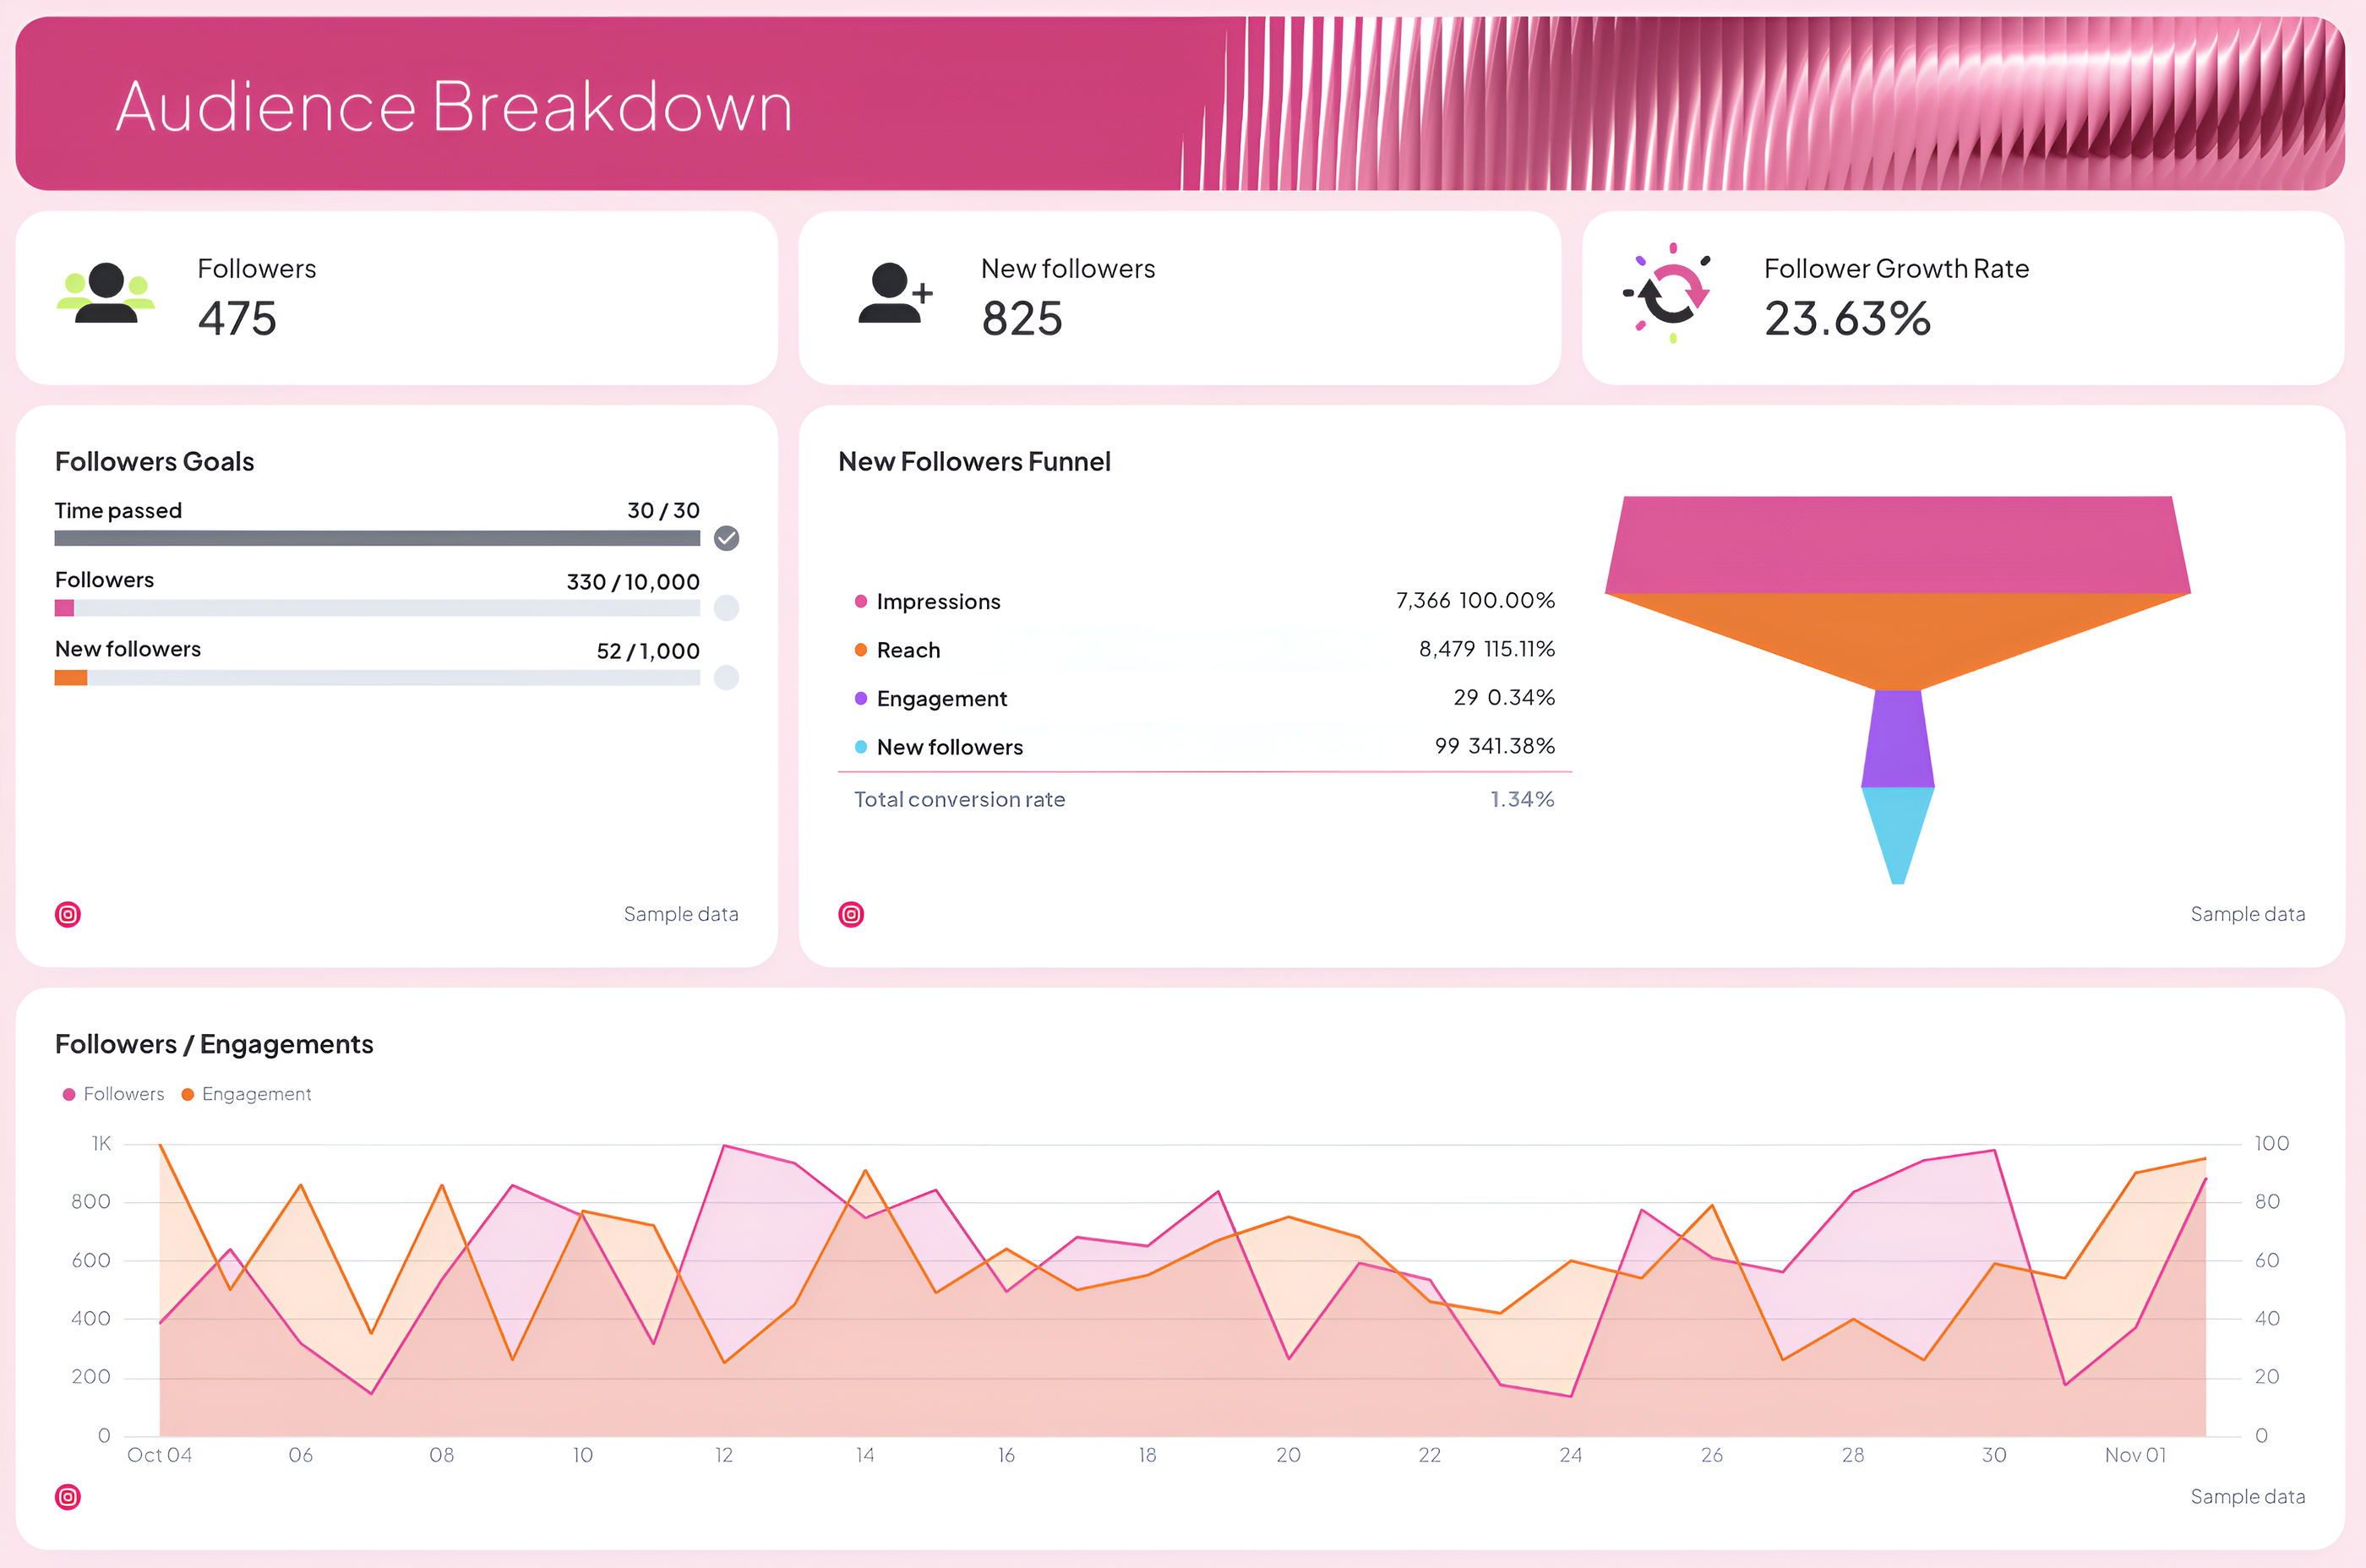
This section of the Instagram report focuses on who’s interacting with your content and how your follower growth is trending.
The example shows:
- Total followers, new followers, and overall growth rate
- Audience demographics by gender, age, and country
- A new followers funnel that connects reach, engagement, and conversion rate
- A visual graph tracking followers versus engagement across the reporting period
These visuals help identify your target audience and optimize your content strategy around what works best.
3. Engagement Breakdown
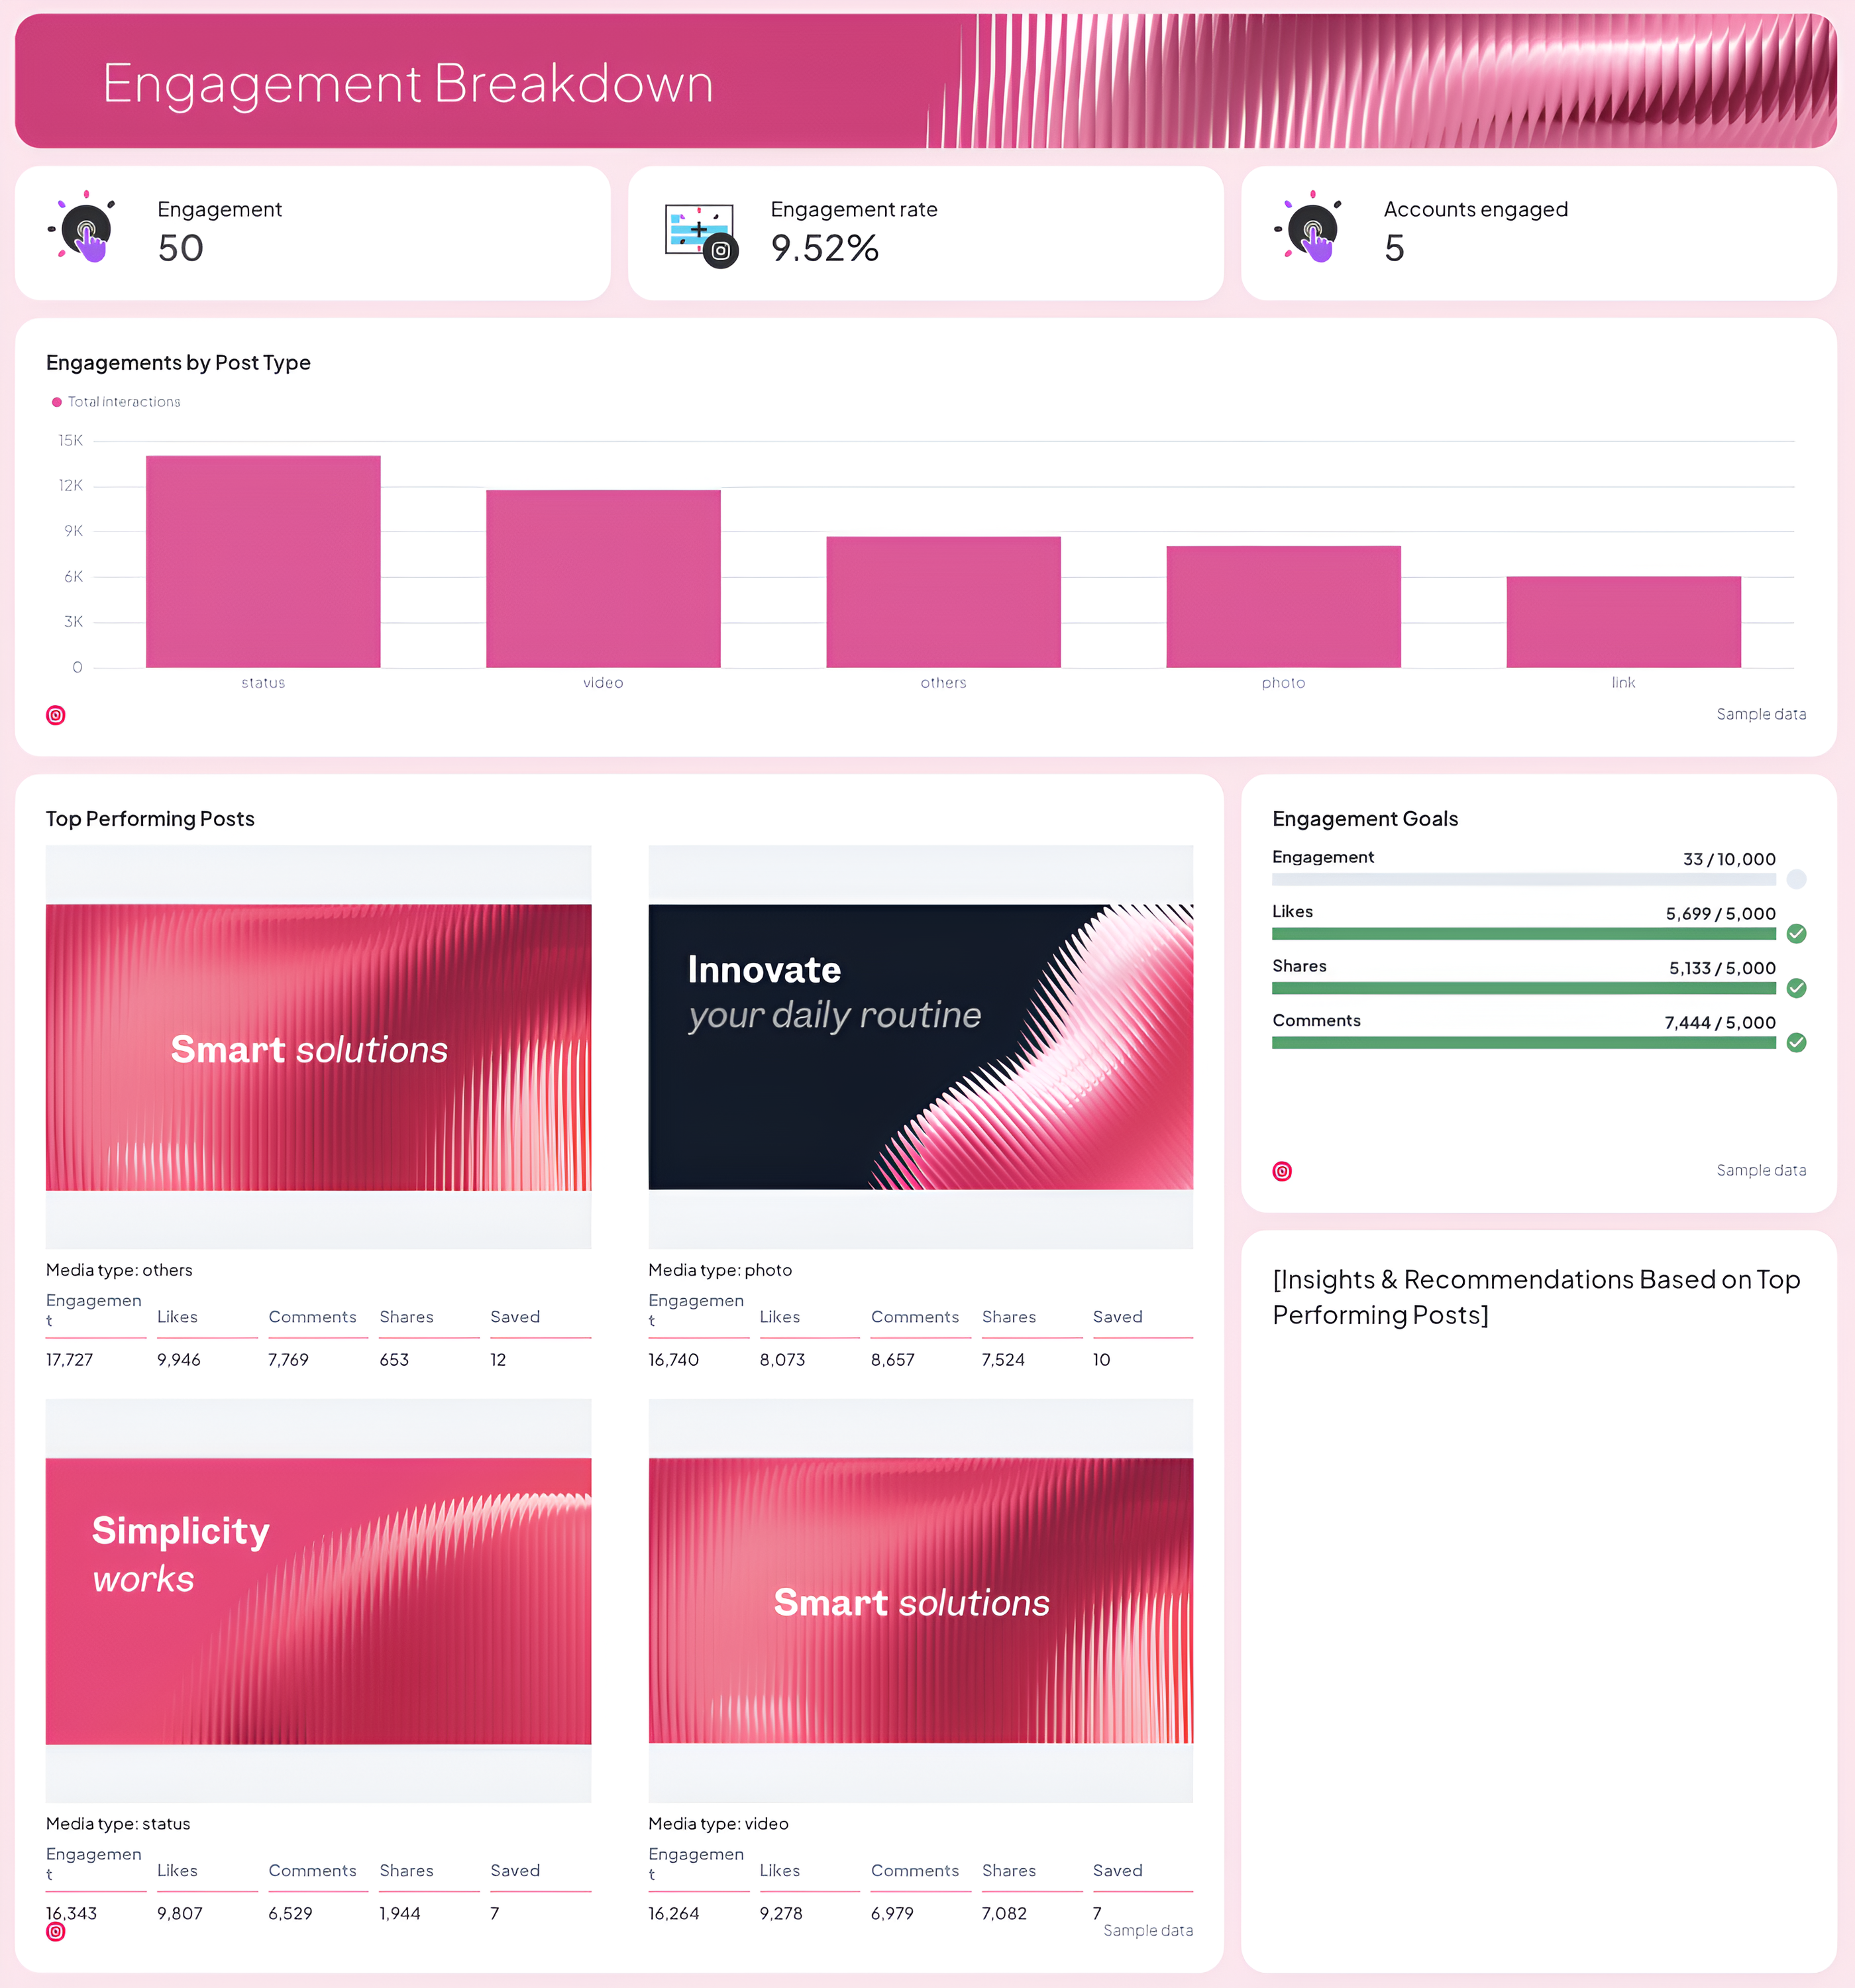
Engagement is the heart of every Instagram performance report.
In this example, you’ll see:
- Engagement metrics like total interactions, engagement rate, and accounts engaged
- A chart breaks down engagement by post type (photo, video, or carousel)
- The top-performing posts appear in a carousel format, showcasing visuals, likes, comments, and saves
There’s also a text widget where you can add actionable insights or recommendations.
This section makes it easy for social media managers to pinpoint what content drives the highest engagement.
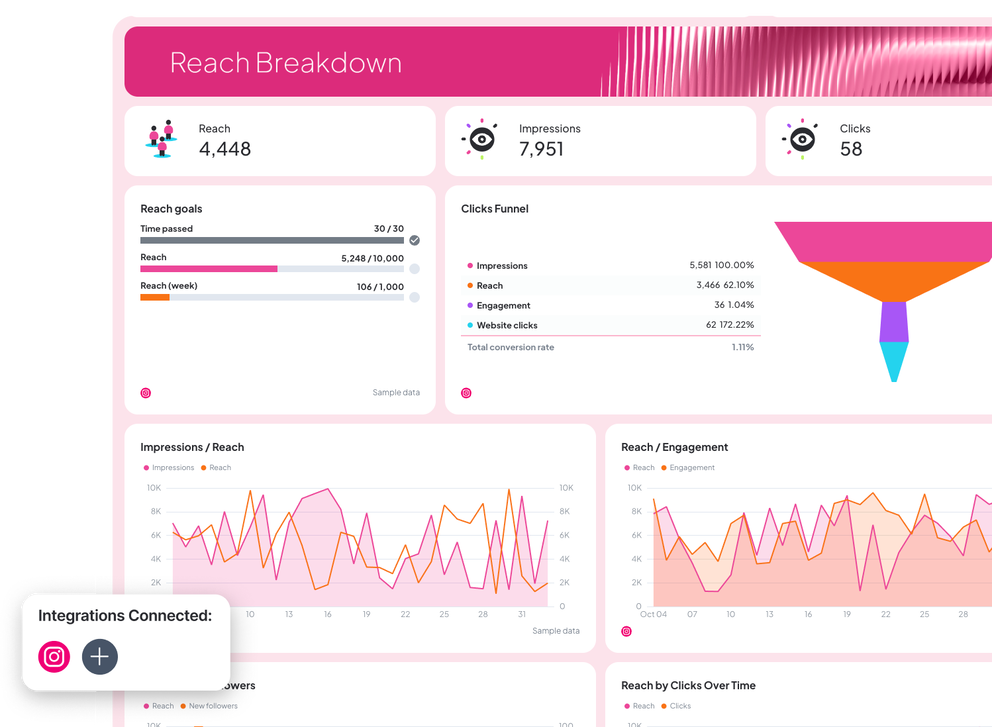
4. Reach Breakdown
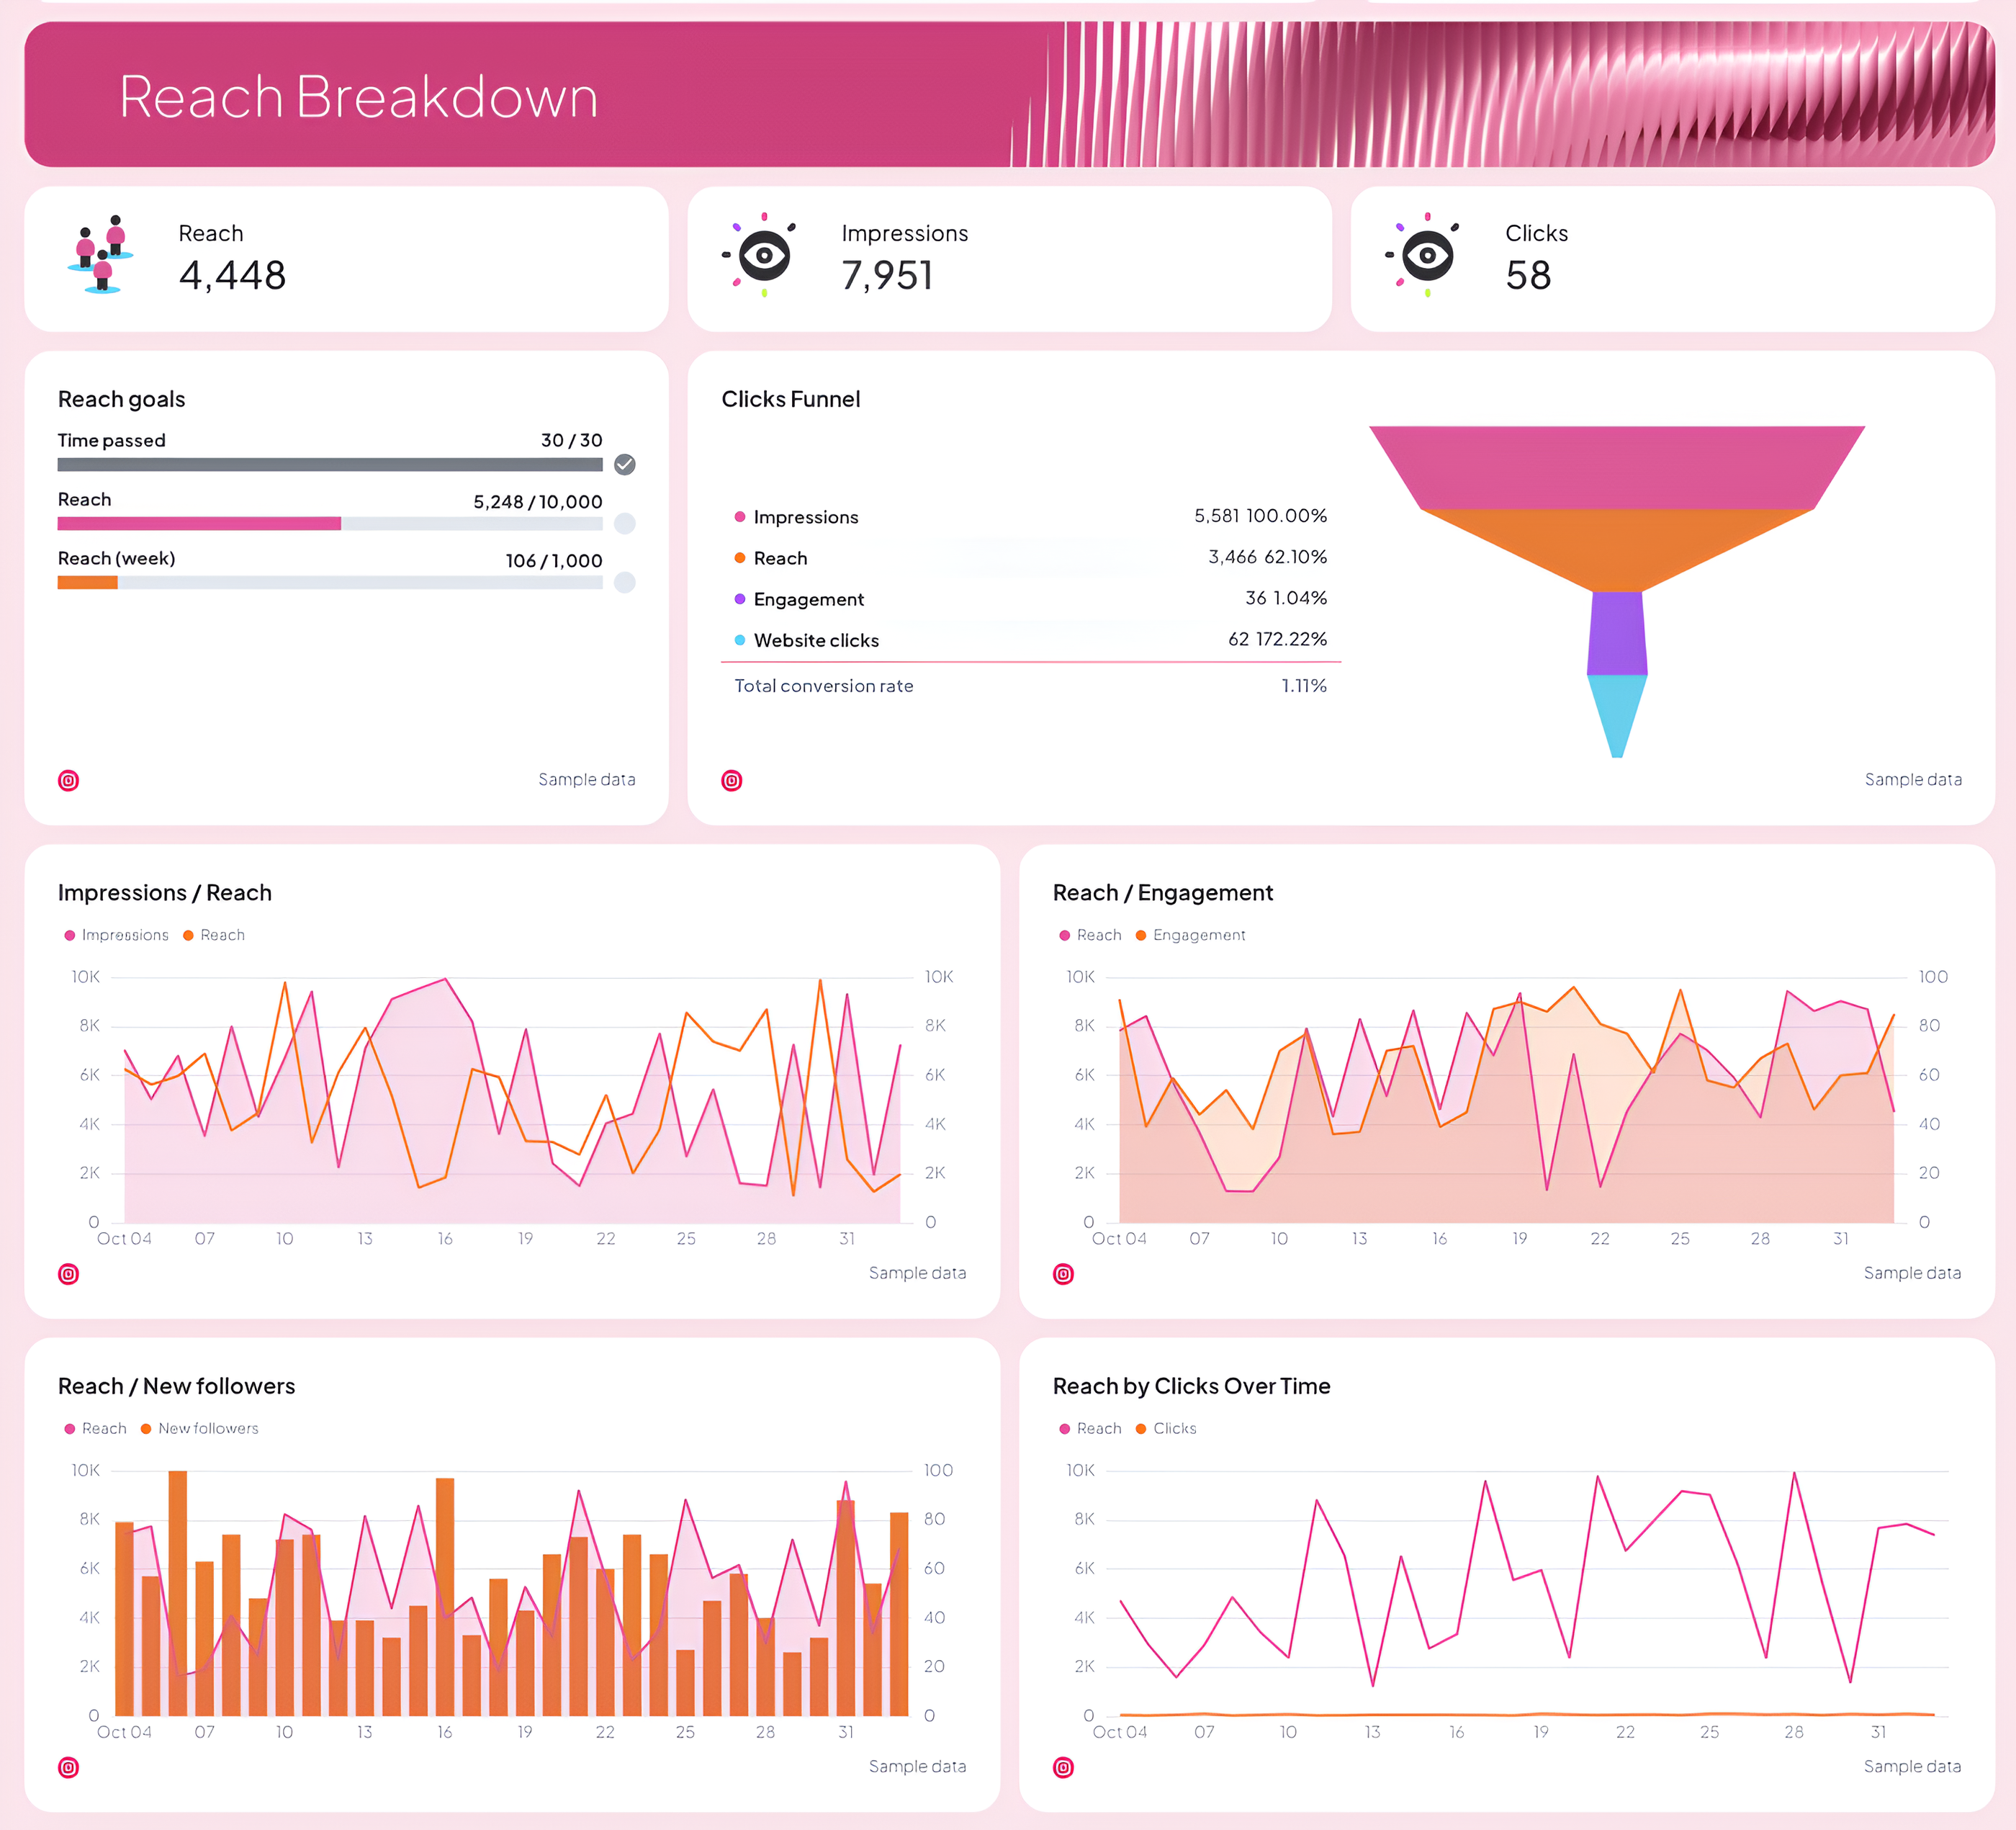
The reach breakdown gives a big-picture view of how far your content travels.
The example includes:
- Impressions, reach, and clicks at a glance.
- A goals tracker and click funnel showing the user journey from impression to website visit.
- Visual graphs comparing reach versus engagement, impressions versus reach, and reach versus new followers.
It’s a great way to connect visibility with performance and see how each Instagram campaign contributes to your overall performance.
5. Wrap-Up Section
Every strong Instagram analytics report example ends with a summary of results and next steps.
Whatagraph’s automated reporting helps you:
- Highlight top-performing posts, Instagram Stories, and Reels.
- Add custom reports or white-label them for clients.
- Automate delivery to send weekly or monthly updates to your stakeholders.
This final section ties together your key metrics and gives clear direction for the next reporting cycle.


